
How to Remove Duplicates in Apple Numbers
Apple introduces Apple Numbers as the ultimate online spreadsheet program for Mac or iOS users, and it serves as an…
Mar 09, 2023
In Apple Numbers, charts are critical elements in a presentation, especially when you talk about values and sales over a specific period of time. This visual presentation aids reporters or presenters to convey and show understandable data to their audiences.
Pie charts can be challenging to make, especially when it is your first time using MacBook. While it does provide multiple features and tools, it can also be overwhelming to navigate, so we prepared steps to guide you to create pie charts in apple numbers.
You can notice that the graph icon is grayed out when your sheet is empty. That is because you need to set up a table first with your contents for the graph icon to be available. First, click the table sheet icon that allows you to choose the kind of table you want, and write your contents–whether sales, financial expenses, or financial plan.
After that, you need to select your content by using your mouse and dragging the indicator. After dragging the indicator, you can release it and click the graph icon. After clicking the graph icon, you can see a dropdown with various graphs including pie charts.
After clicking the graph icon, you can see the graph chart. You will need to click the pie chart of your choice. As you can see, there is an arrow indicating you swipe for more pie chart styles, allowing you to choose according to your preference.
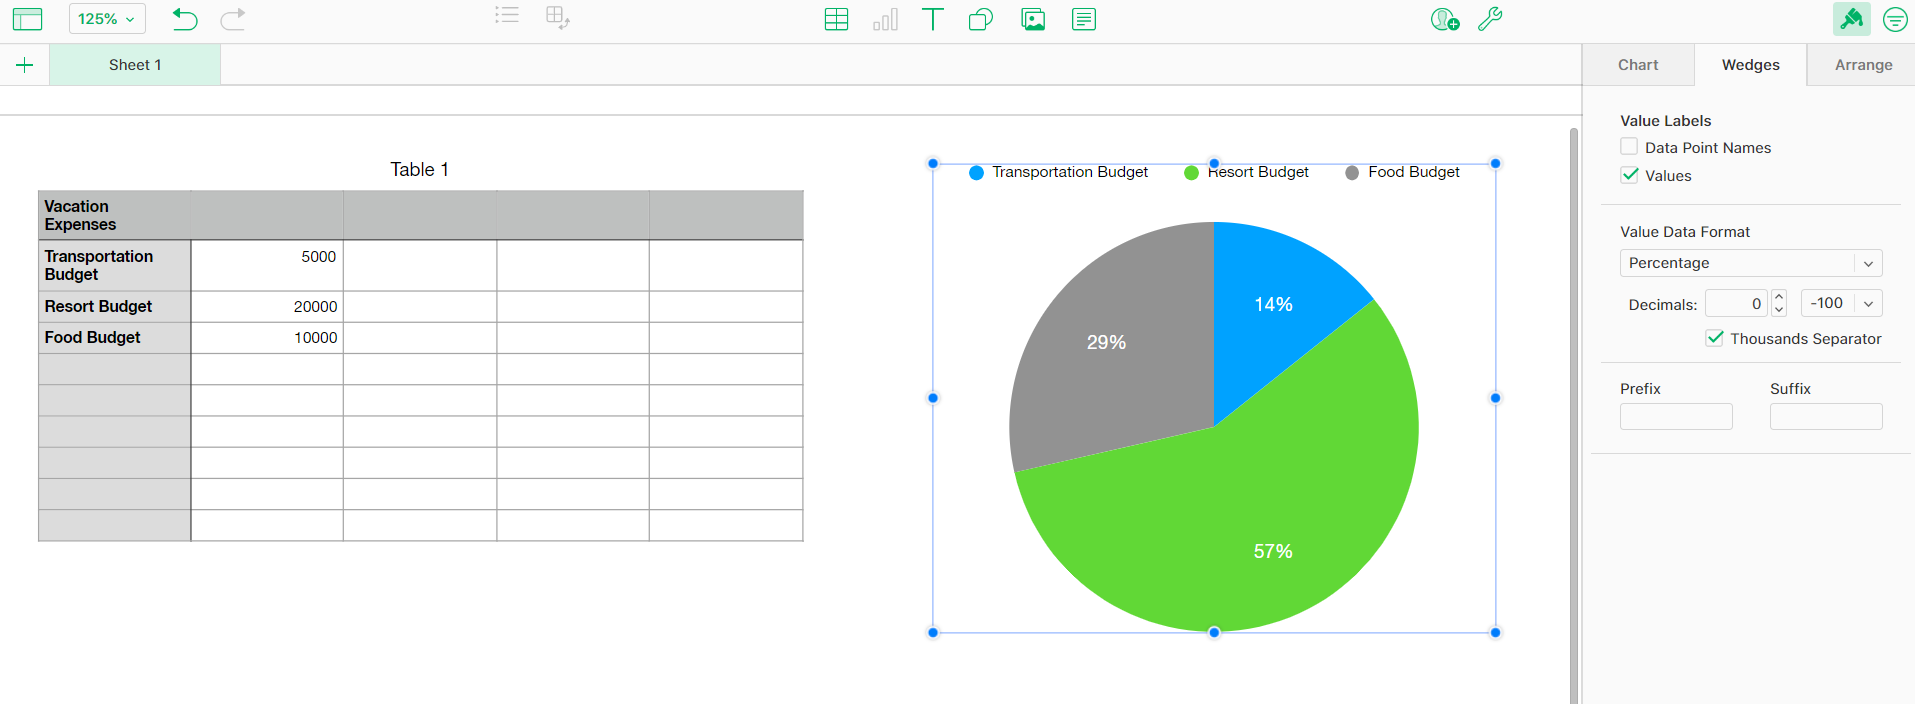 After selecting and clicking the pie icon, you will see that your content is automatically absorbed or recognized by the pie chart. At first, you can see, that the values are first presented using percentages. However, if you prefer another value data format, you will need to click the pie chart and you can see the wedge bar in the sidebar tool. That way, you will see the value data format bar, allowing you to choose your pie chart value data format.
Professionals use pie charts as it helps them present value and critical information, especially in a form of numbers, leading viewers or audiences to grapes the presentation easily.
As all MacBook users know, Apple Numbers have optimized features and tools that allow them to generate their spreadsheets, timeline, presentations, and other documentation with ease and quality.
First, create a table, write contents, select your contents, release it, click the graph icon above your sheet to its dropdown, and choose a chart.
You can use Mac Numbers when you need to develop a spreadsheet or timetable for your schoolwork or corporate work as it allows you to generate sheets or choose existing templates and save your time.
After clicking a chart or graph icon above your sheet, clicking the chart will prompt you with a sidebar tool, allowing you to examine tools that will change the looks of your chart.

Apple introduces Apple Numbers as the ultimate online spreadsheet program for Mac or iOS users, and it serves as an…
One of the key features of Apple Numbers and other spreadsheet software applications is the data filter tool. Adding filters…

Page breaks are helpful to users because they can serve as useful guides for distinguishing between pages in any type…

One of the many features of Apple Keynote is customizing the orientation of a text, shape, or any object. Simply…
![How To Make/Create a Drop Down List in Apple Numbers [Templates + Examples] 2023](https://images.template.net/wp-content/uploads/2022/08/How-To-MakeCreate-a-Drop-Down-List-in-Apple-Numbers-Templates-Examples-2023-01-788x443.jpg)
Creating a drop down list is relatively easy if you are using a spreadsheet application like Apple Numbers. Spreadsheet applications…

Rounding up numbers is fairly easy and straightforward in mathematical theory. But if you are using a spreadsheet application like…
Apple Numbers is Microsoft Excel’s competitor with a similar function. On Numbers, you can create spreadsheets to organize data that…

Apple Final Cut Pro is a software that professional and personal users use for seamless video enhancing and editing of…

Apple Keynote is a slideshow creating and rendering program that many Apple users enjoy. Aside from simply playing a slideshow…