
How to Remove Duplicates in Apple Numbers
Apple introduces Apple Numbers as the ultimate online spreadsheet program for Mac or iOS users, and it serves as an…
Apr 17, 2023
Line graphs are important elements in documentation, especially when you evaluate records regarding a factor with long periods of duration. Such as assessment of the sales and profits in multiple past years.
Line graphs help individuals support their statement regarding a topic that presents estimation and calculation. A very example of this is when calculating money over the past years. Since generating line graphs in apple numbers can be time-consuming and challenging, here are the steps to guide you to have a smooth line graph development.
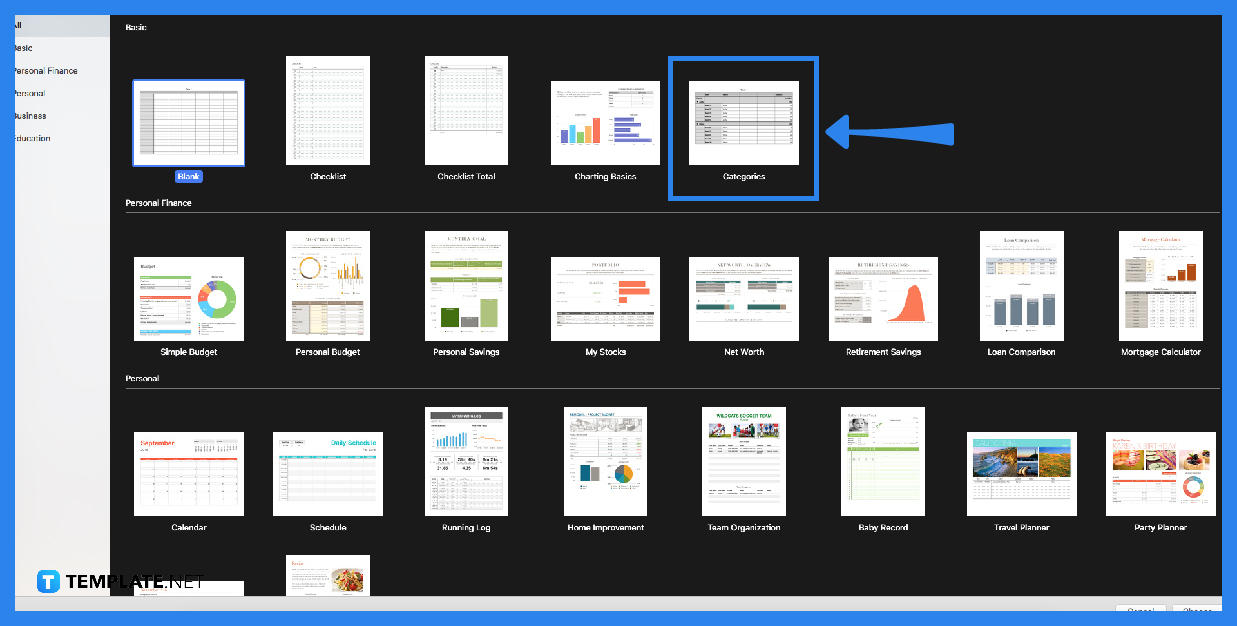
You cannot click the graph icon if there is no existing content, such as a table with contents of months and numbers. That is why you need to choose a spreadsheet template first, or you can generate a table manually.
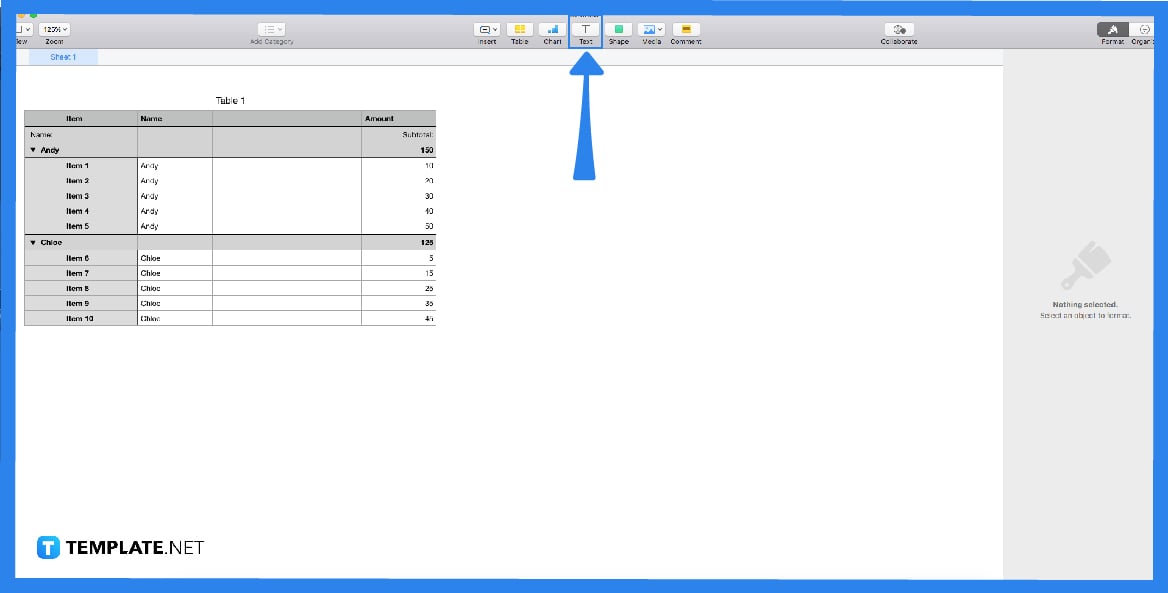
For the graph to determine your data, you will need to write the content first in the table. You will need to put the numbers, days, months, or years on the table and organize them. Click the table to allow you to type the contents. Below is an example of the image of this step.
With the contents on the table, you will now use your mouse. Drag your mouse from the first row until the last row of your provided content. You can see the mouse indicator as it showcases a flexible box with a blue line. That way, the contents are included in your next step.
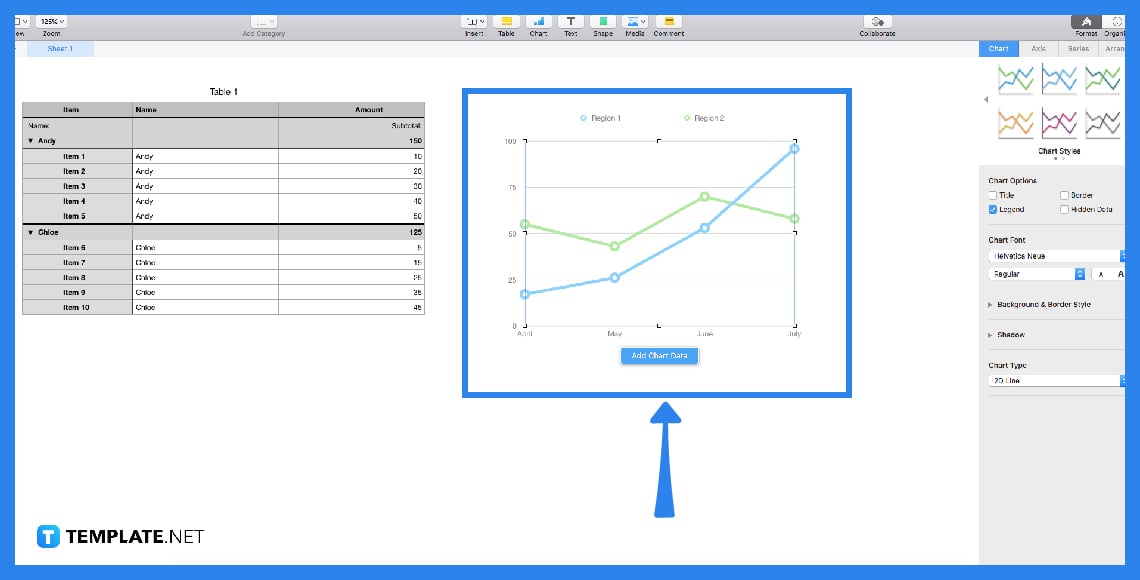
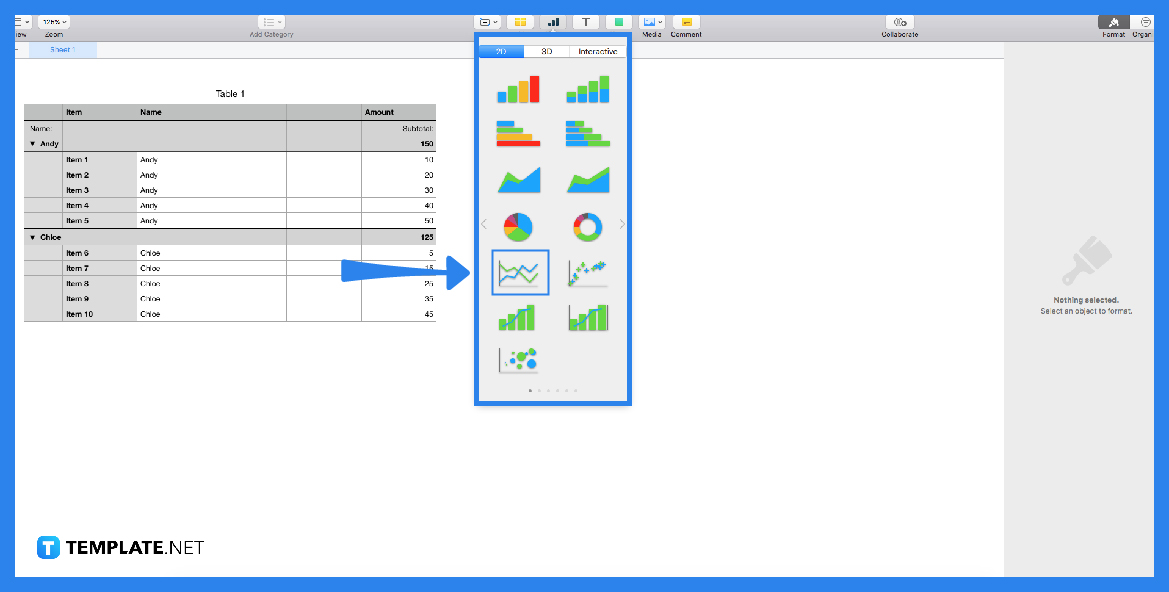
With the contents inside the flexible box, you can click the graph icon that is located above the sheet. After you click it, it will prompt choices of graph styles, enabling you to choose the graph you prefer. When you click your chosen graph, you can now see the graph with your data from the table.
As we all know, multiple industries use graphs to compare data from past events or business performance within a specific span. A line graph is a visual presentation of data, especially values or estimations. It allows users to understand numbers more effectively.
A lot of people use Macs, iPhones, and iPad. Apple numbers are accessible in these gadgets, allowing apple users to generate spreadsheets for their personal plans and work projects. Apple numbers provide tables, graphs, shapes, etc.
You can change the color of your spreadsheet cells by clicking your table first. After you click it, you can see the sidebar tool pop up. In the sidebar tool, you can see the cell button; click it to see the drop-down menu. After that, you are given multiple options to resize and design your cells, including choosing colors for your cells.
To intersect two shapes in apple pages, you first need to add the shapes to your document. After that, you will click the shapes by holding the control or shift, then click the shapes. When you see the box indicators in the shapes, you will click arrange button in the sidebar tool. After the drop-down menu, you will see the bottom with intersect button, then click it.

Apple introduces Apple Numbers as the ultimate online spreadsheet program for Mac or iOS users, and it serves as an…
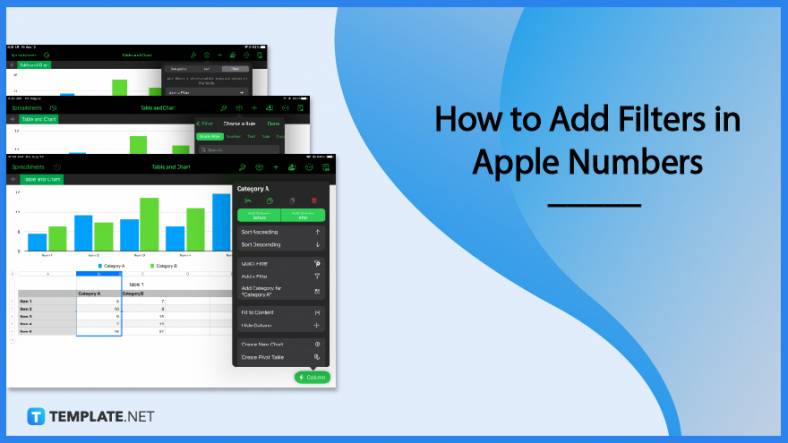
One of the key features of Apple Numbers and other spreadsheet software applications is the data filter tool. Adding filters…

Page breaks are helpful to users because they can serve as useful guides for distinguishing between pages in any type…

One of the many features of Apple Keynote is customizing the orientation of a text, shape, or any object. Simply…
![How To Make/Create a Drop Down List in Apple Numbers [Templates + Examples] 2023](https://images.template.net/wp-content/uploads/2022/08/How-To-MakeCreate-a-Drop-Down-List-in-Apple-Numbers-Templates-Examples-2023-01-788x443.jpg)
Creating a drop down list is relatively easy if you are using a spreadsheet application like Apple Numbers. Spreadsheet applications…

Rounding up numbers is fairly easy and straightforward in mathematical theory. But if you are using a spreadsheet application like…
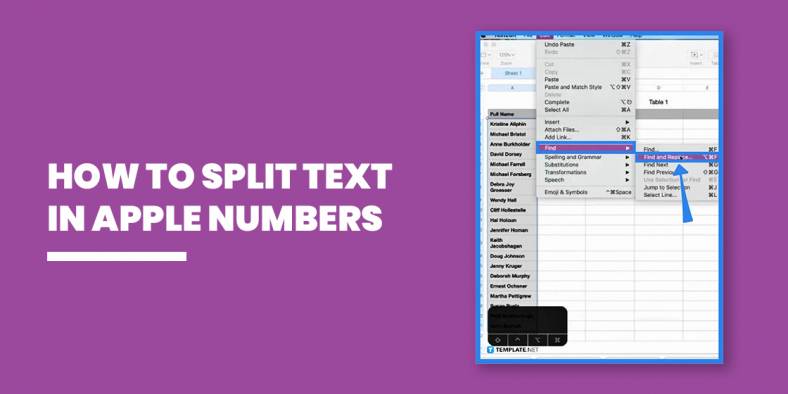
Apple Numbers is Microsoft Excel’s competitor with a similar function. On Numbers, you can create spreadsheets to organize data that…

Apple Final Cut Pro is a software that professional and personal users use for seamless video enhancing and editing of…

Apple Keynote is a slideshow creating and rendering program that many Apple users enjoy. Aside from simply playing a slideshow…