


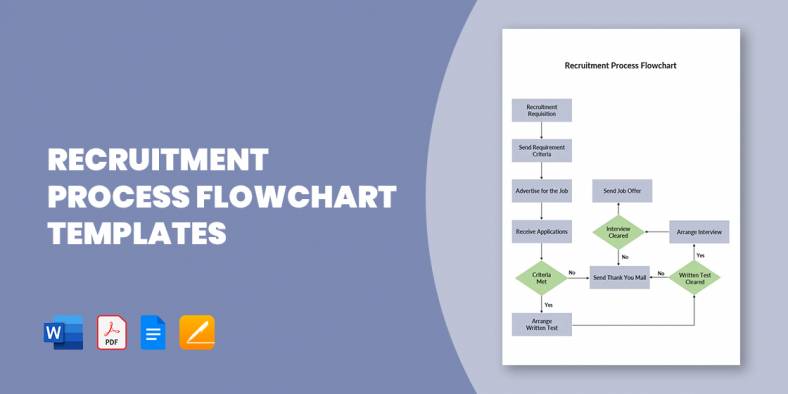
15+ Recruitment Process Flowchart Templates in PDF | MS Word
A flowchart of the recruitment and selection process, also known as recruitment workflow, is a design that outlines out the…
Jan 29, 2020


Jun 21, 2022
One of the most unique and novel ways of representing data on a chart is with the bubbles. In this widely used system, the size of the bubbles will represent the magnitude of the parameter that these bubbles represent. This is also a very accurate and one of the most precise means of representing data by means of a chart. A sample bubble chart, therefore, is a chart template that is drawn out with the data or a parameter to be measured made into bubbles of variable sizes.Free Bubble charts have been used for a long time now to accurately estimate parameters and their measures.

Blank Chart Templates Wedding Seating Chart Templates

Bubble charts are the most extensively used tool to represent data in business meetings. The bubble chart templates are freely available online and referred by business executives to create custom presentations. Size and area of bubble represents the magnitude of a parameter and the chart represents various parameters together.

A bubble chart template is used to represent numerical values pertaining to a set of data. Therefore, it is best apt for positive values of data, although negative values can also be represent ted and are distinguished from positive values through a color difference in bubbles.

Bubbles in a bubble chart are representations of various parameters plotted to integrating study a set of data. The size of bubble plays a role in depicting the parameter size or involvement or higher value of an aspect in the study. Free bubble chart templates are helpful in saving time.

Every sales team of an organization or business needs to keep record of sales data so that the performance can be evaluated and corrective measures can be taken to improve sales. Bubble chart templates can be used to represent sales done by a company during a particular time frame.

coe.unm.edu
Bubble chart templates are used by business executives and stakeholders because they have a lot of advantages over the traditionally used spreadsheets. The templates can be browsed through from a number of free online resources and custom modified to create one as per need. These help the business executives in decision making for important aspects that focus on improving the performance of employees, productivity if a business and hence its overall profitability. The bubble charts use different colors to depict various parameters that helps understand the data on a single platform.
Bubble charts are needed when there are a number of values for a data and needs to be represented together on one platform. The values are represented as circles or discs. The bubble charts are beneficial when data sets have hundreds of values and even when values have different magnitudes. In these charts, area of the circle or disc is used to represent the numbers. The charts are best suited when plotting positive values for a data. Although negative values can be represented and they are distinguished by color difference.
Sample bubble chart templates are required in almost every aspect of business. These are beneficial to represent data that has numerous values or values that have huge order in terms of magnitude. These are easy to represent the status of an ongoing project, are visual representations that enhance visibility of different parameters. These templates can be easily modified and edited as per data. The user gets a single view of all aspects integrated together. When the templates are used online, they have an auto update feature too that saves the time of user. Thus, using bubble chart templates can be of great help when a business project needs to be presented in front of clients and core members of an organization. These charts help facilitate understanding of various aspects related to project and the relationship shared among those parameters.
A bubble chart template is designed based on the project’s necessity. Before you download one of the sample bubble chart templates that we have got for free, you should know what a bubble chart such as that is usually made up of. Here are all the components of a bubble chart template listed out.
How to Create and Configure a Bubble Chart Template Present your data in a Bubble Chart Template
If you have any DMCA issues on this post, please contact us!
A flowchart of the recruitment and selection process, also known as recruitment workflow, is a design that outlines out the…
Logistics management is a tough job, as you are to handle a vast network of processes. Plus, the system incorporates…

All businesses require great management, so all operations run smoothly and easily, and management applies to logistics as well. Maybe…
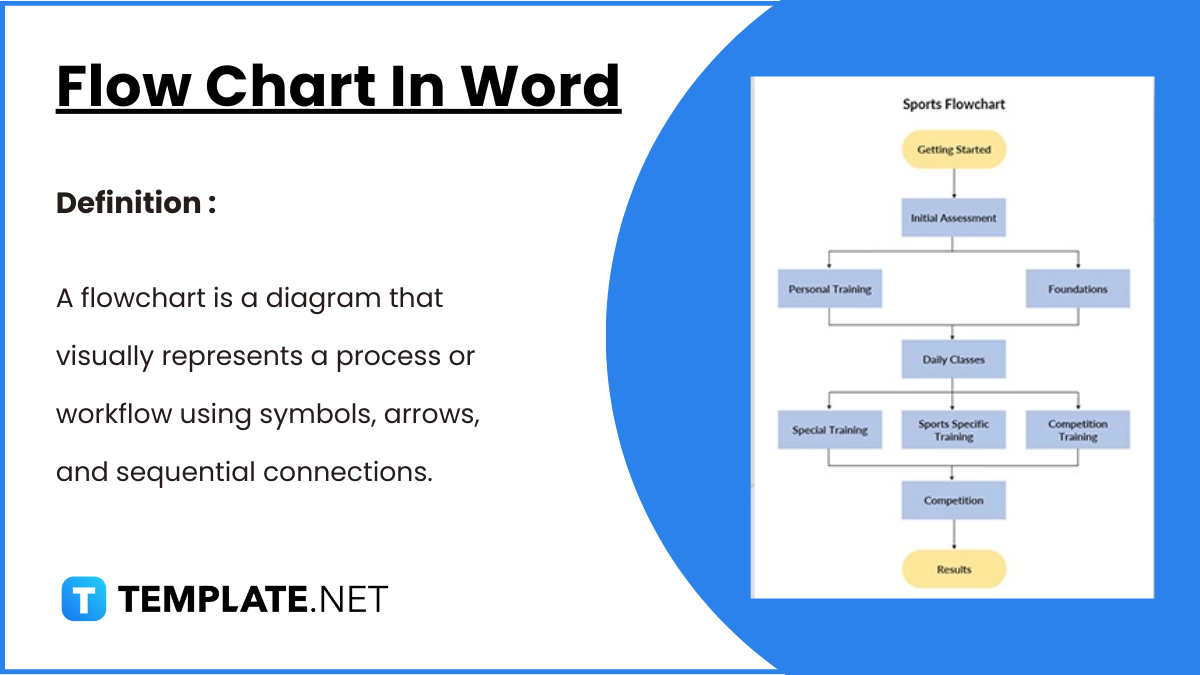
Flowcharts in Word offer a convenient way to visually represent processes, workflows, and systems. With easy-to-use shapes and connectors, Word…
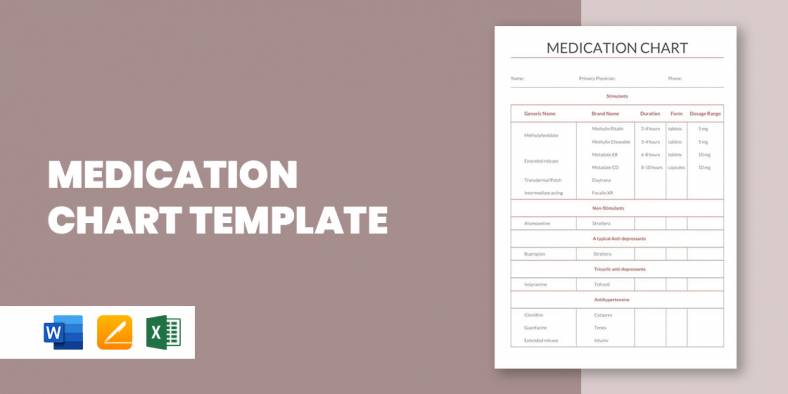
A medication chart template is really handy when you have to keep track of the number of medications prescribed for…
If you have ever had to prepare a flow chart, you’d thoroughly understand that it could be a back breaking…
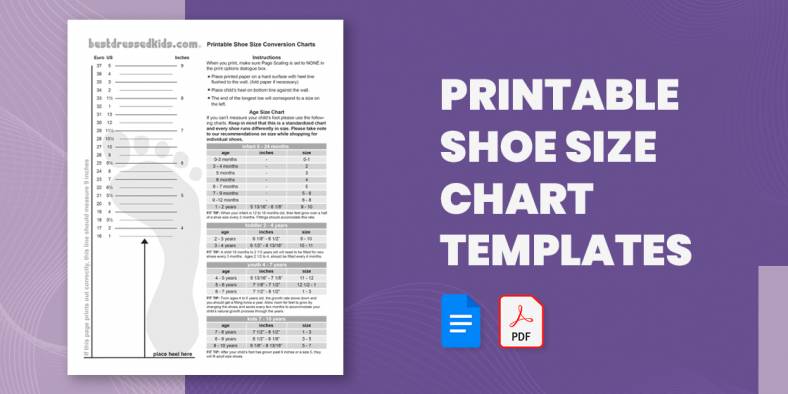
Going shoe shopping soon? Here is a Chart Template to help you avoid the annoyance and embarrassment of getting the…
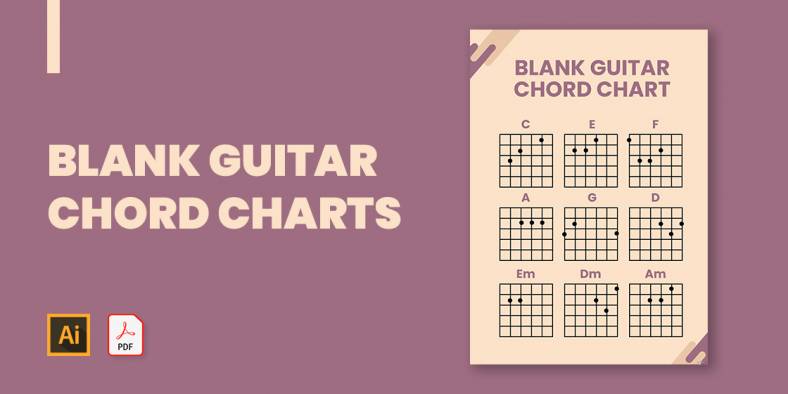
If you plan to show the basics of guitar playing or just want to show how to play a song…

One of the important parameters of the body that needs to constantly be checked and measured is the blood pressure.…