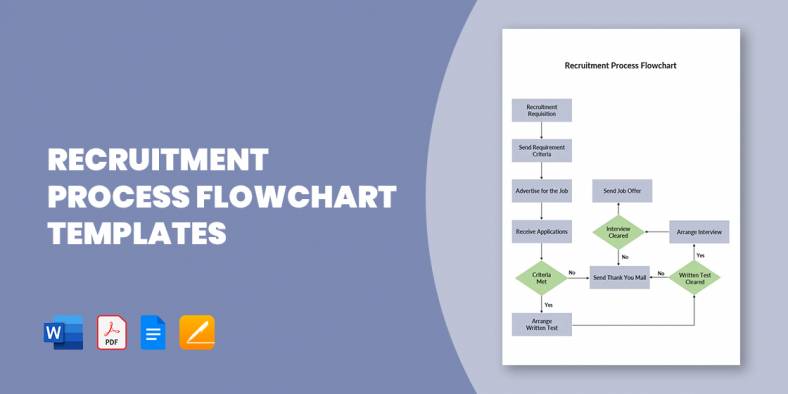
15+ Recruitment Process Flowchart Templates in PDF | MS Word
A flowchart of the recruitment and selection process, also known as recruitment workflow, is a design that outlines out the…
Jan 29, 2020


May 08, 2020
Using statistical graphs to measure things in companies and organizations is a very common practice. It is important to divide these parameters before measuring them up or estimating them in any other means. Charts are often used for such purposes so that an efficient measurement is made. You can also see Comparison Chart Templates


The PSD 3D pie chart generator is an easy to use chart that requires the data as input and generates the pie chart. It creates a 3D pie chart which uses different color to signify the different data.

The Colorful business pie chart template is a pie chart template that uses different colors to show the different data in the pie chart. A normal but colorful pie chart.

The sales pie chart template is an intuitive 3D pie chart that is used to show the sales data of different products. Different colors are used to show the different data. freeexcelcharts.com

This sample pie chart would be handy when you have to make a comparison on a wide range of products say 8. The chart contains a list which shows which color represents which product group. freeexcelcharts.com

Graph tool is an intuitive and efficient python module that creates superb pie charts. Using this tool visually attractive pie charts can be created which looks good and also serves the purpose.

The pie charts template provides an overview of the different type of pie charts that can be used in the presentation. It shows the different colors that the template uses to create pie chart.

The modern pie chart is a well detailed comprehensive pie chart. It not only uses different data in the pie chart, but also provides details about each data in the pie chart.

powerpointslides.net


studenthandouts.com

ndetp.org

screensmartschools.ca
Pie chart is one such chart that is used to divide certain information into portions of a circle. Pie charts have been used extensively for ages for comparative studies and for dividing something into portions. It is the oldest chart form that has ever been used for measurement of quantities and comparative studies. A pie chart template is designed based on the necessity of the company and the parameters to be measured. Before you download one of the sample pie chart templates that we have got for Free Chart Templates, you should know what a chart such as that is usually made up of. Here are all the components of a pie chart template listed out.

A flowchart of the recruitment and selection process, also known as recruitment workflow, is a design that outlines out the…
Logistics management is a tough job, as you are to handle a vast network of processes. Plus, the system incorporates…

All businesses require great management, so all operations run smoothly and easily, and management applies to logistics as well. Maybe…
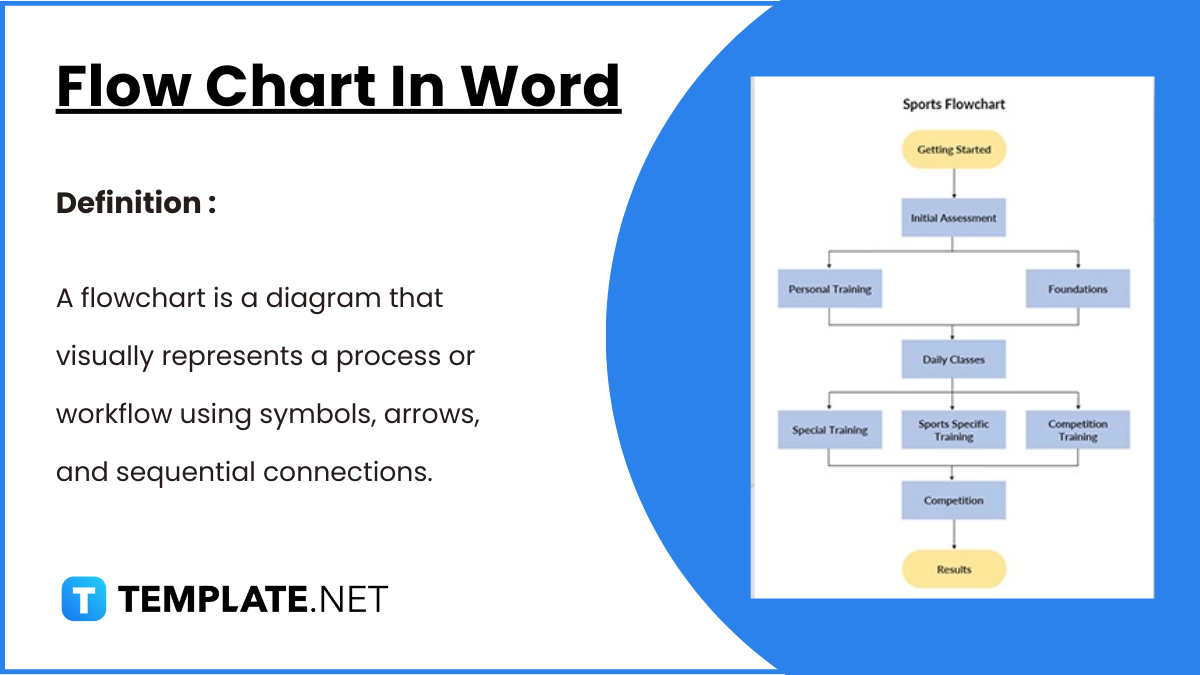
Flowcharts in Word offer a convenient way to visually represent processes, workflows, and systems. With easy-to-use shapes and connectors, Word…
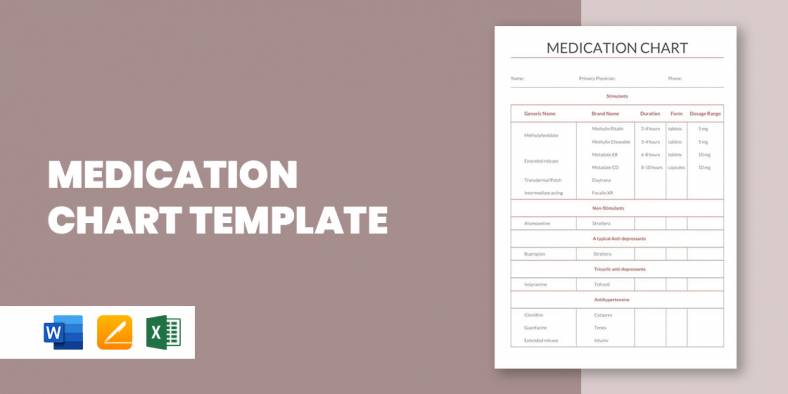
A medication chart template is really handy when you have to keep track of the number of medications prescribed for…
If you have ever had to prepare a flow chart, you’d thoroughly understand that it could be a back breaking…
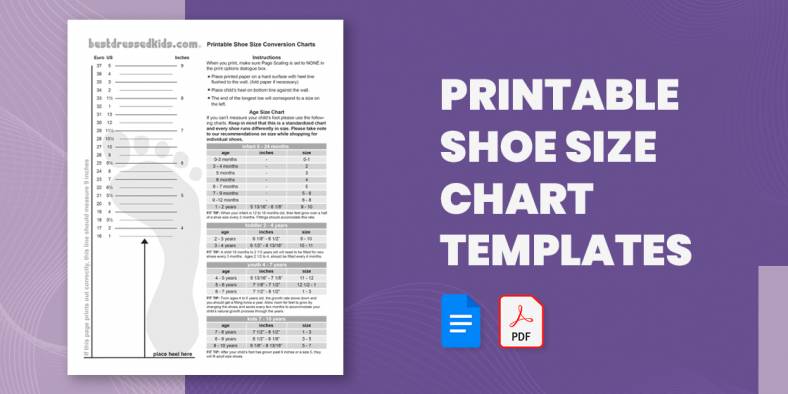
Going shoe shopping soon? Here is a Chart Template to help you avoid the annoyance and embarrassment of getting the…

If you plan to show the basics of guitar playing or just want to show how to play a song…

One of the important parameters of the body that needs to constantly be checked and measured is the blood pressure.…