


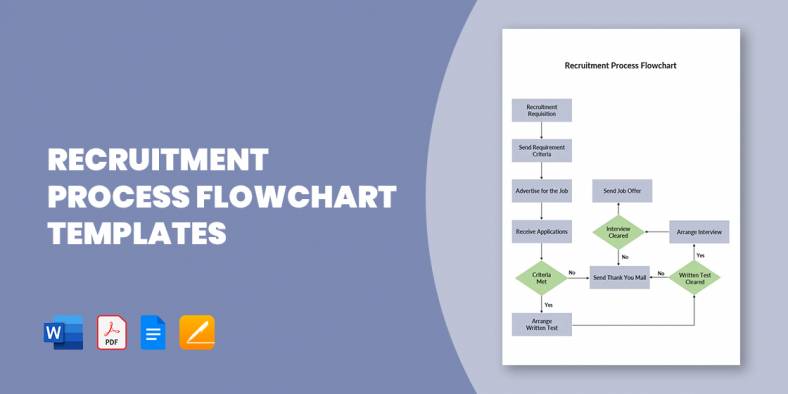
15+ Recruitment Process Flowchart Templates in PDF | MS Word
A flowchart of the recruitment and selection process, also known as recruitment workflow, is a design that outlines out the…
Jan 29, 2020


Dec 09, 2022
A process flow chart is a diagram commonly used to imply the overall stream of plant procedures and equipment in chemical and process engineering. The process flow chart describes the relationship between a plant facility’s major equipment and does not demonstrate important details such as details of the piping and classifications.

 austinisd.org
 ac.uk
ac.uk rainalgoma.ca
 ku.edu
 surrey.ac.uk
 uct.ac
Various types of flow charts are used to record and evaluate processes in business and industry. This helps undertakings to gain prominence in a business process or industrial operation’s proverbial ‘nuts and bolts’. Commercial organizations, when analyzing the various stages of such processes in a flowchart, should use different types of flowcharts to detect potential weaknesses. Additionally, the data shown on the flowcharts can help standardize the different phases of a productivity and quality process.
Such flowcharts demonstrate the movement of paper and electronic records among the different units of an organization. Such flowcharts are a valuable tool that helps analysts within an enterprise to grasp, analyze, record, and improve different work processes. Keep in mind that document flowcharts must be read from left to right among the different types of flowcharts, as they demonstrate the movement of documents through separate business bases.
The optimal document flowchart makes it much easier for staff and administrators to define the location of internal controls within an organization, among the different types of flowcharts. Document flowcharts can be used by business organizations to learn with facts independent of assumptions and projections of the management framework. These devices also provide a clear view of business operations and empower a firm to achieve business goals.
Such flowcharts, often recognized as a flow of data diagram (DFD), are a graphical representation of the data flow within a management system. Keep in mind that a DFD is a conceptual phase that helps maintain a process summary without disclosing any volume of graphical information. The standard data flowchart focuses primarily on the networks by which information is being conveyed within a program. Modern DFDs appeared in the software development sector in the 1970s. Modern data flow diagrams employ two distinct classes of notations. These notes represent processes, stores of data, data flows and external entities. DFDs based on the Gane and Sarson system depict processes as rounded cornered squares.
Those visual depictions illustrate how data flows within a system, and how decisions to regulate events are performed. System flowcharts typically use connected symbols to illustrate what happens at different data points inside a system. Software designers may, for example, use various types of flowcharts. A system flowchart, though, is ideal for showing data flow through procedures such as data input, software programs, storage media, integrated circuits and microprocessors, and communications systems. A system flowchart can depict the cruise control mechanism in a modern automobile by depicting inputs such as fuel flow to the engine, speed sensor activity, how the system reacts once the car is gaining traction, etc.
These charts are developed with general graphic symbols representing a series of coded commands. Generally, these flowcharts are used to demonstrate the inner workings of a modern centralized database. A modern program flowchart is constructed with the help of four basic symbols. These include a beginning, process, decision, and an end. Program flowcharts help developers and architects of software to locate bugs within pieces of computer code. These systems enhance coding productivity and interact with reviewers and developers of the essential logic of a system.
These visual devices,also known as a process flowchart, illustrate essential,shared relationships between the major components built within an industrial plant. The chemical engineering and process engineering industries commonly use these diagrams to enhance a process or create new procedures. Modern method flow diagrams are using a sequence of signs and notations to transcribe an industrial plant graphically. A process flow illustration helps document manufacturing processes to promote better understanding, strengthen mechanisms for quality control, and training new staff. Those devices can be used by firms to enforce ideal productivity and repeat-ability in project management. A well-constructed process flow diagram allows us to detect bottlenecks and also highlight inefficiencies in the process.
This is a technique of flowcharting that models the many steps within a planned business process. This system portrays a comprehensive sequence of business operations and data flows needed to complete business processes in both the public and private. BPMN was initially designed to help cover the communication gaps that may exist within an organization between the different departments. This model flowchart is intended to give stakeholders a better understanding of a particular process. The BPMN perusal helps process programmers to correctly execute a method. It is widely used by business analysts, process participants, managers, consultants and software developers.
A flowchart of the recruitment and selection process, also known as recruitment workflow, is a design that outlines out the…
Logistics management is a tough job, as you are to handle a vast network of processes. Plus, the system incorporates…

All businesses require great management, so all operations run smoothly and easily, and management applies to logistics as well. Maybe…
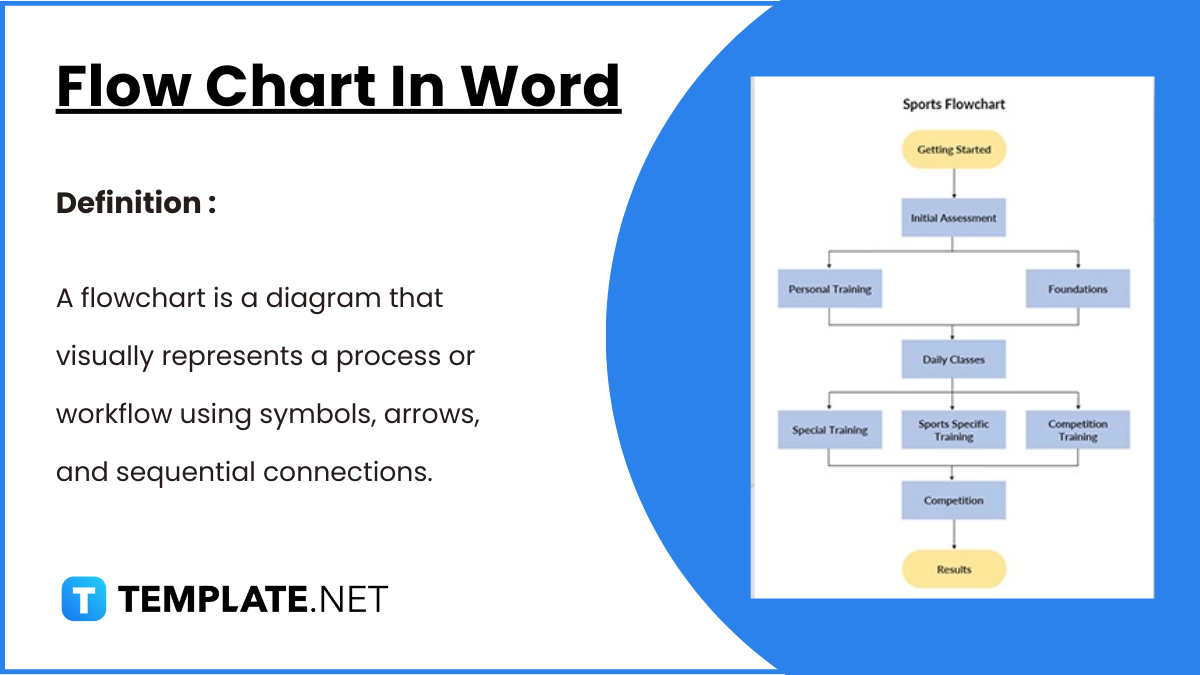
Flowcharts in Word offer a convenient way to visually represent processes, workflows, and systems. With easy-to-use shapes and connectors, Word…
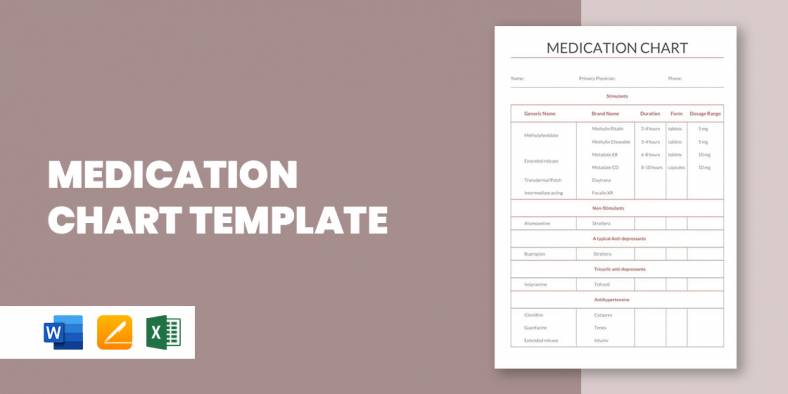
A medication chart template is really handy when you have to keep track of the number of medications prescribed for…
If you have ever had to prepare a flow chart, you’d thoroughly understand that it could be a back breaking…
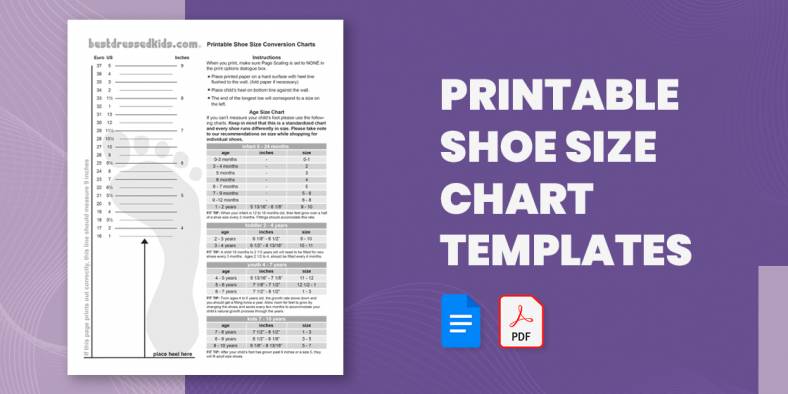
Going shoe shopping soon? Here is a Chart Template to help you avoid the annoyance and embarrassment of getting the…

If you plan to show the basics of guitar playing or just want to show how to play a song…

One of the important parameters of the body that needs to constantly be checked and measured is the blood pressure.…