15+ Recruitment Process Flowchart Templates in PDF | MS Word
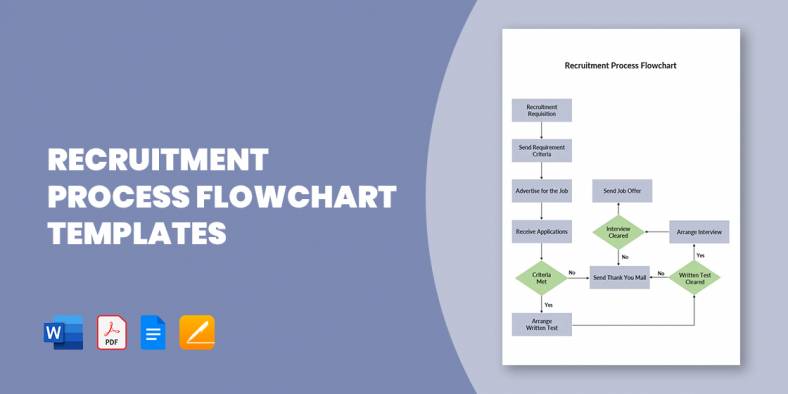
A flowchart of the recruitment and selection process, also known as recruitment workflow, is a design that outlines out the…
Mar 23, 2023
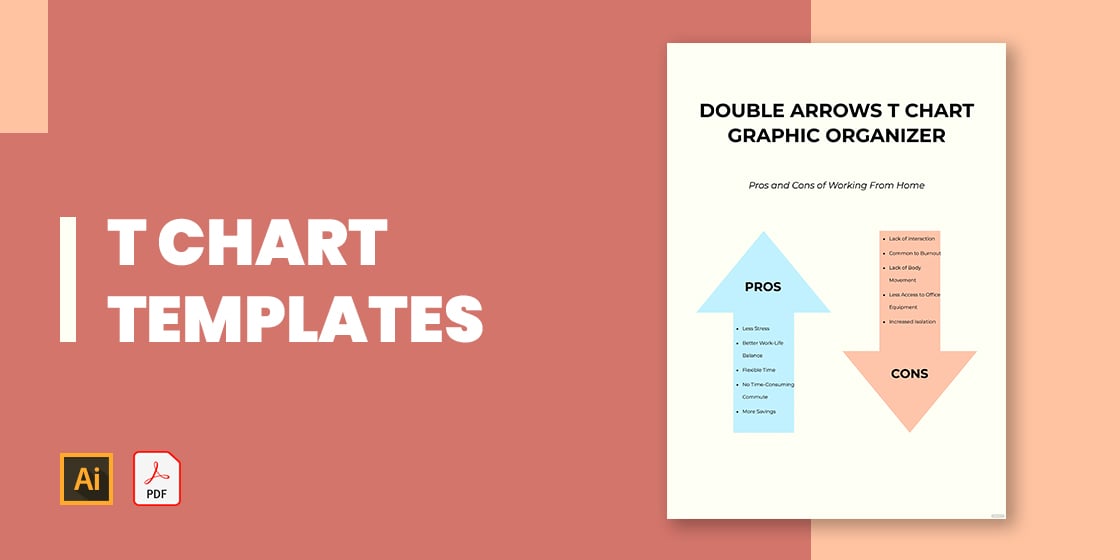
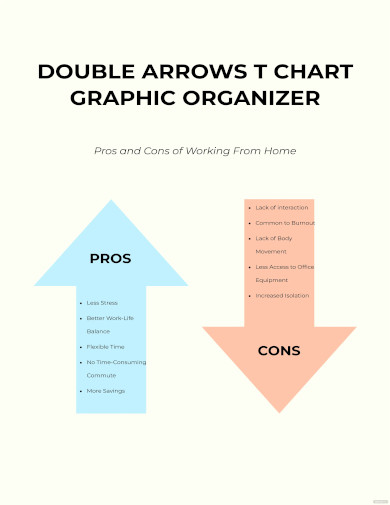
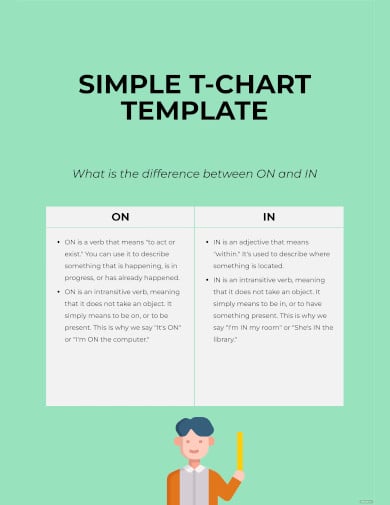
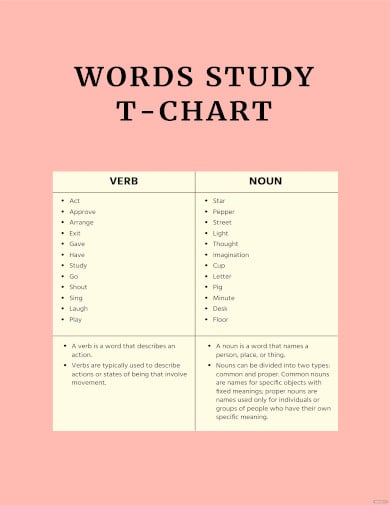
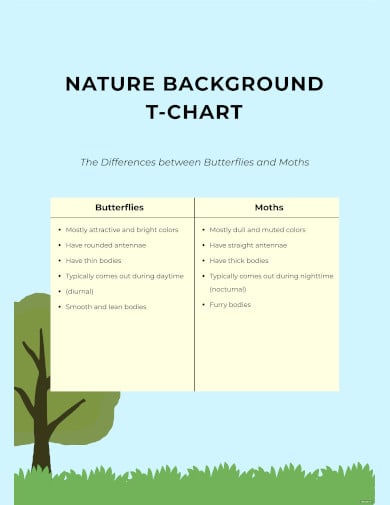
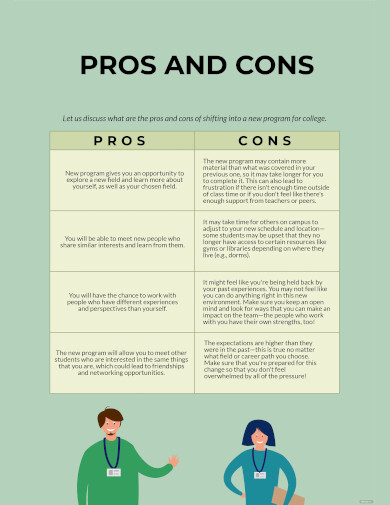
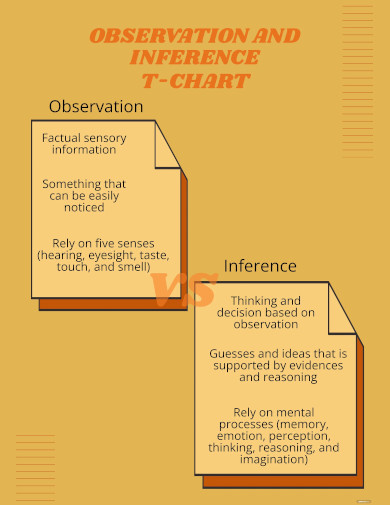
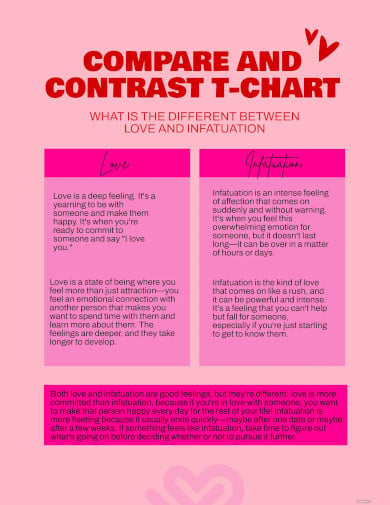
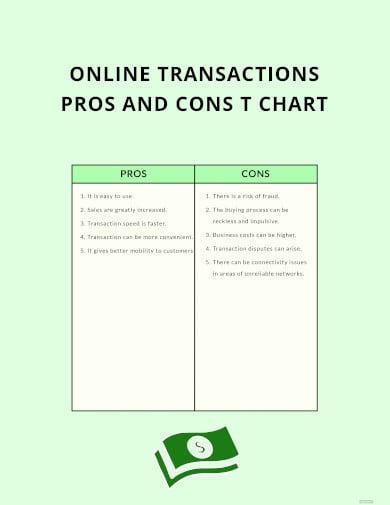
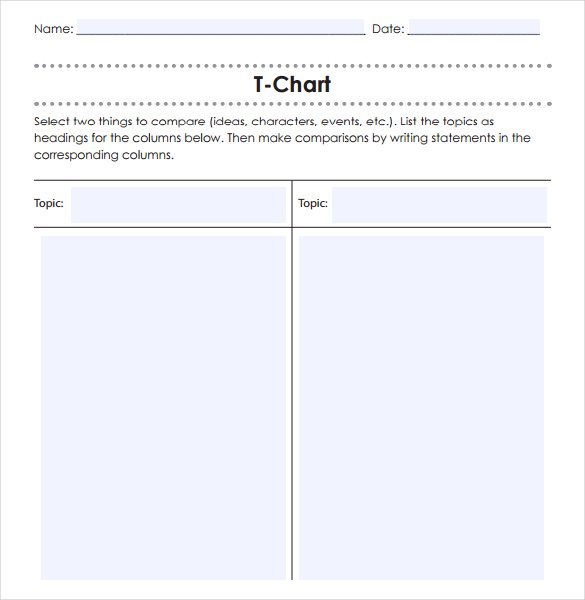
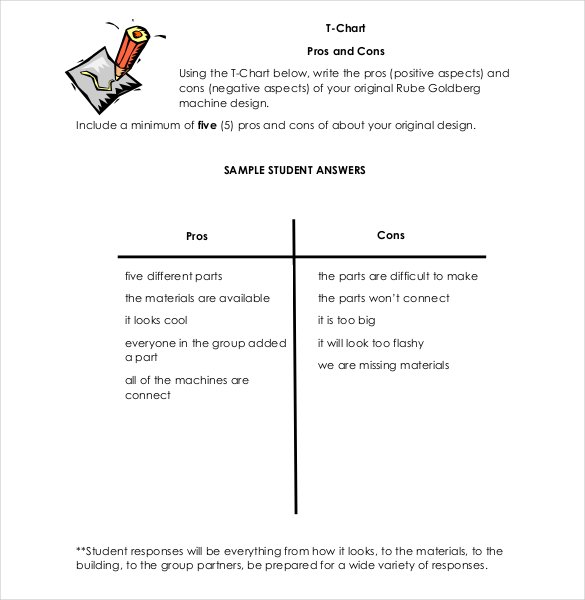
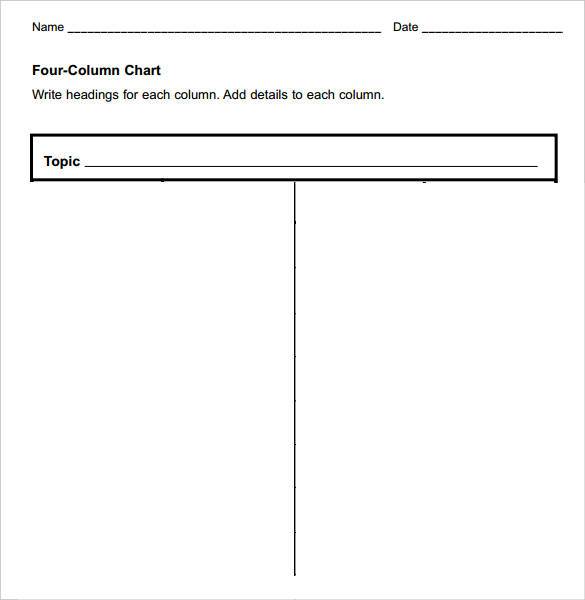
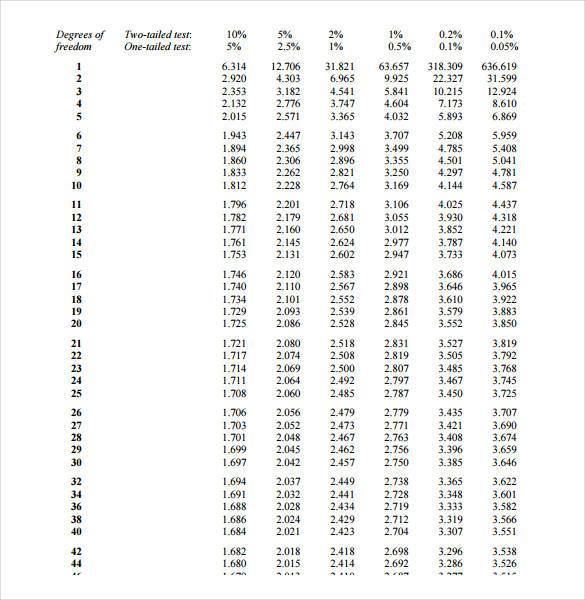
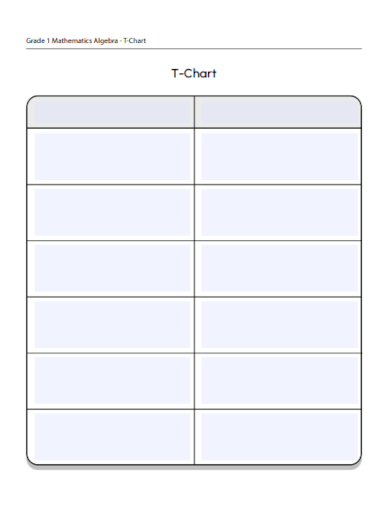
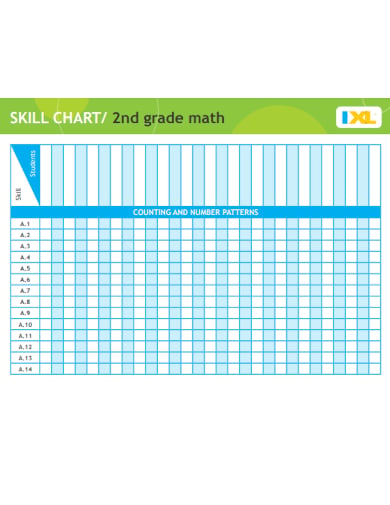
T-charts are a form of comparison charts or graphic organizer that helps the students to list & check two sides of some topic. It could be pros & cons, facts & myths or say advantages & disadvantages. These chart templates flaunt a visual representation of the entire data that helps in a clearer understanding of the topic for the students. You can make a T chart for subjects like first grade math, 2nd grade essay, or even a kindergarten science topic with the various types of templates we have. You can also incorporate an aesthetic to your T chart whether it be lined or minimalist.
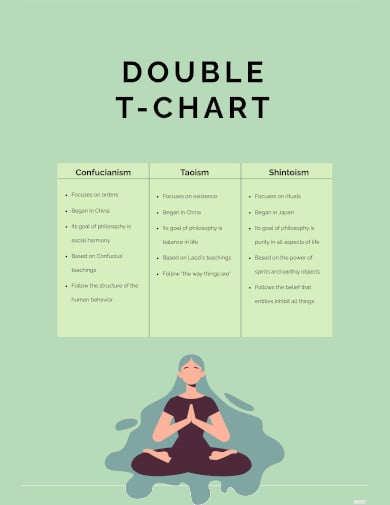
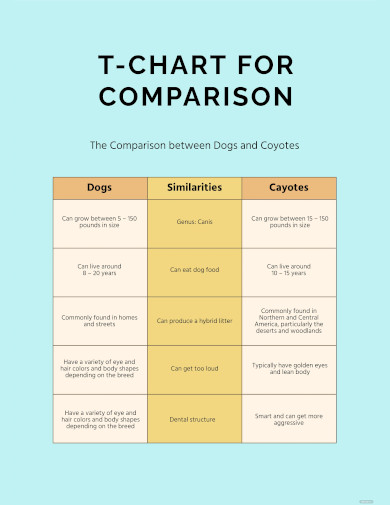

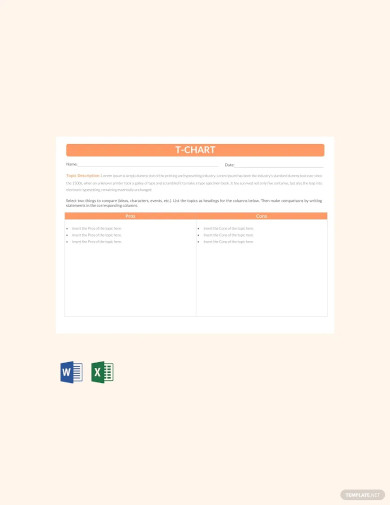
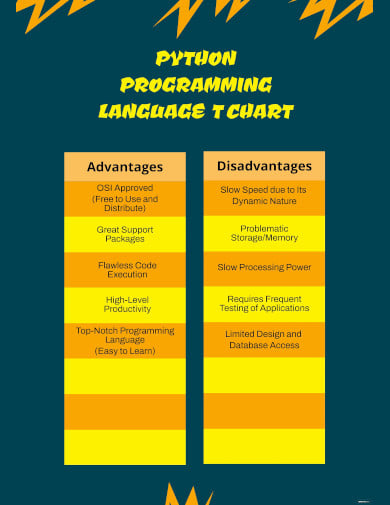
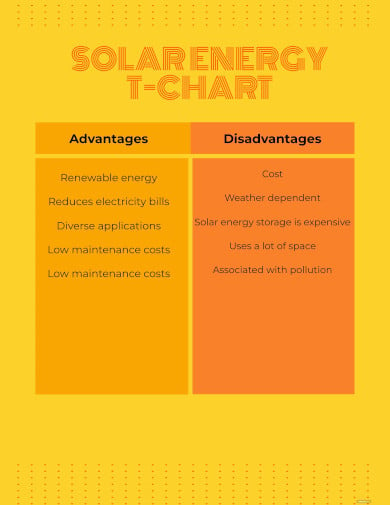
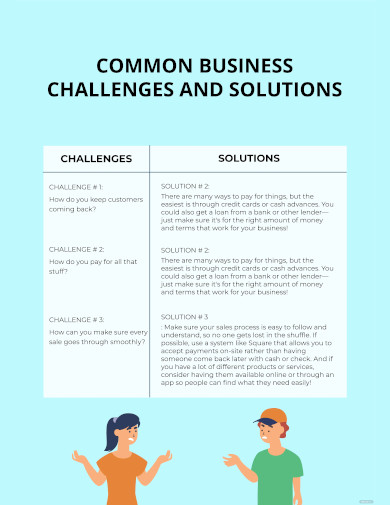

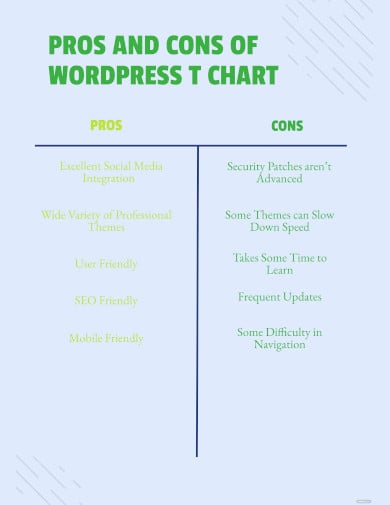
The 3 column T chart is used to write about three things either to differentiate them or to contrast them. Can be used to compare various issues like asking students about their liking towards any two presidential candidates.
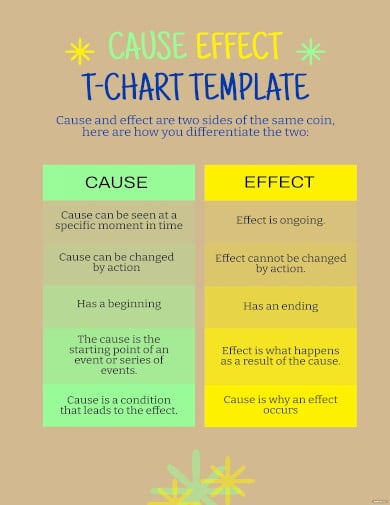
The free cause and effect T chart is mainly used by students to write about cause and effect on various topics, like causes of pollution and its effects. It helps to create a division between the two things and helps to understand them. You can also refer more on student organizational charts.
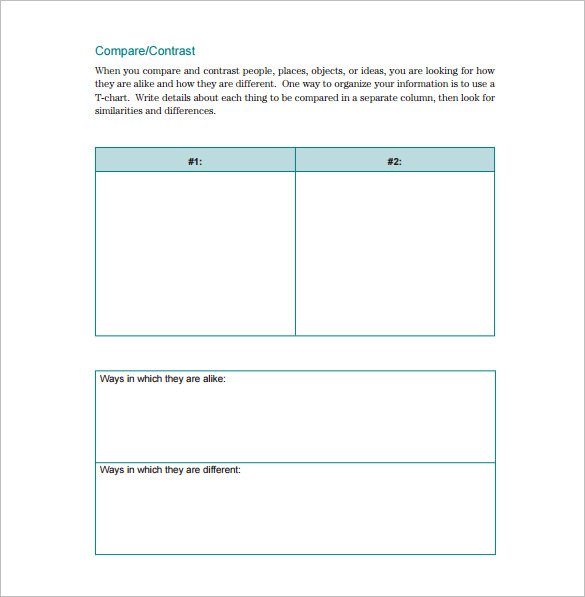
The Box and T chart sample contain a box and a T chart. The box is used to compare or contrast two things and the T chart is used to write the differences between the two things.
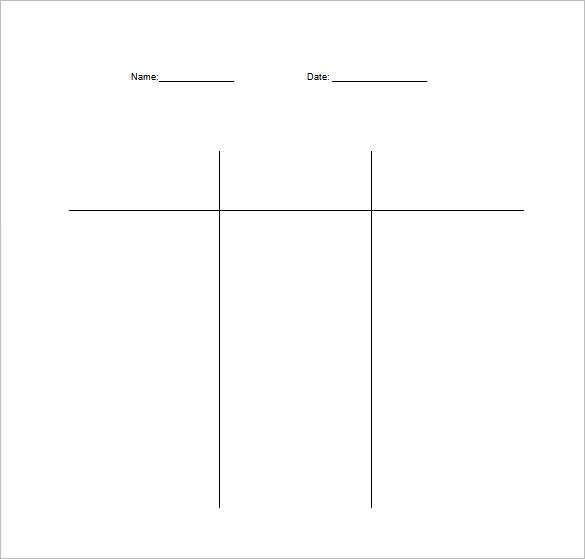
The double T chart sample is used to compare three things together. You are getting a ready-made blank chart here which will save you from creating the entire chart right from the scratch.
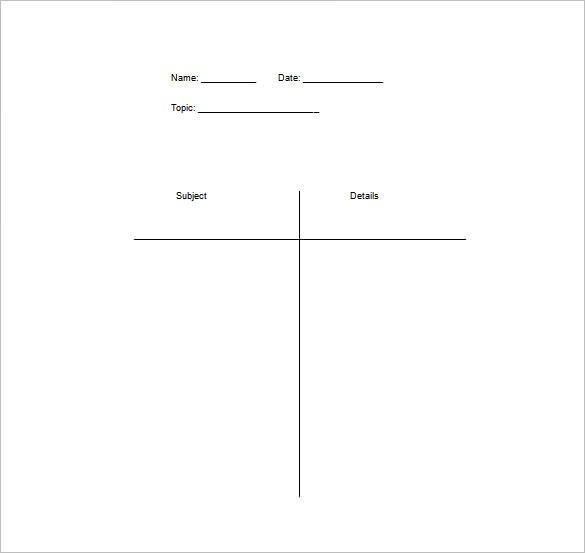
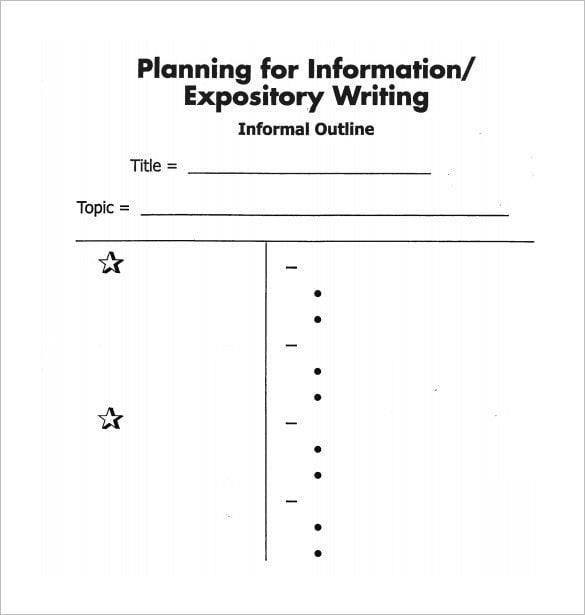
The note-taking T chart sample is useful for its capabilities. A student can easily write the subject in one column and take note for the respective subject in the second column.
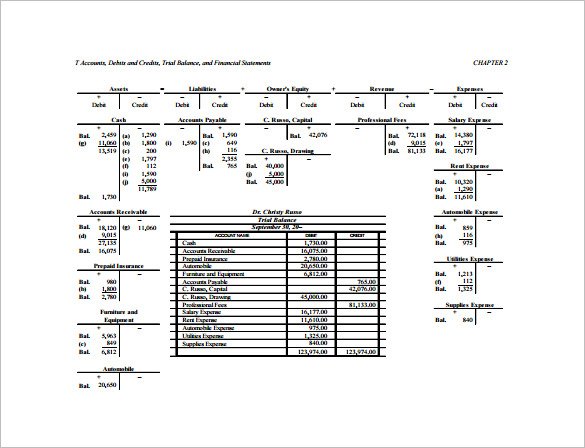
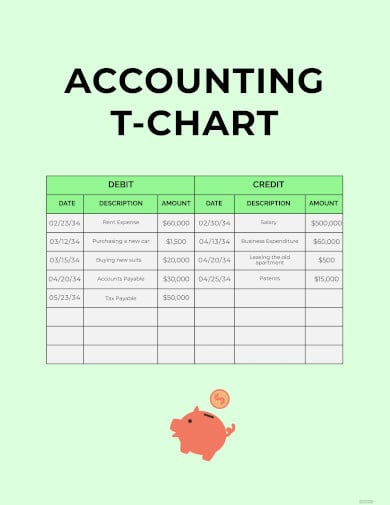
cengage.com | You are getting an elaborate accounting T simple chart template here where you have more than 10 charts on one page and one final chart in the middle. The charts compare various aspects like expense, equity, etc.
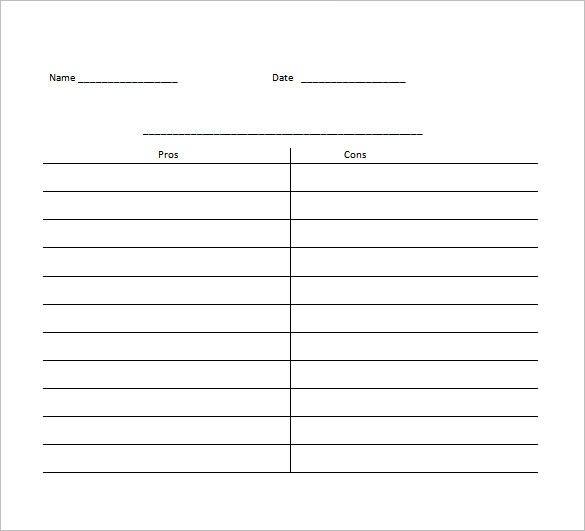
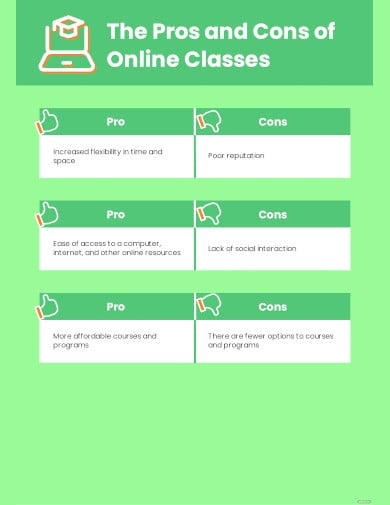
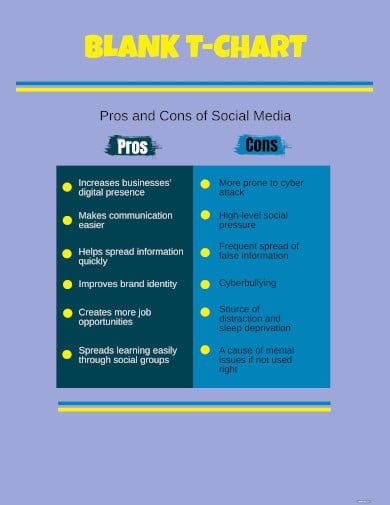
The blank T chart sample is used to write down the pros and cons of a particular issue. It comes in handy when somebody needs to make a decision. It helps to evaluate the issue so that the person can make a good decision.
pfsd.com | Download Now
pcmac.org | Download Now
 ell.nwresd.org
 readwritethink.org
 cpalms.org
 everythingesl.net
 eduplace.com
 historyiscentral.org
 eduplace.com
 home.ubalt.edu
 elementary.tvolearn.com
 in.ixl.com
T chart is usually a tabulated form of data that is used to compare all forms of data. A T Chart can be easily designed using MS Word. Here is how this can be done.
T charts are comparison tables or graphical organizers that are used to compare and assess the two facets of any given topic. Here are some of the main uses of a T chart.
These are easy to design and take lesser time than designing simple flow chart in Word. These basic chart templates are used by students from 3rd to 8th grades and it helps them to compare and study a wide variety of topics. It t chart statistics could be some scientific phenomenon, book characters, events from social studies, and so on.

A flowchart of the recruitment and selection process, also known as recruitment workflow, is a design that outlines out the…
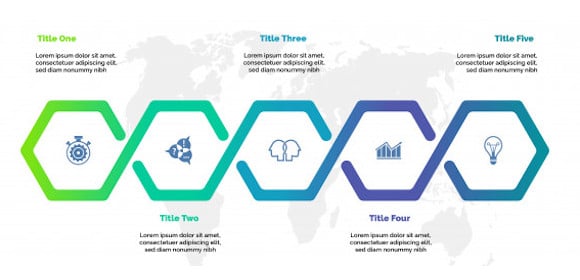
Logistics management is a tough job, as you are to handle a vast network of processes. Plus, the system incorporates…

All businesses require great management, so all operations run smoothly and easily, and management applies to logistics as well. Maybe…
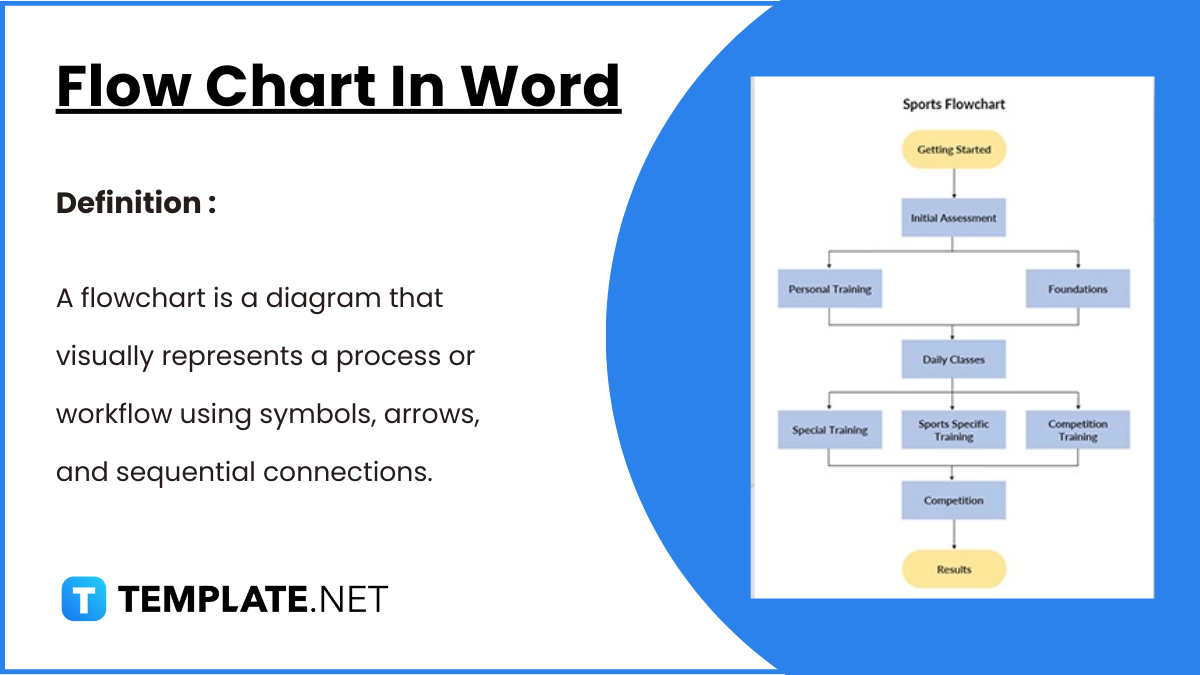
Flowcharts in Word offer a convenient way to visually represent processes, workflows, and systems. With easy-to-use shapes and connectors, Word…
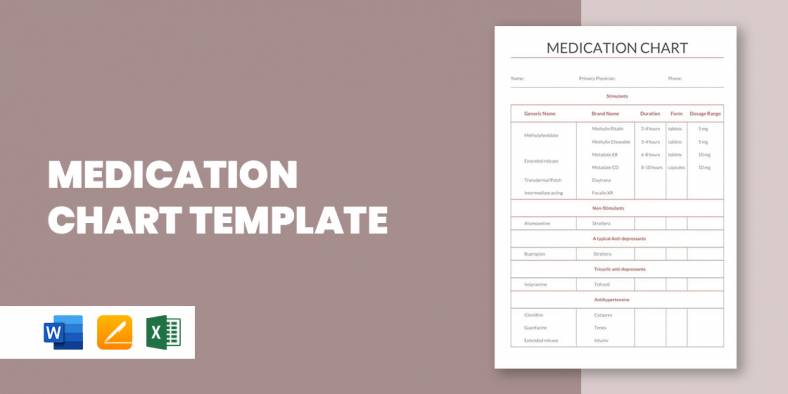
A medication chart template is really handy when you have to keep track of the number of medications prescribed for…
If you have ever had to prepare a flow chart, you’d thoroughly understand that it could be a back breaking…
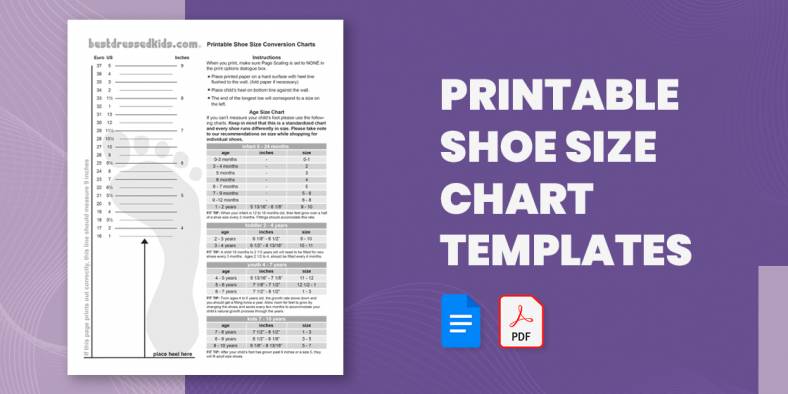
Going shoe shopping soon? Here is a Chart Template to help you avoid the annoyance and embarrassment of getting the…
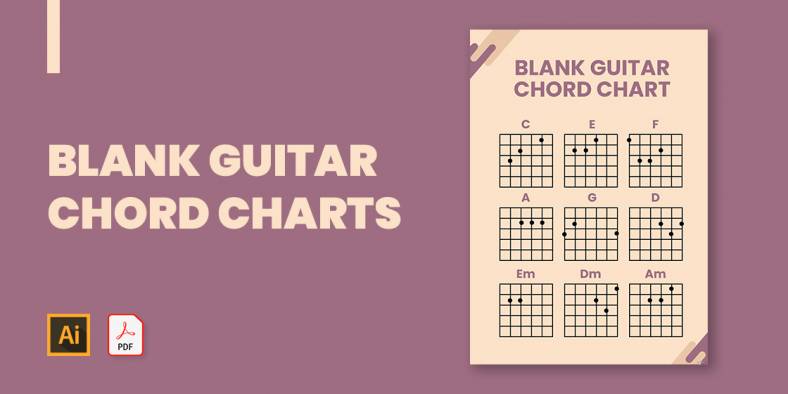
If you plan to show the basics of guitar playing or just want to show how to play a song…
One of the important parameters of the body that needs to constantly be checked and measured is the blood pressure.…