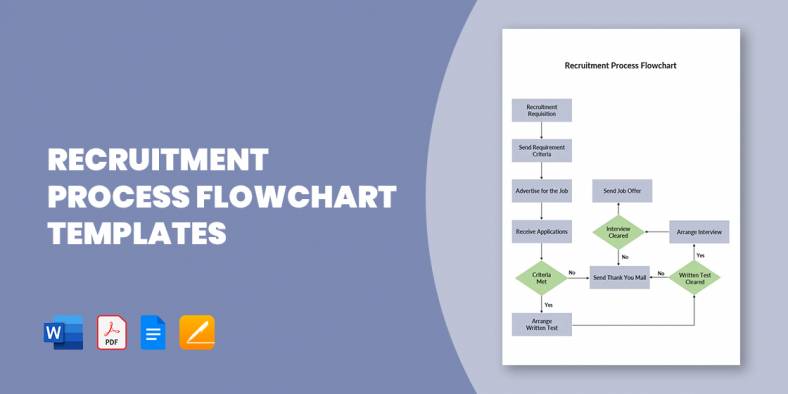
15+ Recruitment Process Flowchart Templates in PDF | MS Word
A flowchart of the recruitment and selection process, also known as recruitment workflow, is a design that outlines out the…
Jan 29, 2020


Jan 30, 2020
A waterfall chart is an interesting way to present quantitative data visually. Using color-coded bars, it shows how an initial value is affected by subsequent positive or negative data values. These kinds of charts are also known as bridge charts (showing a connection between following bar graphs) or Mario charts (due to the middle bars being suspended mid-air). If you are giving a report and need to present cumulative data, this is a great way to help people understand it intuitively.

You can make such a chart in Microsoft Excel. To save you even more time, you can look for a free Chart Template you can download and modify. Don’t let the beginning complexity stop you from using this great method. Check out this collection of Excel waterfall charts to help you get started.
 gonnerman.com
 strategizefm.com
 sccs.swarthmore.edu
 bella-consults.com
 kbearle.com
 excelhelphq.com
 plumsolutions.com.au
A waterfall chart is a form of effective quantitative visual presentation. It will show a sequence of values in the form of colored bar graphs and is commonly used to demonstrate and analyze the rise and fall of an initial value given certain happenings—e.g., as a visual for a business’s profit and loss statement.
(In that respect, it is somewhat similar to a Flow Chart Template showing a sequence of changes from the initial value and how it goes from original revenue, to profit, to loss, to end up with your net profit at the end.)
The bars will be color coded to represent different types or states of value. A basic waterfall chart will have at most four colors for each type of bar in the graph:
The easiest way to utilize a waterfall chart is to use a pre-made chart. You’ll notice that each Excel Chart Template looks very different. This is to give you more options until you find a format that works for you personally and professionally.
Whatever form it takes, a waterfall chart should have these elements:
Each Waterfall Chart Template has been laid out with example data and headers already in them. The Excel coding might be tricky for beginners, and there are tutorials on the Web to show you how to make such a chart from scratch.
Download these free charts to save you the extra effort. It is not difficult to pick up from there, once you understand what a waterfall chart is meant to do.
Before you start, make sure you have a data table prepared for the values you will need to input.

A flowchart of the recruitment and selection process, also known as recruitment workflow, is a design that outlines out the…
Logistics management is a tough job, as you are to handle a vast network of processes. Plus, the system incorporates…

All businesses require great management, so all operations run smoothly and easily, and management applies to logistics as well. Maybe…
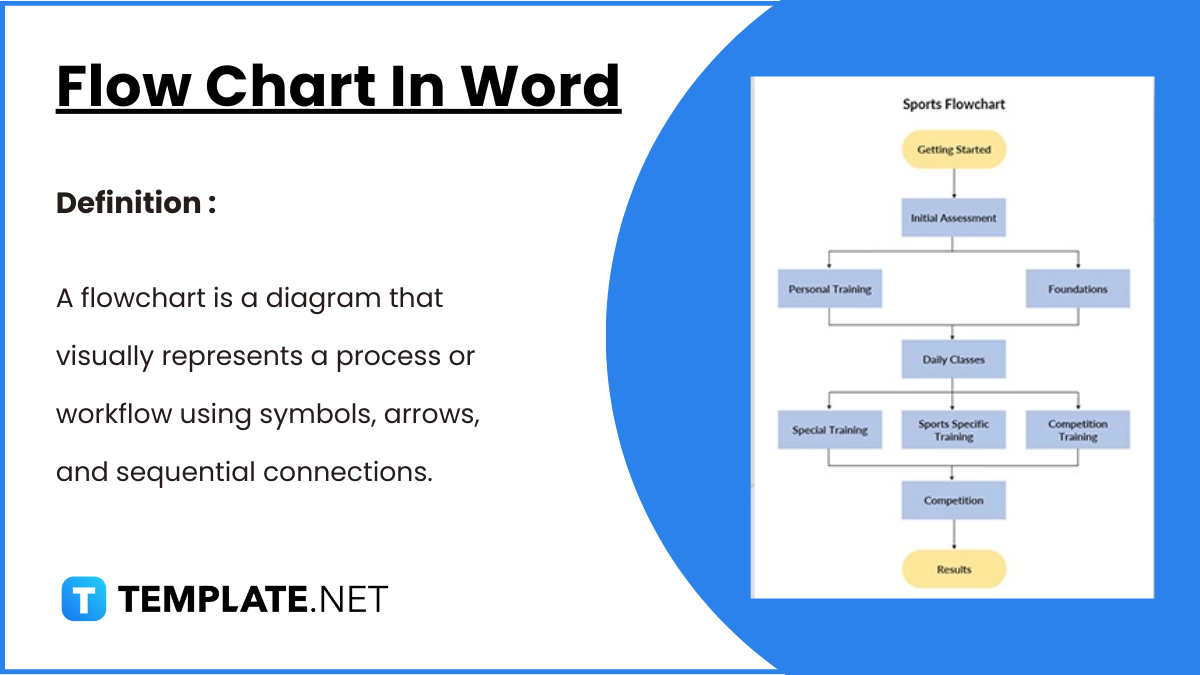
Flowcharts in Word offer a convenient way to visually represent processes, workflows, and systems. With easy-to-use shapes and connectors, Word…
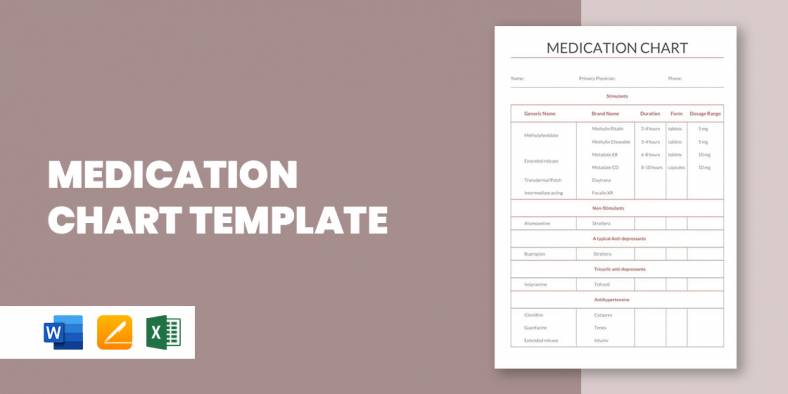
A medication chart template is really handy when you have to keep track of the number of medications prescribed for…

If you have ever had to prepare a flow chart, you’d thoroughly understand that it could be a back breaking…
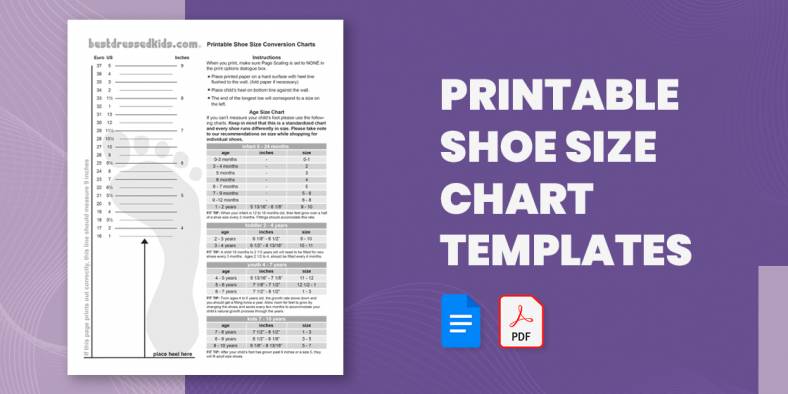
Going shoe shopping soon? Here is a Chart Template to help you avoid the annoyance and embarrassment of getting the…

If you plan to show the basics of guitar playing or just want to show how to play a song…

One of the important parameters of the body that needs to constantly be checked and measured is the blood pressure.…