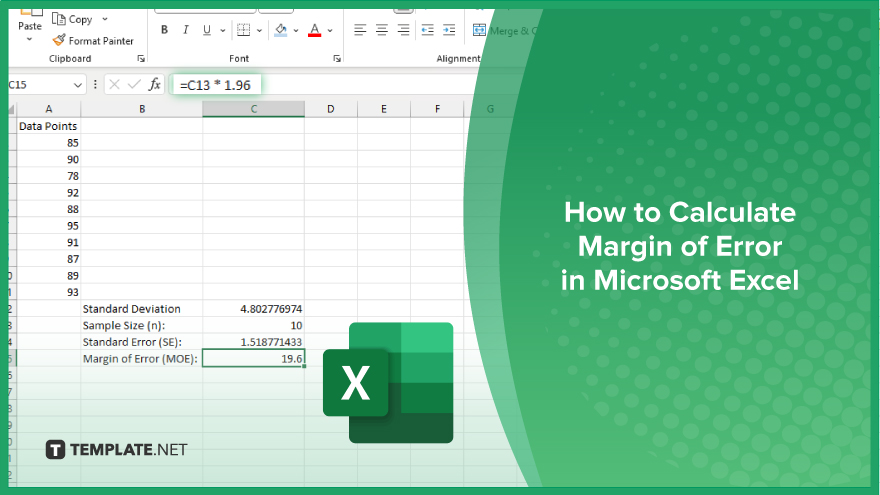
How to Calculate Margin of Error in Microsoft Excel
Microsoft Excel simplifies the process of calculating the margin of error, enabling you to measure the accuracy of your statistical…
May 01, 2024
It is no longer essential to rely on the manual making of the chart in Microsoft Excel as most individuals do. With the help of ready-made Excel chart templates, making premium charts is an easy process, saving you precious time and energy. You can find XLS samples you can incorporate into dashboards, speedometers, wedding seating, medication, pitching, stocks, and much more. They help you focus on your data and take away the worries of formatting the chart following your needs. And there are various types of excel charts out there, like pyramid charts, 3D charts, pink charts, stylish charts, charts of accounts, and comparison charts.
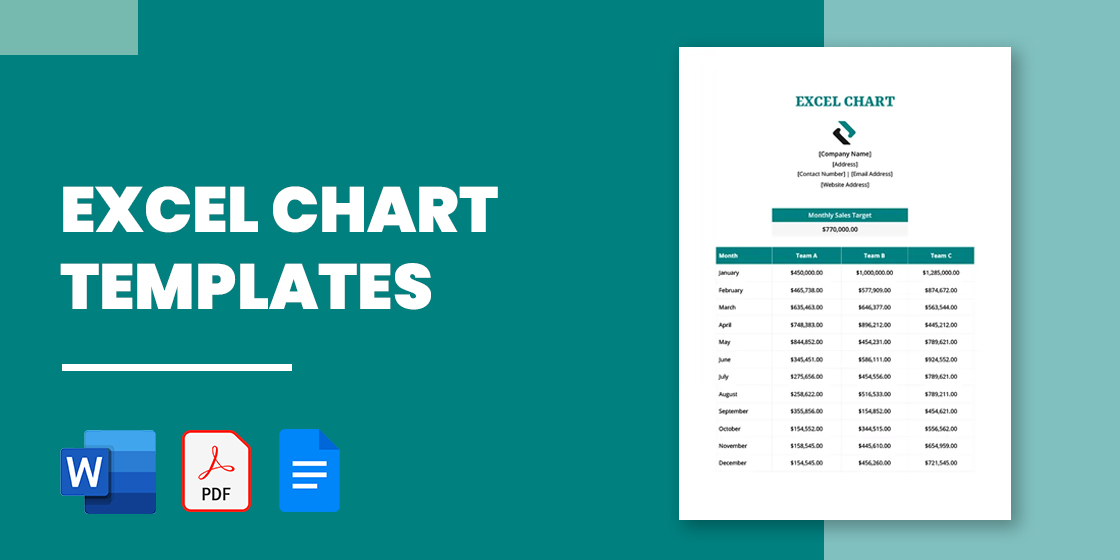
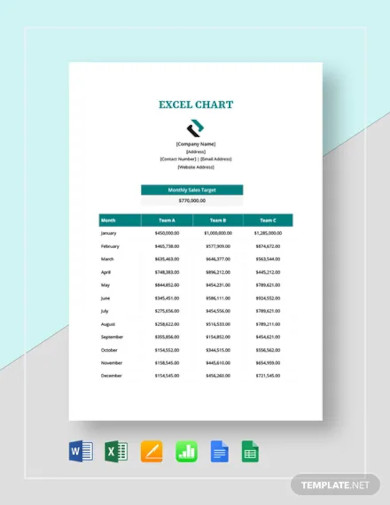
By following a series of simple steps and with a few clicks, your dream simple chart will be at your behest for use. And as the saying goes that all good things in life come for free, our excel gantt chart templates are also absolutely free for the users to avail. The best thing about these templates they are very easily downloaded and you can learn how to create a chart that makes your charting skills like never before with negligible efforts.
Check out this Excel color printable chart template that you can download for free. It allows you to effectively display the details of researched data in a graphical form. You can also allow the audience to make comparisons and see the meaning behind the trends of the numbers in an easy manner. Download it now and start customizing it right away!
Illustrate your project schedule in a visually appealing manner by making use of our ready-made “Excel Gantt Chart in PDF. This bar chart format is available to download for free and is easy to edit as well as customize. By opening it in either MS Excel format, MS Word format, Mac Number, or Mac Pages format, you may change the texts and content.
Do not miss out on this basic Gantt chart template that will help you note down your activities during different hours of the day for each given week. It can be opened and customized in various file formats such as Google Sheets format, MS Excel, MS Word, Numbers format, and Pages. You can also see Cleaning Chart Templates.
Long Excel spreadsheets that are packed with figures tend to create a tedious sight. Thus, you have awesome Sample Excel charts that offer a visual representation of the facts and numbers- ensuring a better grasp of the information or report for the audience.
Feel free to download our ready-made sample Pages in Gantt chart template. This basic chart template will allow you to present your various tasks in a weekly manner. You can also use it to you arrange your tasks and deadlines in a rather convenient manner. Hurry up and download this customizable Gantt chart template now!
Here’s a printable and fully layered weekly data modern gantt chart template available for you to use. It helps you in breaking down and organizing your project details weekly so that you can complete your targets without any confusion. Once you make changes to the content of this simple template, you can get it printed or share it digitally as per your preference.
Do not worry about creating a monthly gantt chart from scratch because we already have a ready-made basic template here for you. Upon downloading this editable graph for school chart template, you will be able to optimize your tasks and complete your goals without any hassle. Try it out now!
The top utility of the excel charts can be seen in commerce settings and various small business enterprises and the formal templates score 100% in that sphere. The amount of work that you can get done with such templates is amazing. Free PPT Templates are like those instant delicious noodles served hot and fresh when you need to get started and get you going even before you say the word go.
If you are looking for ready-made blood pressure chart templates, then this template right here would be of great use to you. It comes complete with tables for systolic, diastolic, followed by a graph of blood pressure & heart rate. You can also take a look at our Chart in PSD.
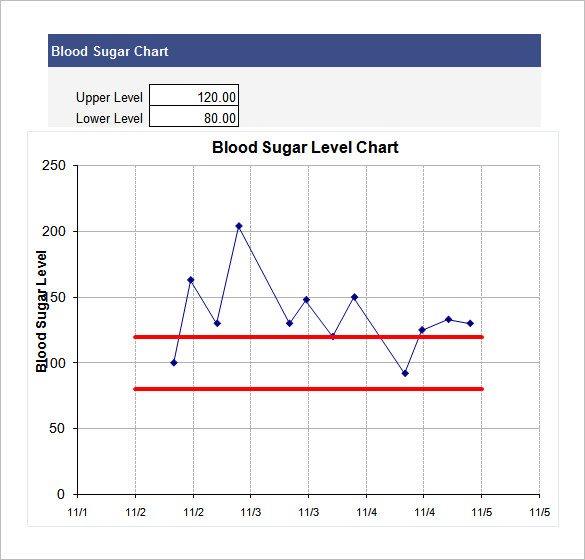
This blood sugar chart template here will allow you to track the sugar level in both the upper & lower level. You are getting a smart, neat & clean easily customizable template here. You may also see Seating Chart Templates.
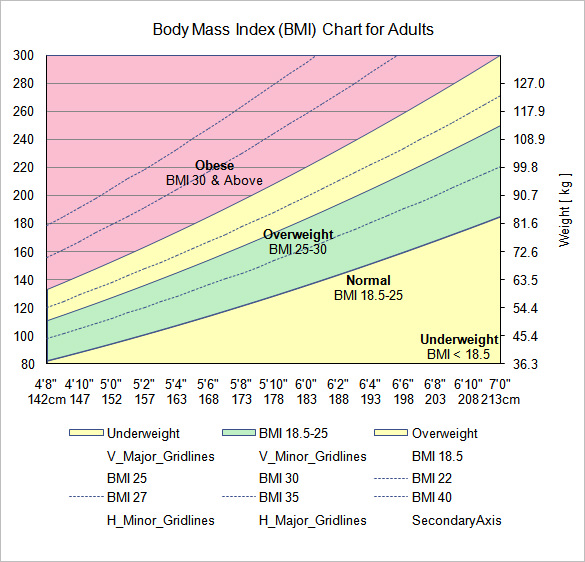
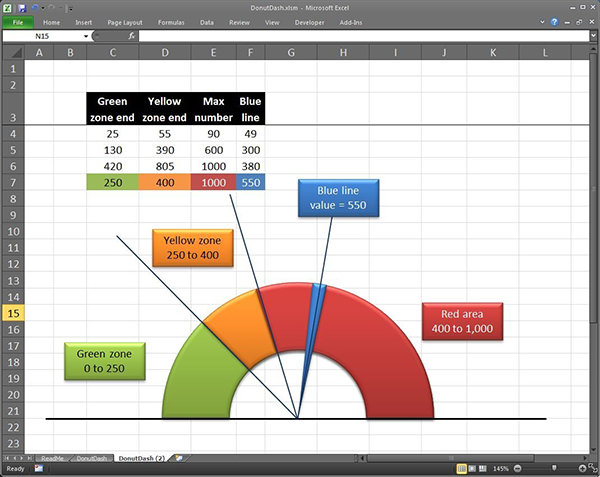
Donut Dash is a great way of bringing things into perspective when you want to show some numbers and the differences between them. This standard template will show various numbers with different colors on a semi-circle chart.
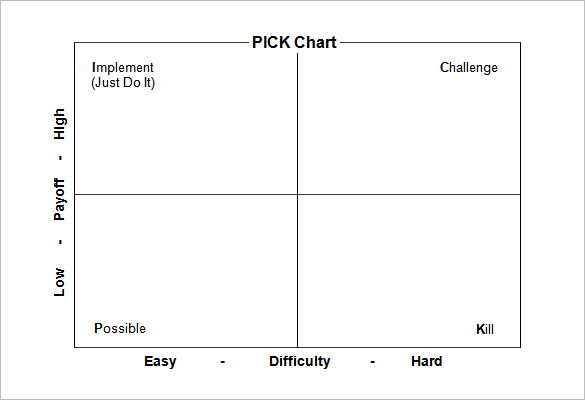
If you are looking for a smart office organizational chart sample excel, this Pick Chart here would be great for you with its well-defined boxes for Possible, Implement, Challenge & Kill. You also have levels of difficulty here.
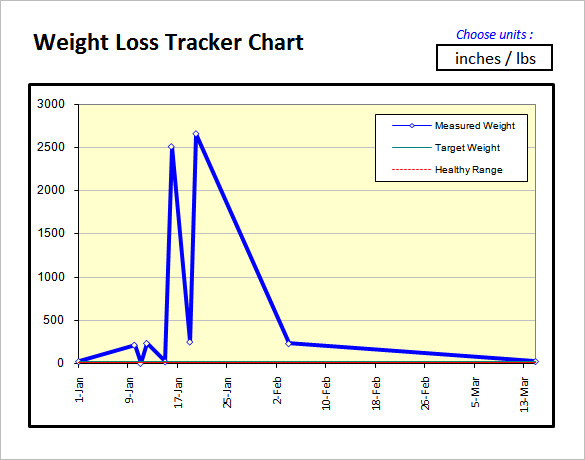
The above-shown “Weight Loss Tracker Chart” offers a great way of keeping a track of your weight. All you have to do is download this template and enter your weight periodically. This will show how much difference has there been on a chart so that it is much easier to comprehend.
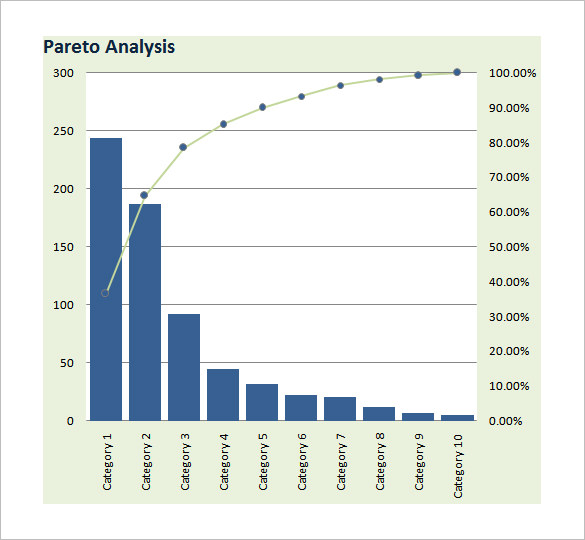
This is an effective Pareto analysis gantt chart here that will enable you to cultivate as many as 10 causes for a certain problem in your products or campaigns or business operations. You may also see Blank Chart Templates.
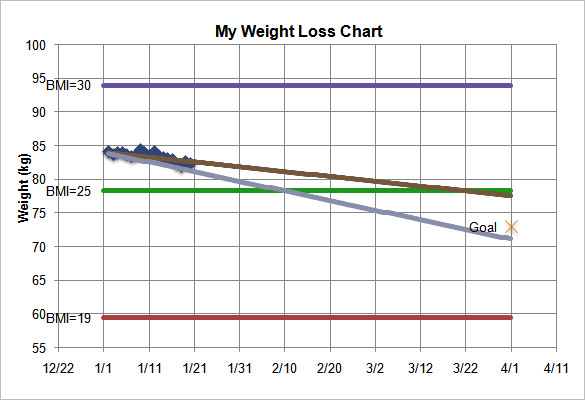
This free excel download weight loss chart will enable you to keep track of your weight loss goal after every 10 days. You will be able to enter data for up to 3.5 months. You may also see Chore Chart Templates.
Excel sheets are meant to talk about numbers and figures. But prolonged spreadsheets with a huge volume of data might be a tad perplexing for the audience. It’s not impossible to miss out on certain sections of the data in the crowd of so many numbers. Thus, you have the pretty excel Growth Chart template that offers a visual picture of the entire data so that it’s quicker to fathom. Moreover, visual representation also eliminates the risk of data getting overlooked.
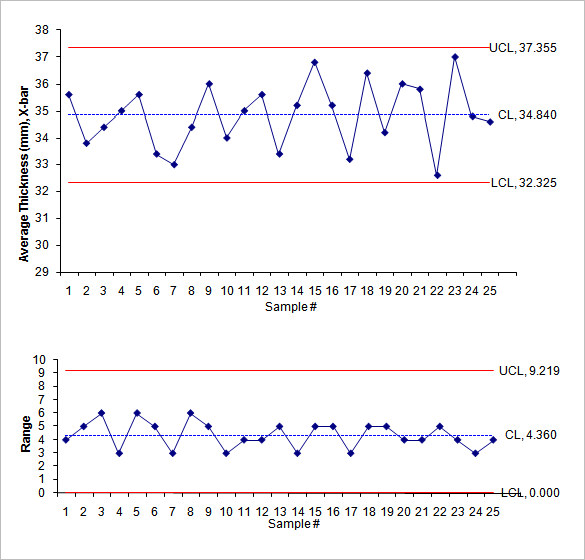
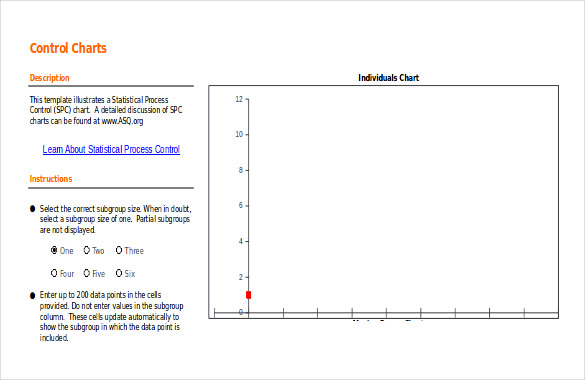
Check out this readymade and customizable control run chart template that will help you check the mean and range here. It is neatly divided into two sections—one for average thickness and another for range. You may also see Team Organizational Chart Templates.
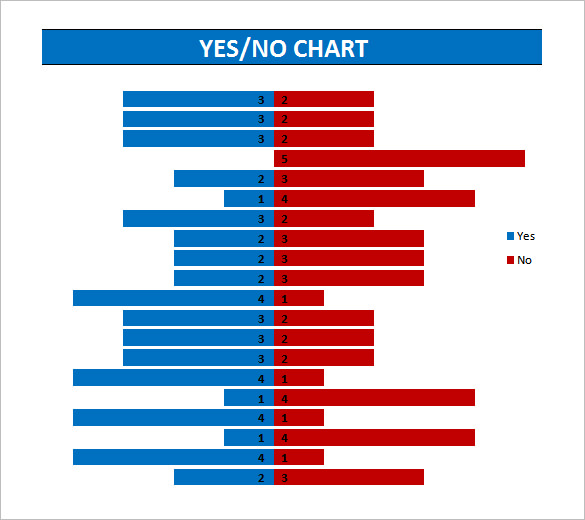
This simple excel chart template right here can be used to display how many people have voted for “Yes” and how many have voted for “No”. The chart is easily editable with your data. You may also see Research Flow Chart Templates.
If you are looking for an Excel chart format that consists of graphical illustrations, then this is the chart for you. The chart will allow you to offer data on 4 aspects, depicted by different shades. You may also see Process Flow Chart Templates.
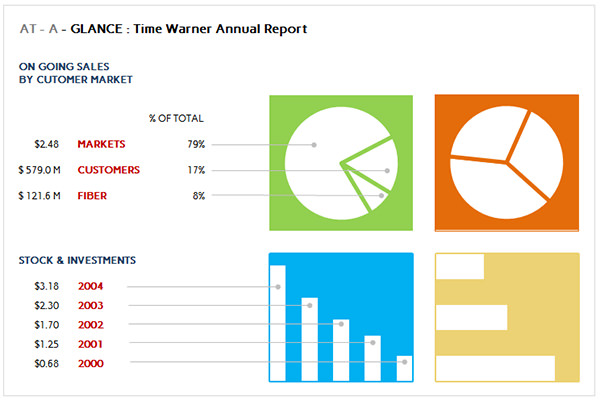
If you need some general template to present your study or analysis on a graphical layout with superior effects, PowerCharts is your best bet. It can represent your numbers with various kinds of charts – pie, column, bar, etc. You may also see Design Gantt Chart Templates.
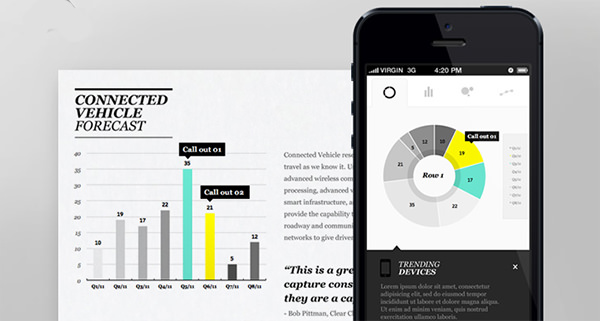
The Global Excel Chart is surely an attractive excel chart layout template that comes with a beautiful representation of numbers, it sure can explain more than mere numbers. With an elegant and minimal design, it is bound to attract attention. You may also see Pages Gantt Chart Templates.
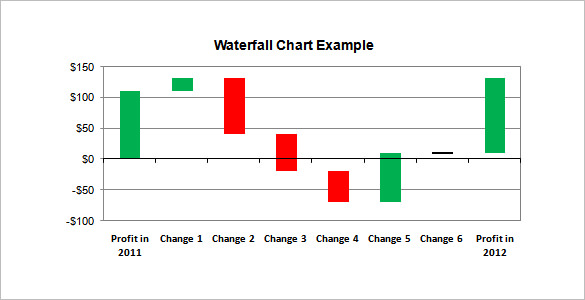
This Excel waterfall chart will help you to spot the difference in profits between two years. You can talk about 6 changes included in between the year to see what cumulative effect have they brought together. you may also see Flow Chart Templates.
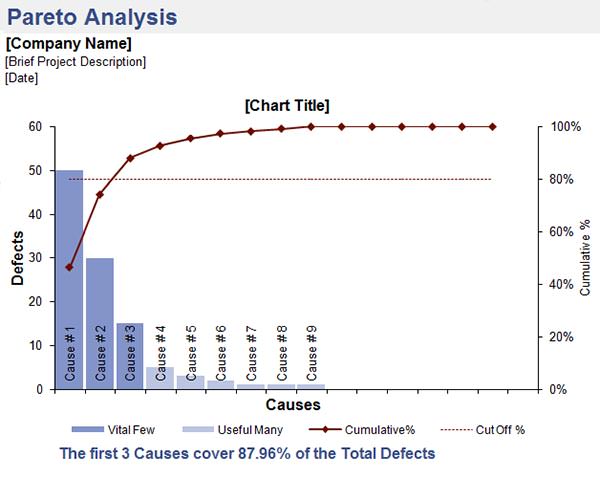
This Pareto chart here will help you to estimate the causes of defects of a certain problem in your company. You will get to analyze here as many as 9 causes.
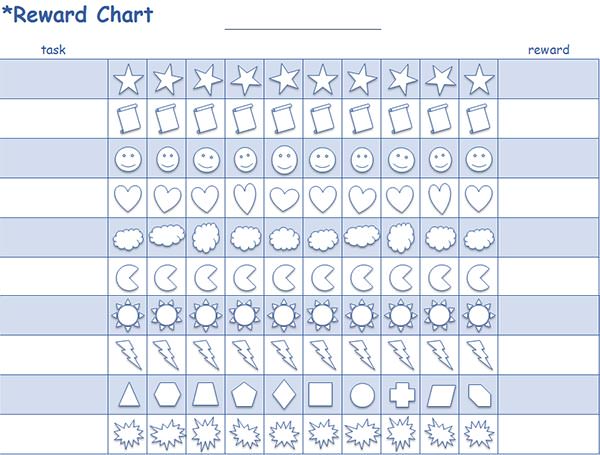
This is a real cute reward work flow chart you are getting here which can be used to reward little students in your school or the tiny ones at your home when they readily complete the tasks assigned to them. They are sure to love the adorable icons like hearts, smileys, or suns.
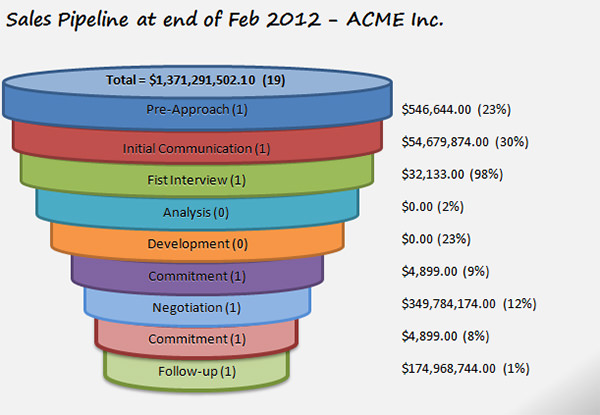
This Sales Organizational Chart excel template will help you to analyze the budget allotted for each stage of the sales campaign such as pre-approach, initial communication, negotiation, etc. with the total budget written at the top.
Excel charts can be many and varied. Here is a brief on the most important types of Excel charts.
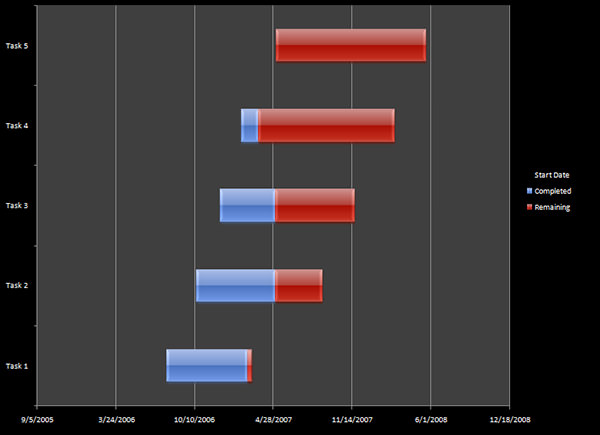
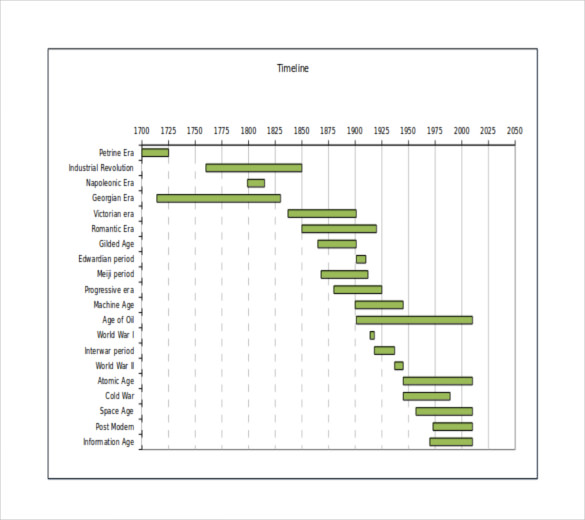
This Excel Gantt chart template will help you to estimate the progression status of as many as 5 tasks for almost 2 years. You have separate colors for the start date and end date. You may also see Development Gantt Chart Templates.
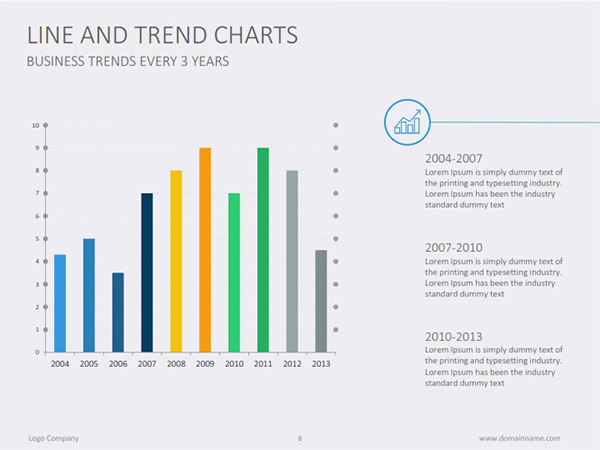
This chart will be helpful to gauge the business trend every year with a bar graph for 10 years. Besides, in the bar graph, you can include textual briefs on the changes observed at a slot of 2-3 years. You may also see Timeline Chart Templates.
 public.iastate.edu
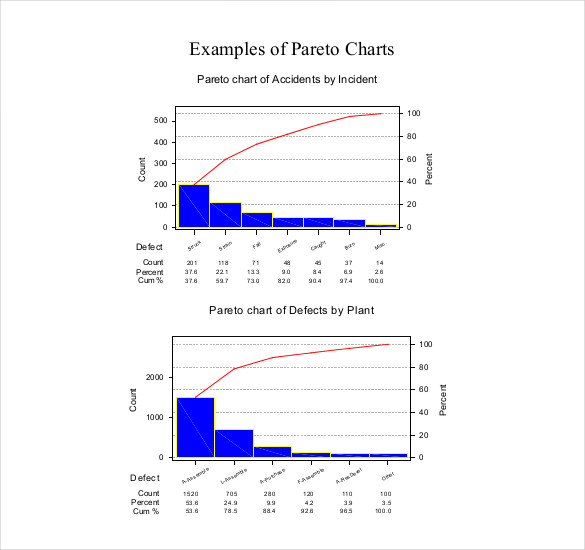
You are getting two Pareto charts here to discuss two problems happening in your company and an evaluation of the different causes affecting them. You can include up to 7 causes here. You may also see School Organizational Chart Templates.
 sccs.swarthmore.edu
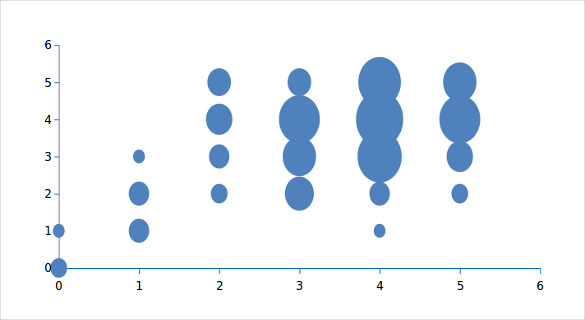
 If you need help with creating bubble charts, this Excel bubble chart template that is shown above would be handy for you with its readymade design. The chart is easily customizable with your data.
 contextures.com
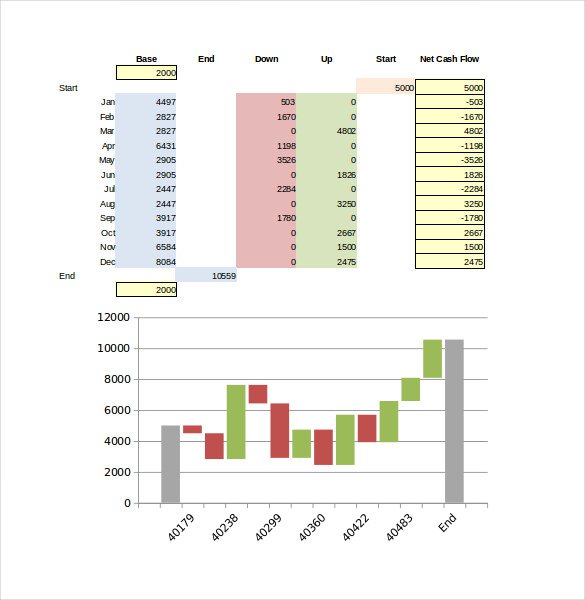
The Excel waterfall chart template here will help you to analyze a certain outcome that is perceived throughout the year, from January to December. The chart is preceded by figures briefed in tables. Feel free to also take a look at our Process Flow Chart in PDF.
 freeexcelcharts.com
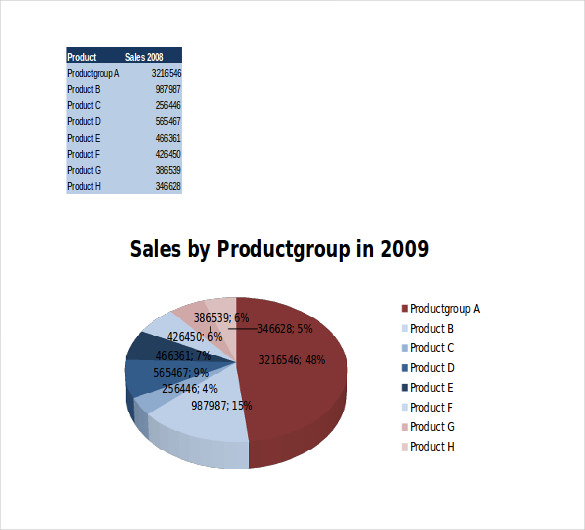
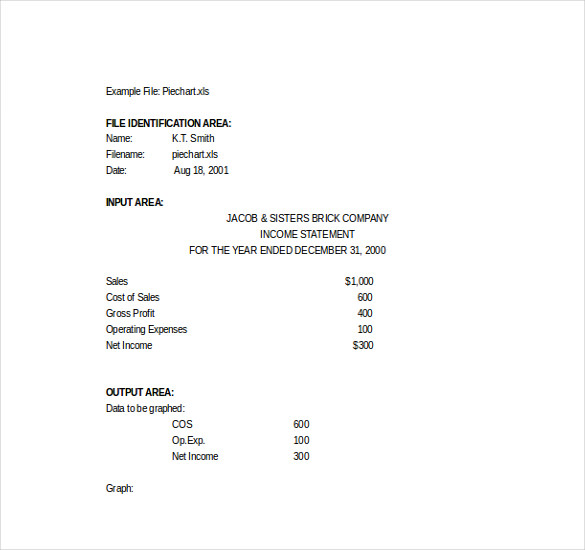
If you need help in creating pie charts to analyze your products, this readymade pie chart here would be grand for you and it will allow you to study about 8 products. You may also see IT Organization Chart Templates.
 sccs.swarthmore.edu
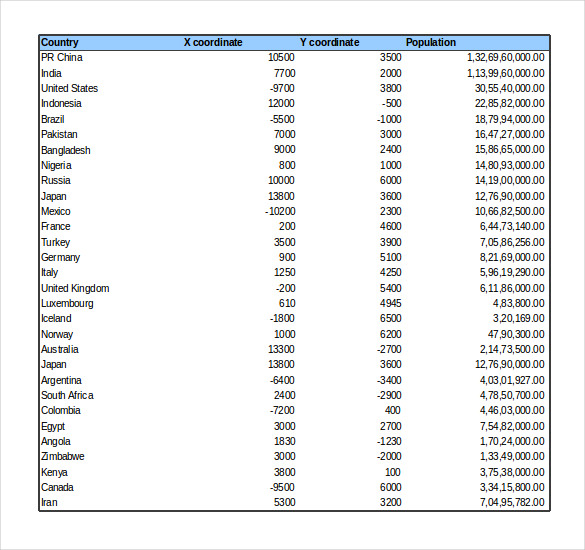
This bubble chart creative template here comes with three dimensions of data comparison between countries. You may include data to as many as 30 countries. It’s a simple and neatly organized chart.
 asq.org
 faculty.fuqua.duke.edu
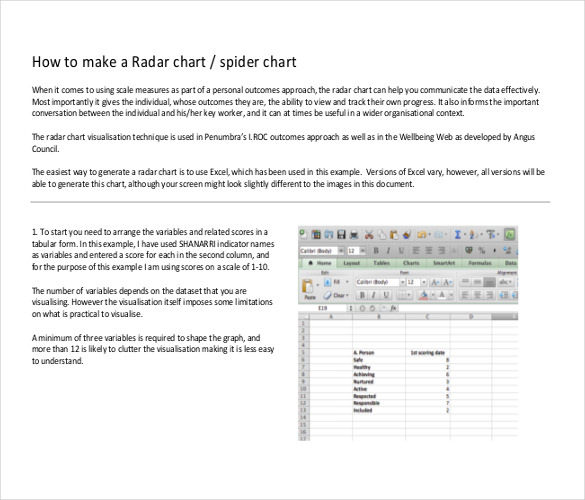 lx.iriss.org.uk
 wps.prenhall.com
 csun.edu
 lacher.com
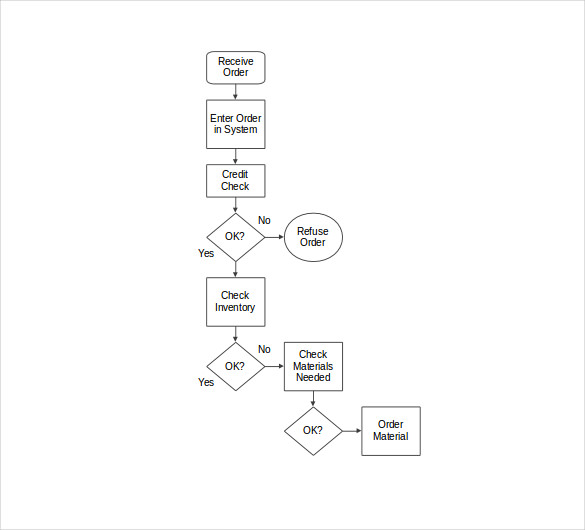 asq.org
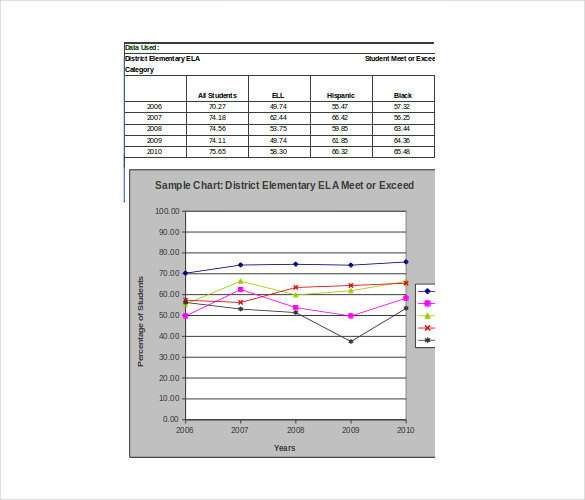 do.parkrose.k12.or.us
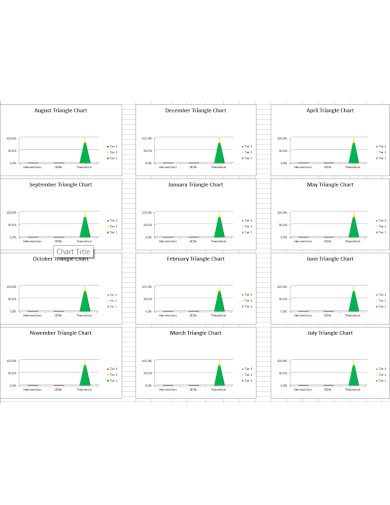 jackson.ms.us
 Our excel gantt chart design templates offer you ready-made customizable Excel charts so that you do not have to sample outline the entire thing from scratch.
If you need help in spotting the best Microsoft graph template PPT charts, we are here to help with our pre-styled and expert-designed Excel chart templates at template.net.
A chart is a diagram that allows you to visually present data in a variety of chart formats such as Bar, Column, Pie, and so on. Using Excel format, anyone can create a chart to communicate data graphically.
In Excel, charts help viewers or audiences to see the meaning behind the numbers in a visually summarized form in Excel. They aid in showing comparisons and trends in the easiest way possible.
Following are some of the different types of charts that are available in MS Excel:
Here are the benefits of using charts in Excel:
A Chart Comparison is a visual depiction of data that is intended to make information easier to understand. A graph is a diagram that shows the mathematical relationship between different sets of data.

Microsoft Excel simplifies the process of calculating the margin of error, enabling you to measure the accuracy of your statistical…
Microsoft Excel users often need to format data within a single cell, and one common requirement is to indent text…
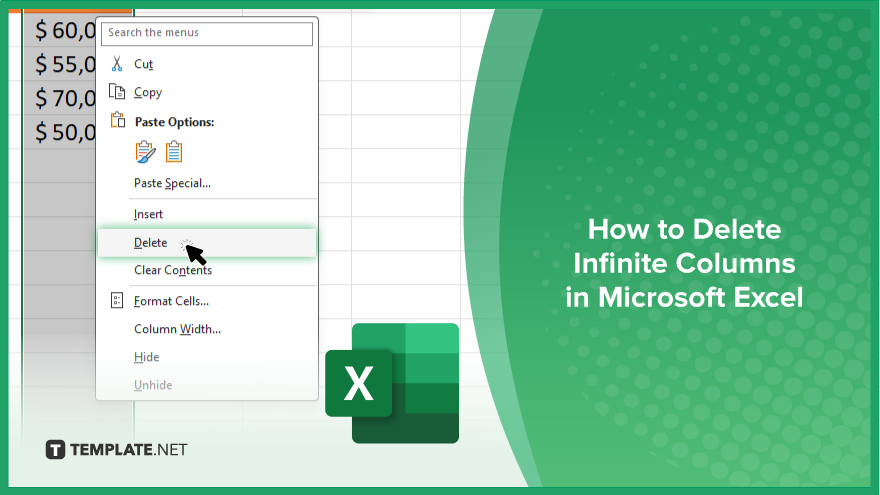
In Microsoft Excel, dealing with infinite columns can be a headache, cluttering your workspace and slowing your workflow.…
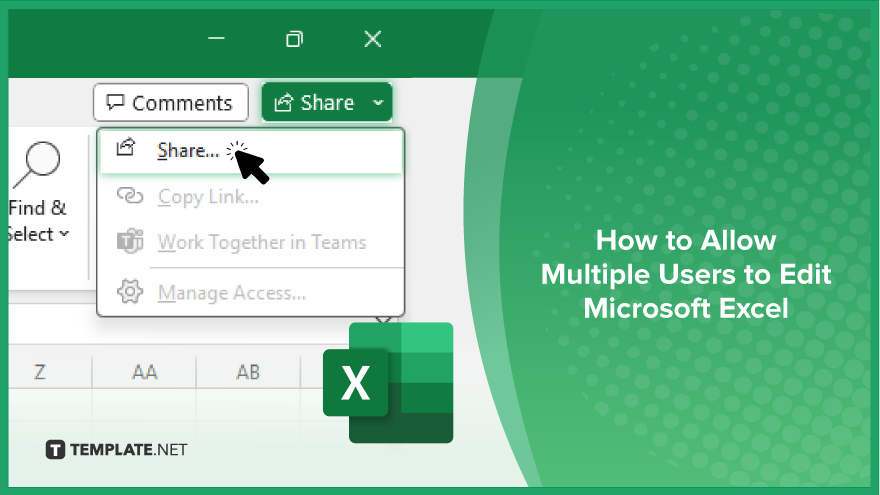
Microsoft Excel revolutionizes teamwork by allowing multiple users to edit spreadsheets simultaneously. This collaborative feature streamlines workflow and boosts productivity…
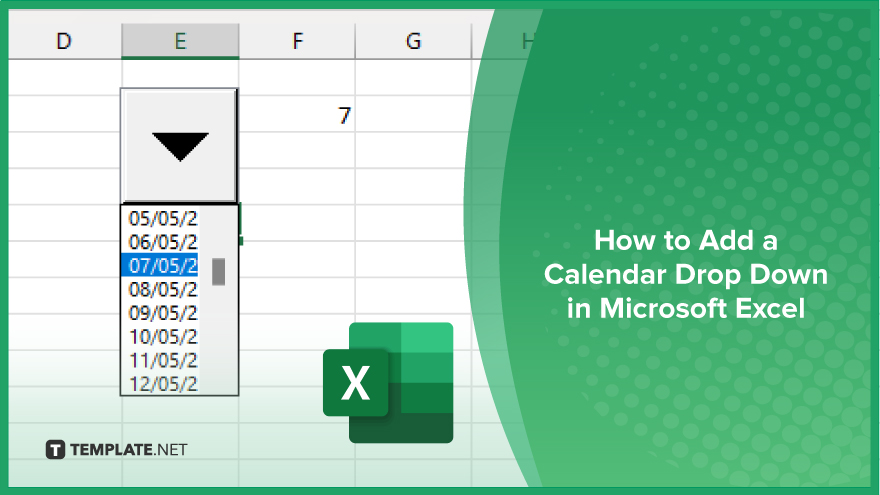
In Microsoft Excel, simplifying data entry just got easier with calendar drop-downs. Learn how to integrate this feature into…
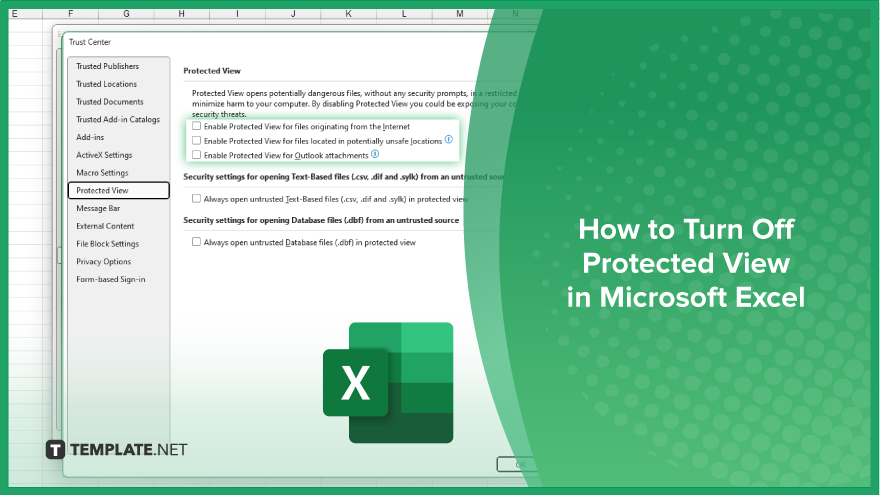
Microsoft Excel users, have you ever encountered the frustration of being unable to edit or interact with a…
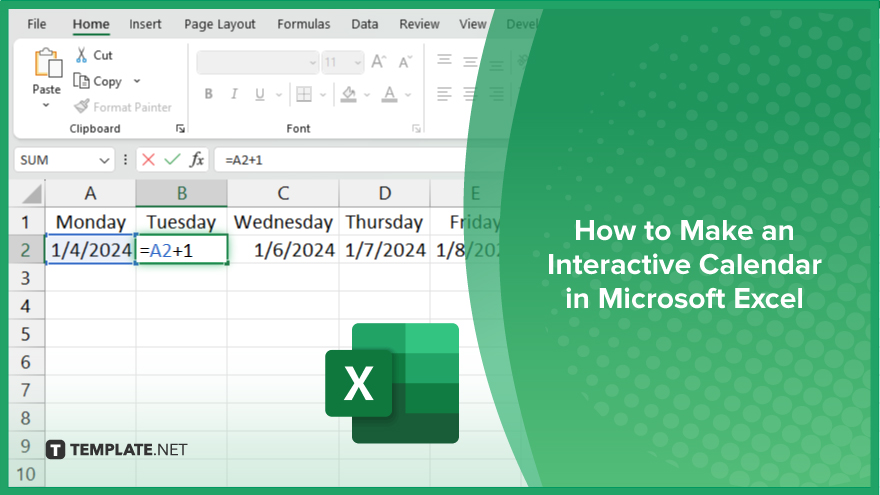
Microsoft Excel is not just for crunching numbers—it can also be transformed into a powerful planning tool by integrating interactive…
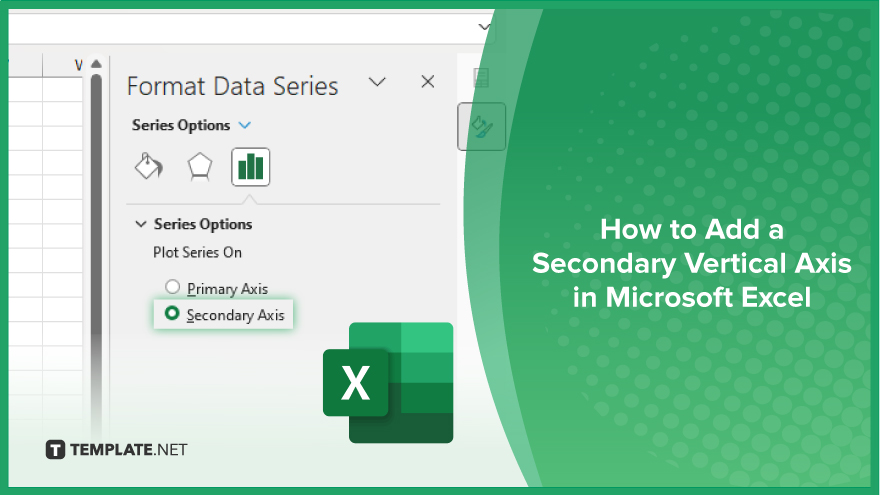
Microsoft Excel users, are you struggling to effectively visualize your data? In this article, we’ll show you how…
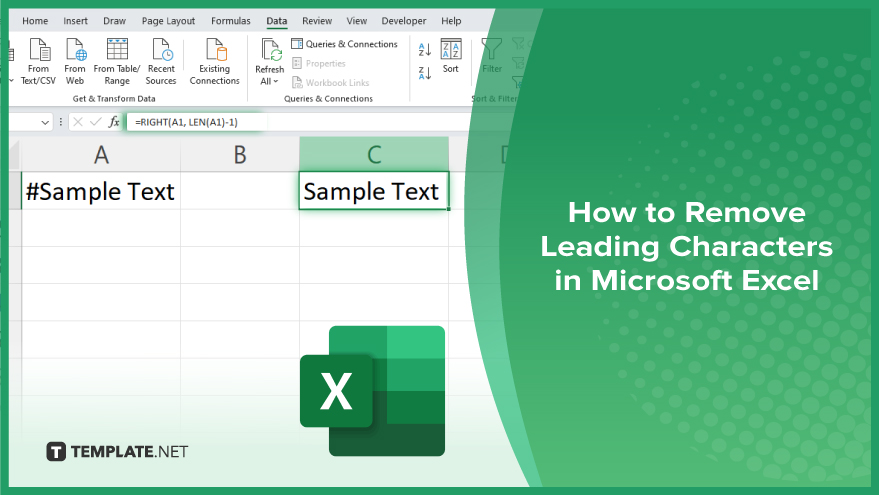
Microsoft Excel provides versatile tools to refine your data, including removing leading characters from cell values. This skill is crucial…