
How to Calculate Margin of Error in Microsoft Excel
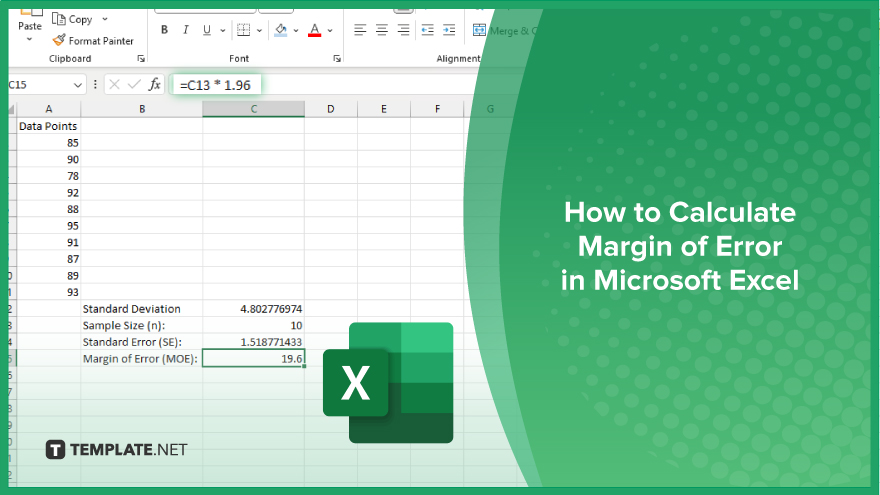
Microsoft Excel simplifies the process of calculating the margin of error, enabling you to measure the accuracy of your statistical…
Jun 11, 2024


Jan 13, 2025
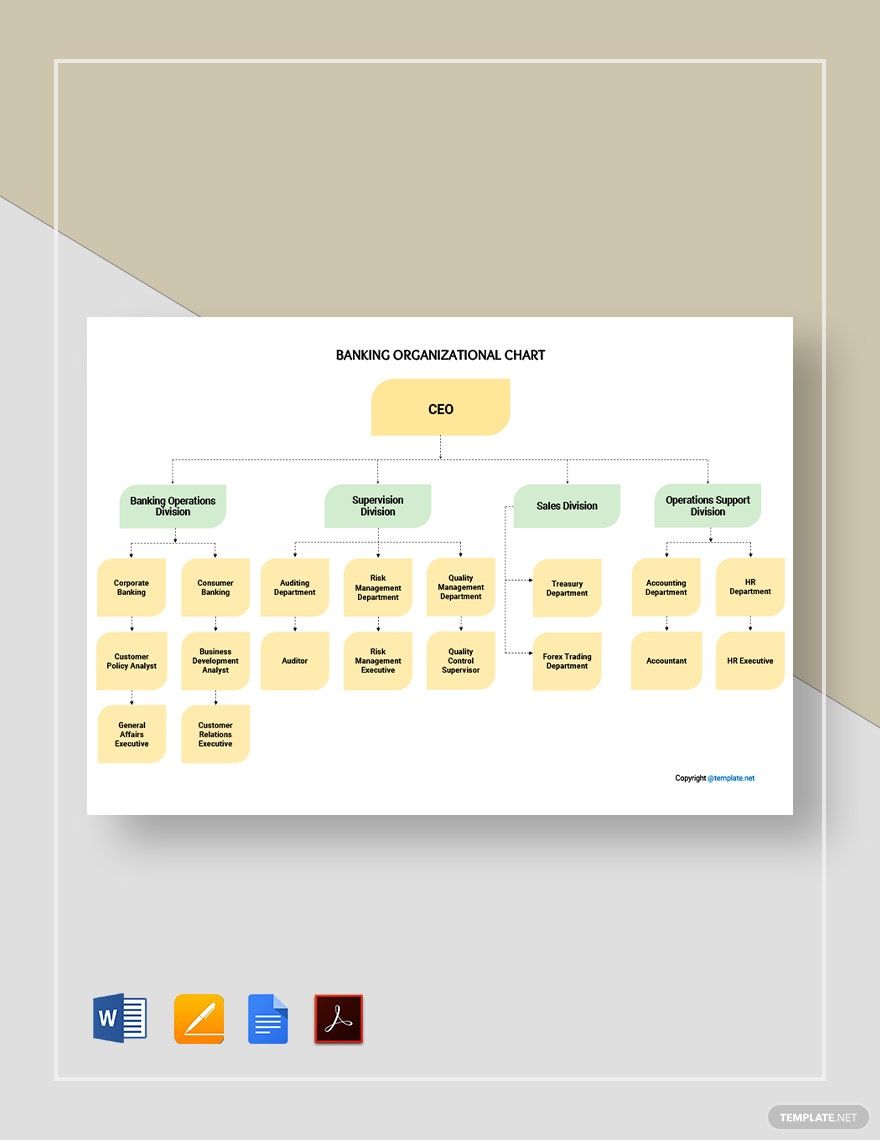
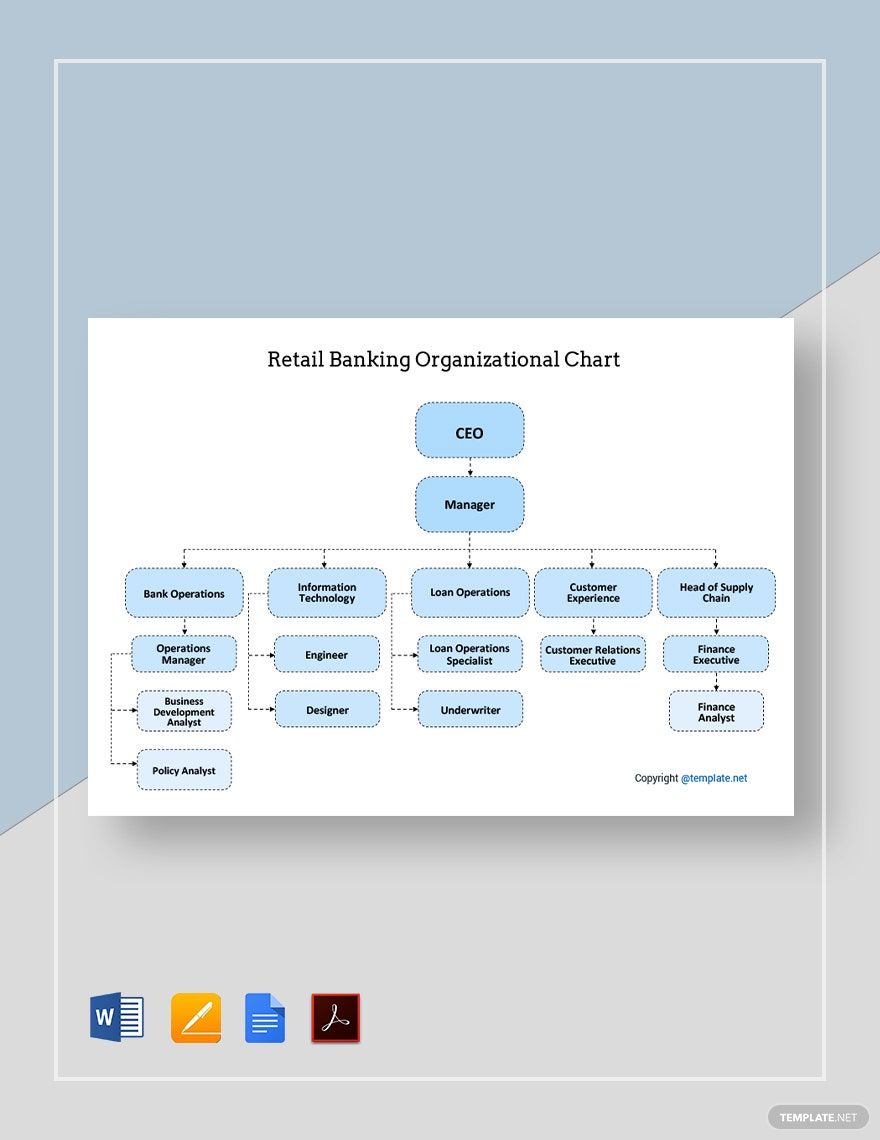
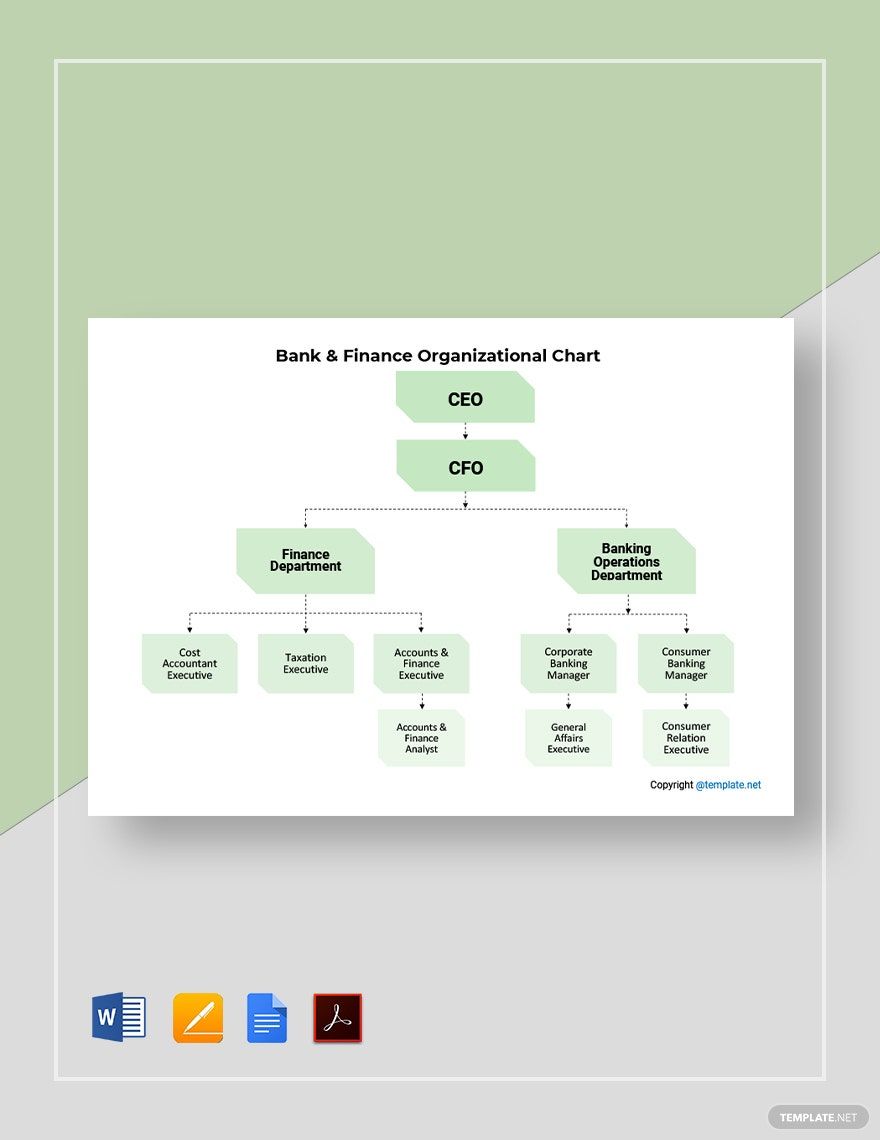
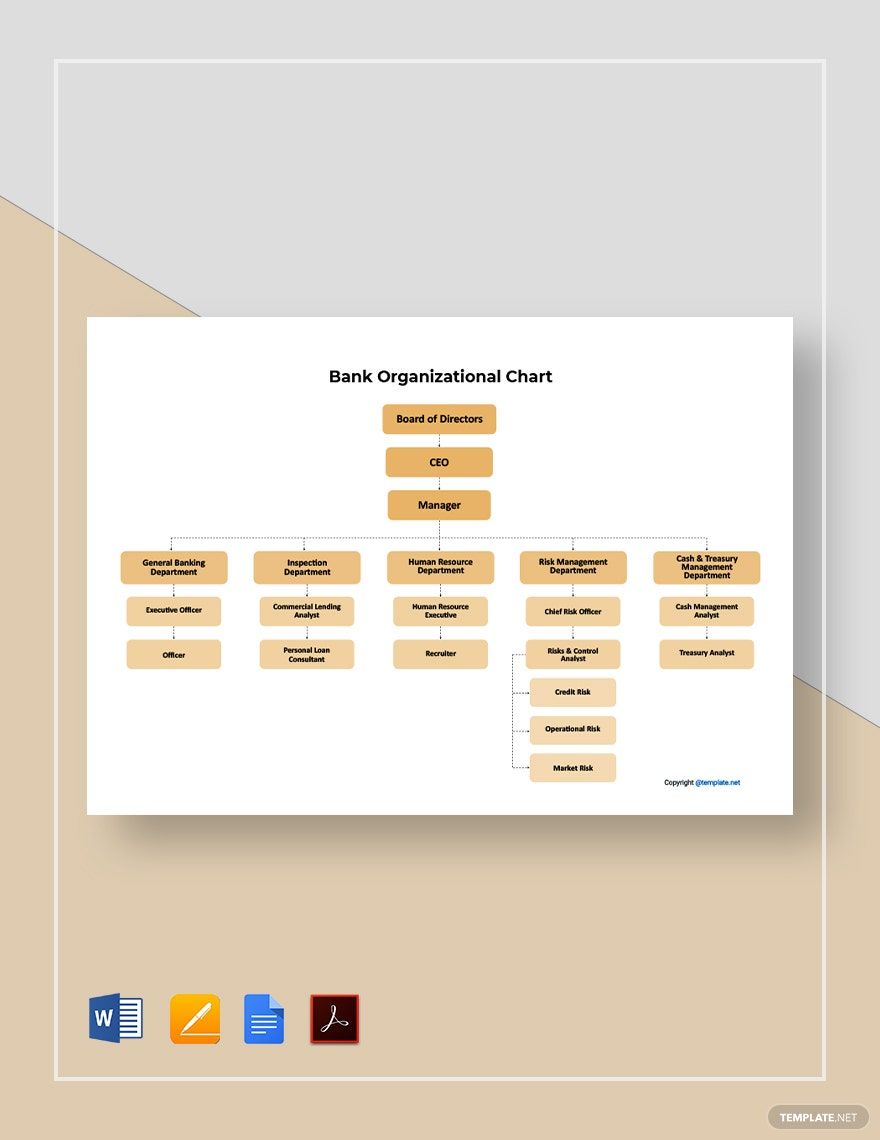
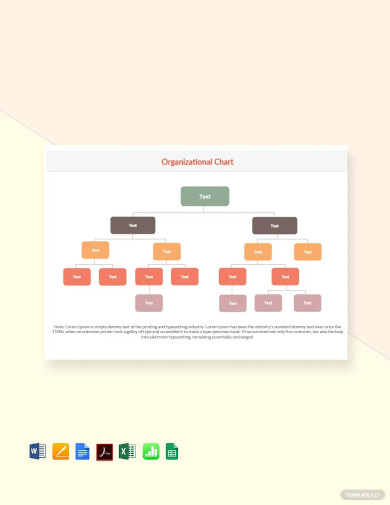
An Excel organizational chart is a visual representation of a company’s structure, illustrating the relationships and hierarchy among employees, teams, or departments. Created using Excel’s built-in tools or add-ins, these charts are a powerful way to display roles, responsibilities, and reporting lines in an easy-to-understand format. With its flexibility and customization options, Excel allows users to design organizational charts tailored to their needs, whether for small businesses, large corporations, or project teams. These charts simplify communication, enhance transparency, and provide a clear overview of organizational dynamics, making them invaluable for planning, reporting, and onboarding processes.


This organizational excel flowchart template provides two easy to use toolbars to help in making flowcharts. The template also includes one reference example of a flowchart showing all elements.

This simple template gives an easy to modify and re-use complete organizational chart example. It covers everyone right from the CEO until the last person in the hierarchy of the organization.

This template has readymade samples for several types of organization charts. The most striking are the three sample templates for organization charts for schools.
An organizational chart in google docs is a visual representation of an organization. It brings clarity both internally and externally. As organizations are becoming more complex, the drawing of an organizational chart is becoming more tedious. There are several ways to go about it, ranging from making power points to drawing it with specially purchased software.
Every method has its advantages and disadvantages. The easiest to use method among all these is to use excel organizational blood pressure chart templates. These templates are available for different types of organizations; therefore it is just a matter of finding the right template that suits your organization.

This sample template is very simple looking. It doesn’t have colors and too many types of boxes or connectors or other shapes. This makes it extremely easy and fast to use.

As a reference, this template offers a complete organizational chart of a child care or early education provider organization. The user can easily plug-in his details to get his organizational chart in pdf.

Excel offers a versatile and user-friendly platform for creating and managing organizational charts. Here are the key benefits of using Excel for this purpose:

Creating an organizational chart in Excel is simple and effective, whether for a small team or a large organization. Follow these steps to design a professional and clear organizational chart:
To create an organizational chart in Excel, use the “SmartArt” feature. Navigate to the Insert tab, select SmartArt, and choose a layout from the Hierarchy category. Enter your organizational structure details into the chart by replacing the placeholder text.
Yes, Excel allows extensive customization of organizational charts. You can change colors, fonts, layouts, and shapes using the SmartArt Tools ribbon. Additionally, you can add or remove boxes, resize elements, and apply effects to suit your design needs.
Using Excel for organizational charts offers flexibility, ease of use, and integration with other data. Excel provides pre-designed templates, allows for quick edits, and enables linking the chart to data, making it ideal for both simple and complex organizational structures.
Yes, you can import data into Excel to create an organizational chart, though it may require some manual adjustments. Tools like Power Query or add-ins can help connect and visualize external data sources, making it easier to generate and update charts.
Excel’s organizational chart functionality may be limited for very large or dynamic organizations. It doesn’t offer advanced automation features like other specialized tools, and the manual customization of complex charts can be time-consuming.
Microsoft Excel simplifies the process of calculating the margin of error, enabling you to measure the accuracy of your statistical…
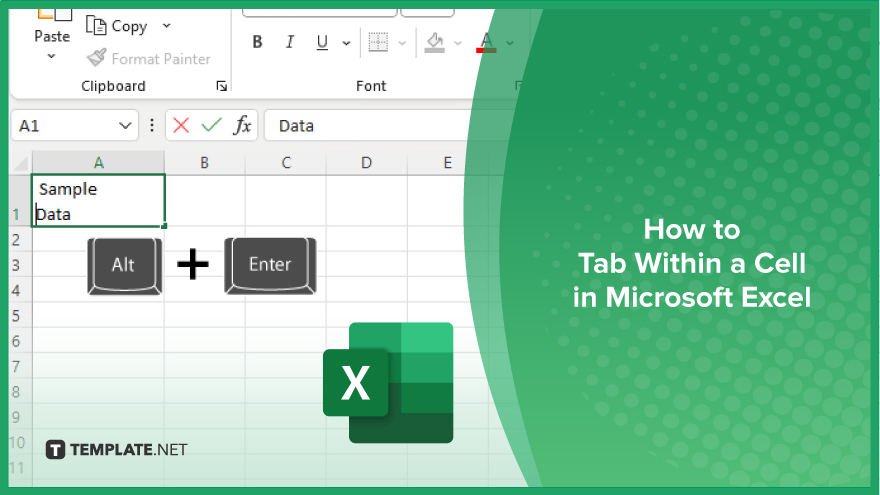
Microsoft Excel users often need to format data within a single cell, and one common requirement is to indent text…
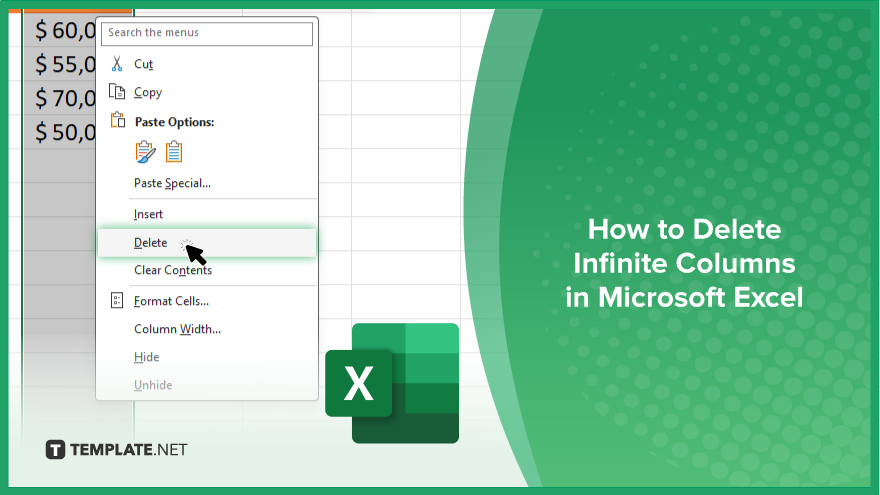
In Microsoft Excel, dealing with infinite columns can be a headache, cluttering your workspace and slowing your workflow.…
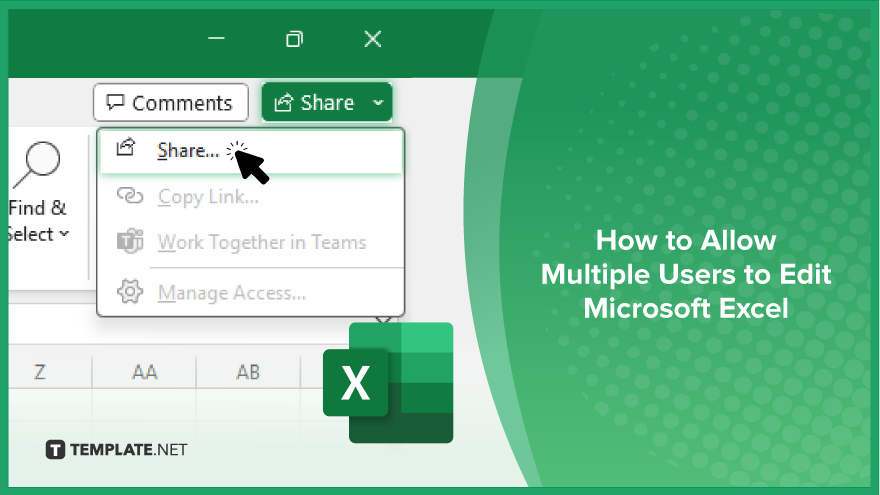
Microsoft Excel revolutionizes teamwork by allowing multiple users to edit spreadsheets simultaneously. This collaborative feature streamlines workflow and boosts productivity…
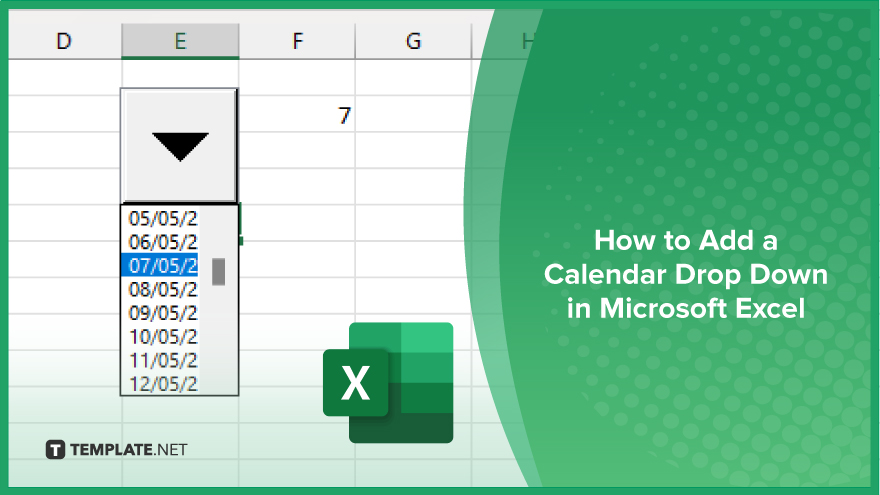
In Microsoft Excel, simplifying data entry just got easier with calendar drop-downs. Learn how to integrate this feature into…
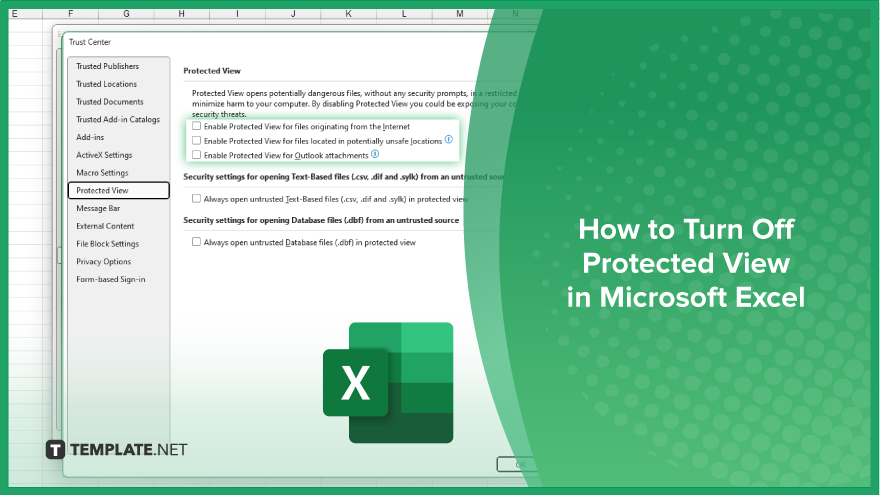
Microsoft Excel users, have you ever encountered the frustration of being unable to edit or interact with a…
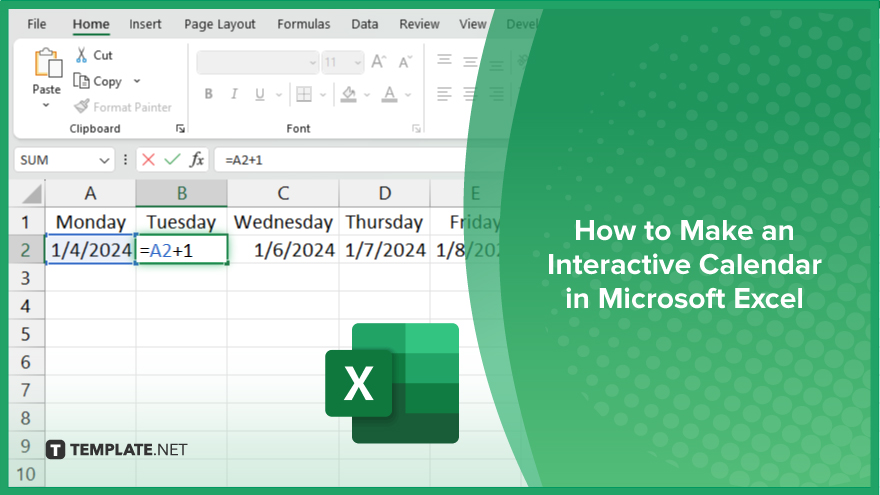
Microsoft Excel is not just for crunching numbers—it can also be transformed into a powerful planning tool by integrating interactive…
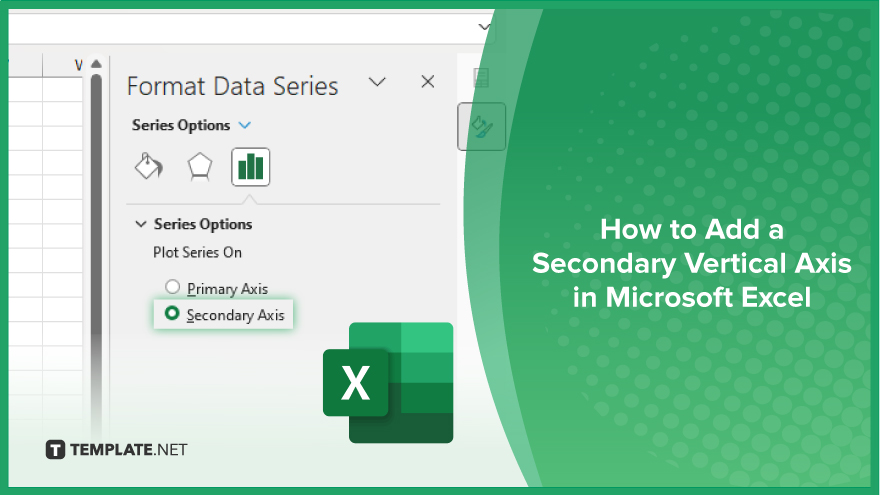
Microsoft Excel users, are you struggling to effectively visualize your data? In this article, we’ll show you how…
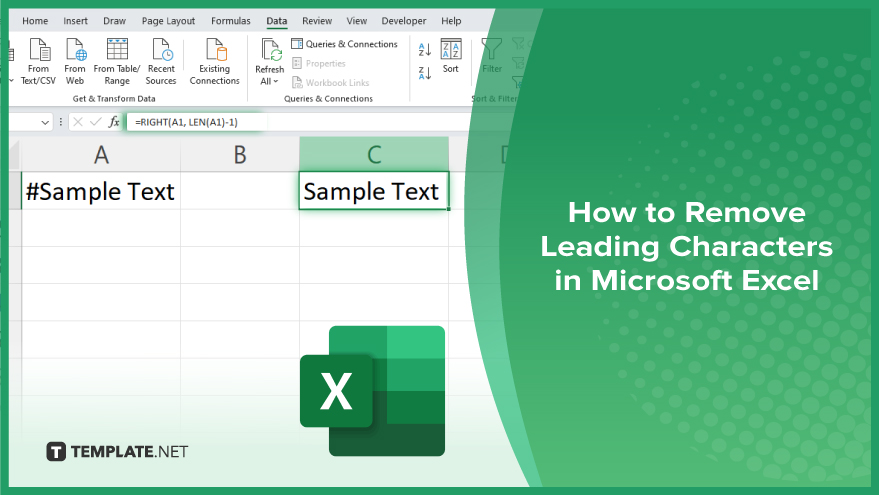
Microsoft Excel provides versatile tools to refine your data, including removing leading characters from cell values. This skill is crucial…