
Proposal Templates – 170+ Free Word, PDF, Format Download!
Are you a visionary or a pioneer who needs a grant? If so, you might want to survey all over…
Oct 17, 2025
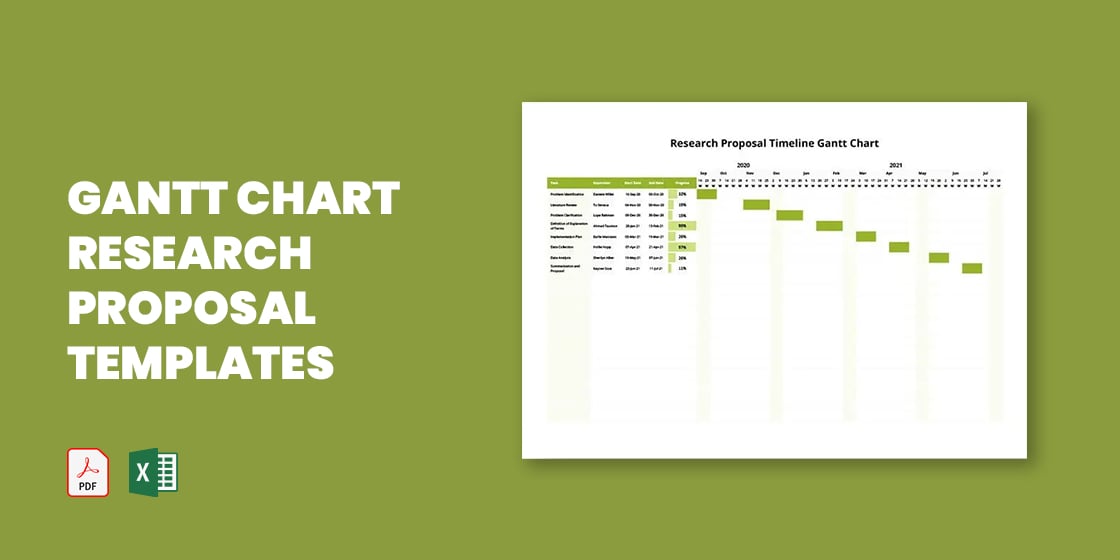
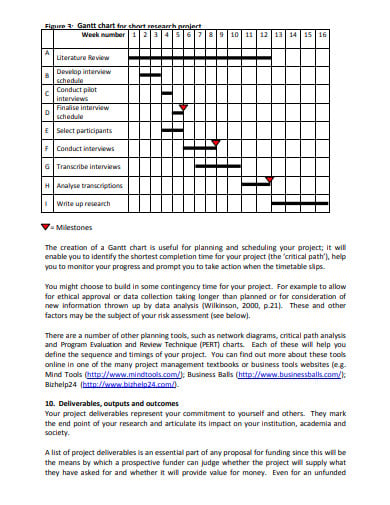
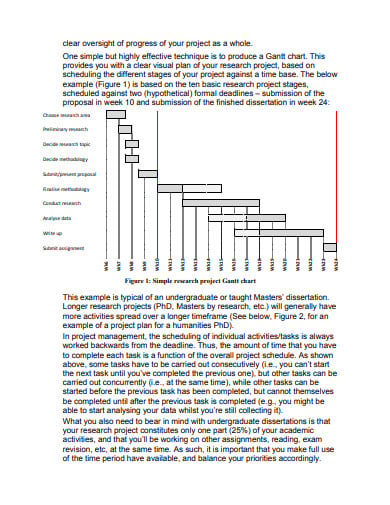
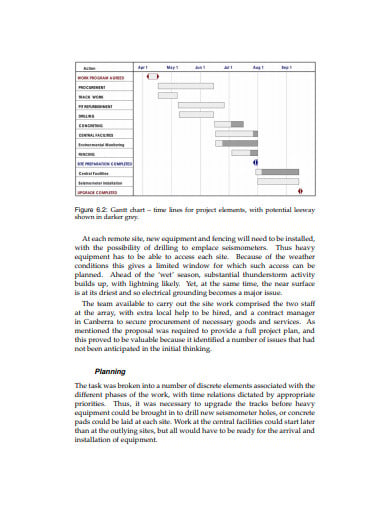
A Gantt chart is a form of bar chart illustrating a schedule of a project. It has been named after its inventor, Henry Gantt, who designed such a chart around 1910–1915. Using a gantt chart maker allows project managers to build and adjust schedules with greater flexibility and clarity. Some modern Gantt charts also display the relation of dependence between the current status of the schedule and related activities. Professionally designed gantt chart templates can further simplify setup and ensure consistency across different project phases. In other words, the chart illustrates the project’s breakdown structure by showing the start and finish dates as well as different relationships between project activities, helping you monitor the duties against their designated time or predetermined milestones.
 nectar.northampton.ac.uk
 cgt.cat
 ucbestari.edu.my
 silogora.org
 kent.ac.uk
 casses-autos.com
 press-files.anu.edu.au
 gentges.de
 ips.mmu.edu.my
 dlsu.edu.ph
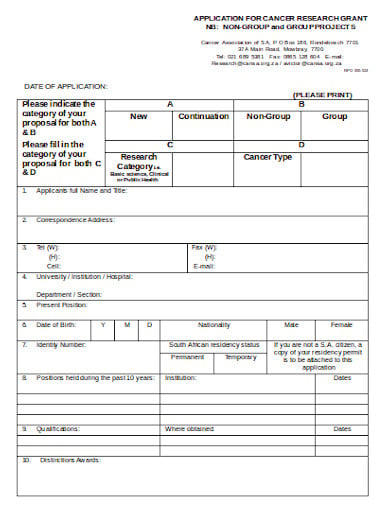 kansa.co.za
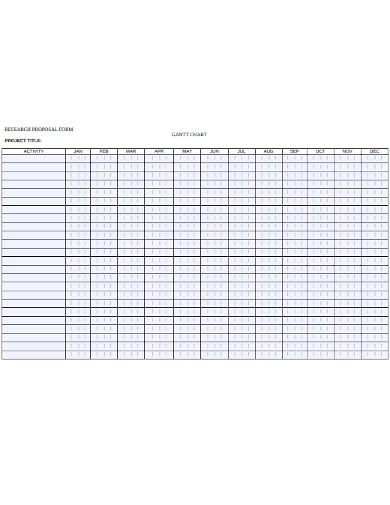
You begin by entering the data in an Excel spreadsheet for your project. Chart each task in a separate row and frame your project plan by inserting the start date, end date and duration (the total number of days required to complete the tasks).
You start creating your Gantt chart in Excel by creating a regular Stacked Bar chart. To do this, from the column header, you need to choose a range of your start dates. Make sure that you only select those cells which have data and not the whole column. Turn to Insert tab and select Group charts and click Bar. Click Stacked Bar under the 2-D Bar section.
Once you have the stacked bar on your sheet, you can proceed to add data of one or more series in the chart. To do this, right-click anywhere within the chart and then select Select Data from the following menu box. Once the Select Data Source window opens, you will see that you need to enter the Start Date. You will also need to add Time. In case you want to add more data to the chart, you can click the Add button to select the required data.
When the Edit Series window opens, you have to type in “Length” or any other name of your choosing in the Name field of the Series. Optionally, you can also position the mouse cursor in this field and click the header of the column in your spreadsheet and the clicked header is added as the name of the Gantt chart for the Sequence. A small window on the Edit Series opens. Click on the first Duration cell and drag the mouse down to the last duration to select your project’s Duration data. Go back to the Edit Series tab and click Ok.
Now you have to write the task list on the left side of the graph. To do this, right-click anywhere within the plot area of the graph and then click Select Data to reopen the Select Data Source window. A tiny Axis Label window will open and you need to choose your tasks the same way you selected Durations in the previous step Note, you should not include the header in the column. Press OK twice to close the open windows. Delete the block of graph labels by right-clicking on it and choosing Remove from the context menu. Your Gantt chart should have task details on the left side at this stage.
What you should have by now is a bar chart already stacked. To make it look more like a Gantt chart you need to add the proper formatting. Your goal is to delete the blue bars as only the orange parts should be visible which represents the tasks of the project. To select them all, right-click on any blue bar in your Gantt chart, and choose Format Data Series from the context menu.
The Data Series Format window will appear, and you will do the following: turn to the Fill tab and pick No Fill. Then go to the tab Border Color, and choose No Line. To correct the reversal of the data in the chart, you need to click on the task list in the left-hand part of your chart. It shows you the Axis Layout dialog. Pick the reverse order categories option under Axis Options, and then select Close to save the changes.

Are you a visionary or a pioneer who needs a grant? If so, you might want to survey all over…

A training proposal templates is usually used by institutions/organizations that offer a huge range of training exercises and courses for…
A request that is made by a company or an organization announcing about the vacant position or any other profile…
Netzwerkverbindung! This word fits the current status of the world. You have coltan from the Democratic People’s Republic of Congo…
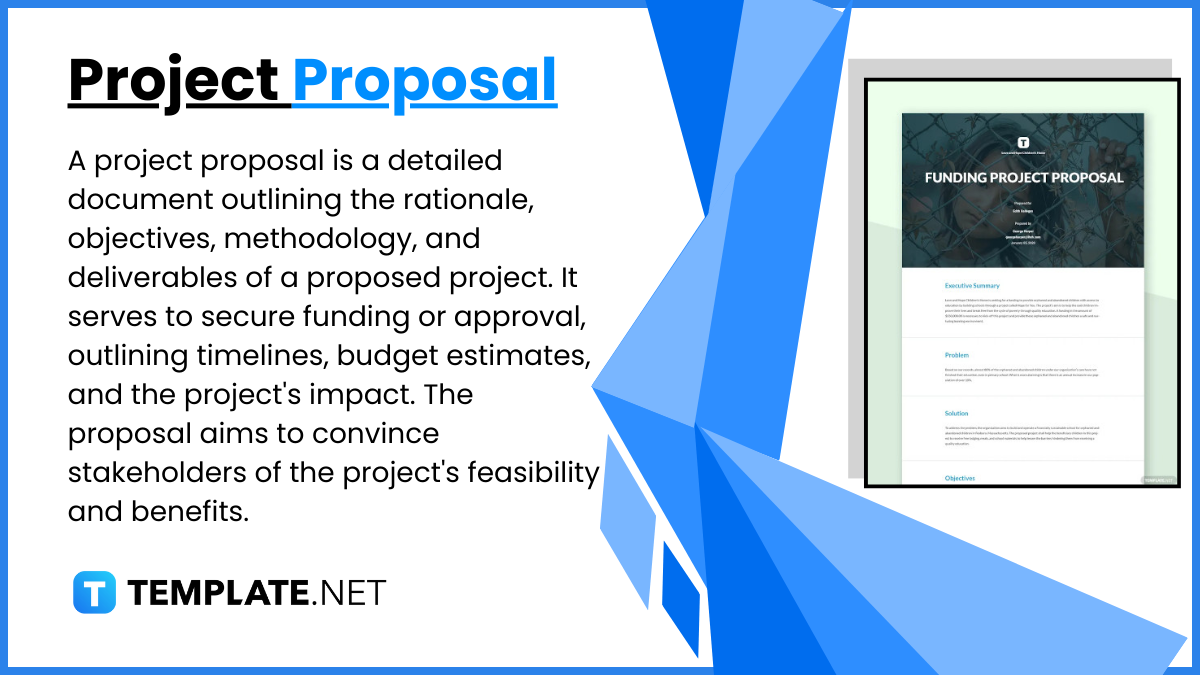
A project proposal is a structured document that outlines the objectives, scope, and implementation plan of a project, serving as…
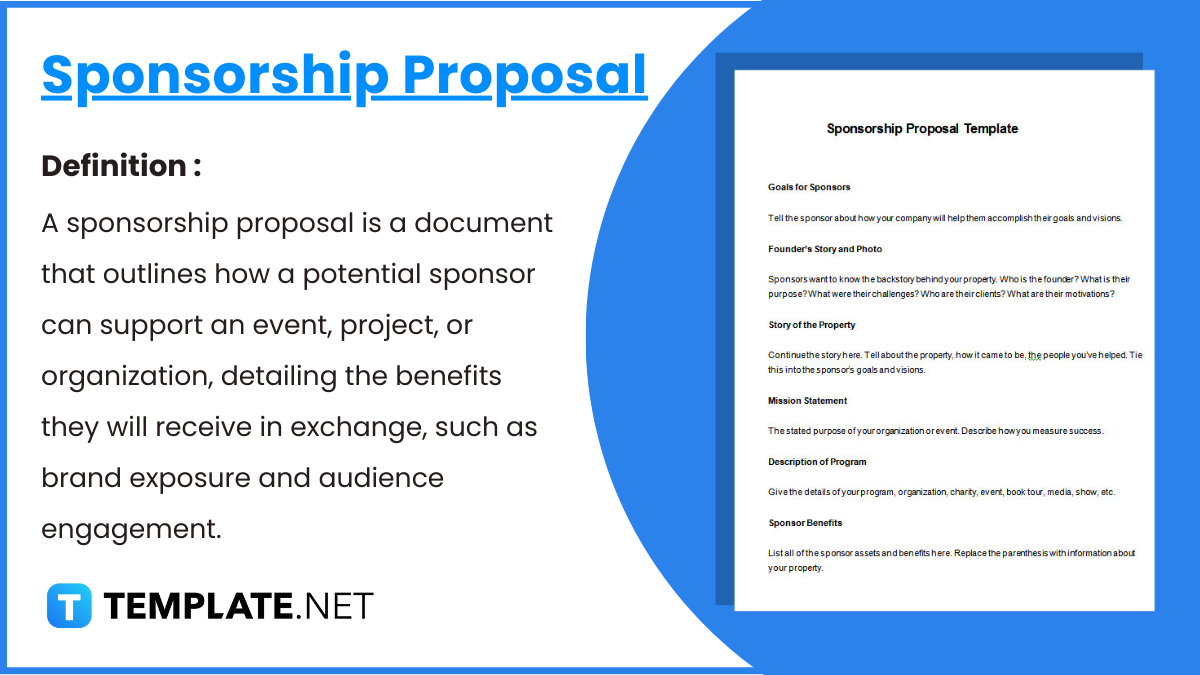
A sponsorship proposal is a formal request outlining how one party can support another, typically through financial or in-kind contributions…

A funding proposal is used to provide an overall request to provide funds for the proposed project by giving an…

A detailed account of the products and services that are provided to your client with an estimated cost of each…

Your years in college or even in middle school wouldn’t be complete if you were never required to write a…