Discover the Power of Visualization with Activity Chart Templates from Template.net
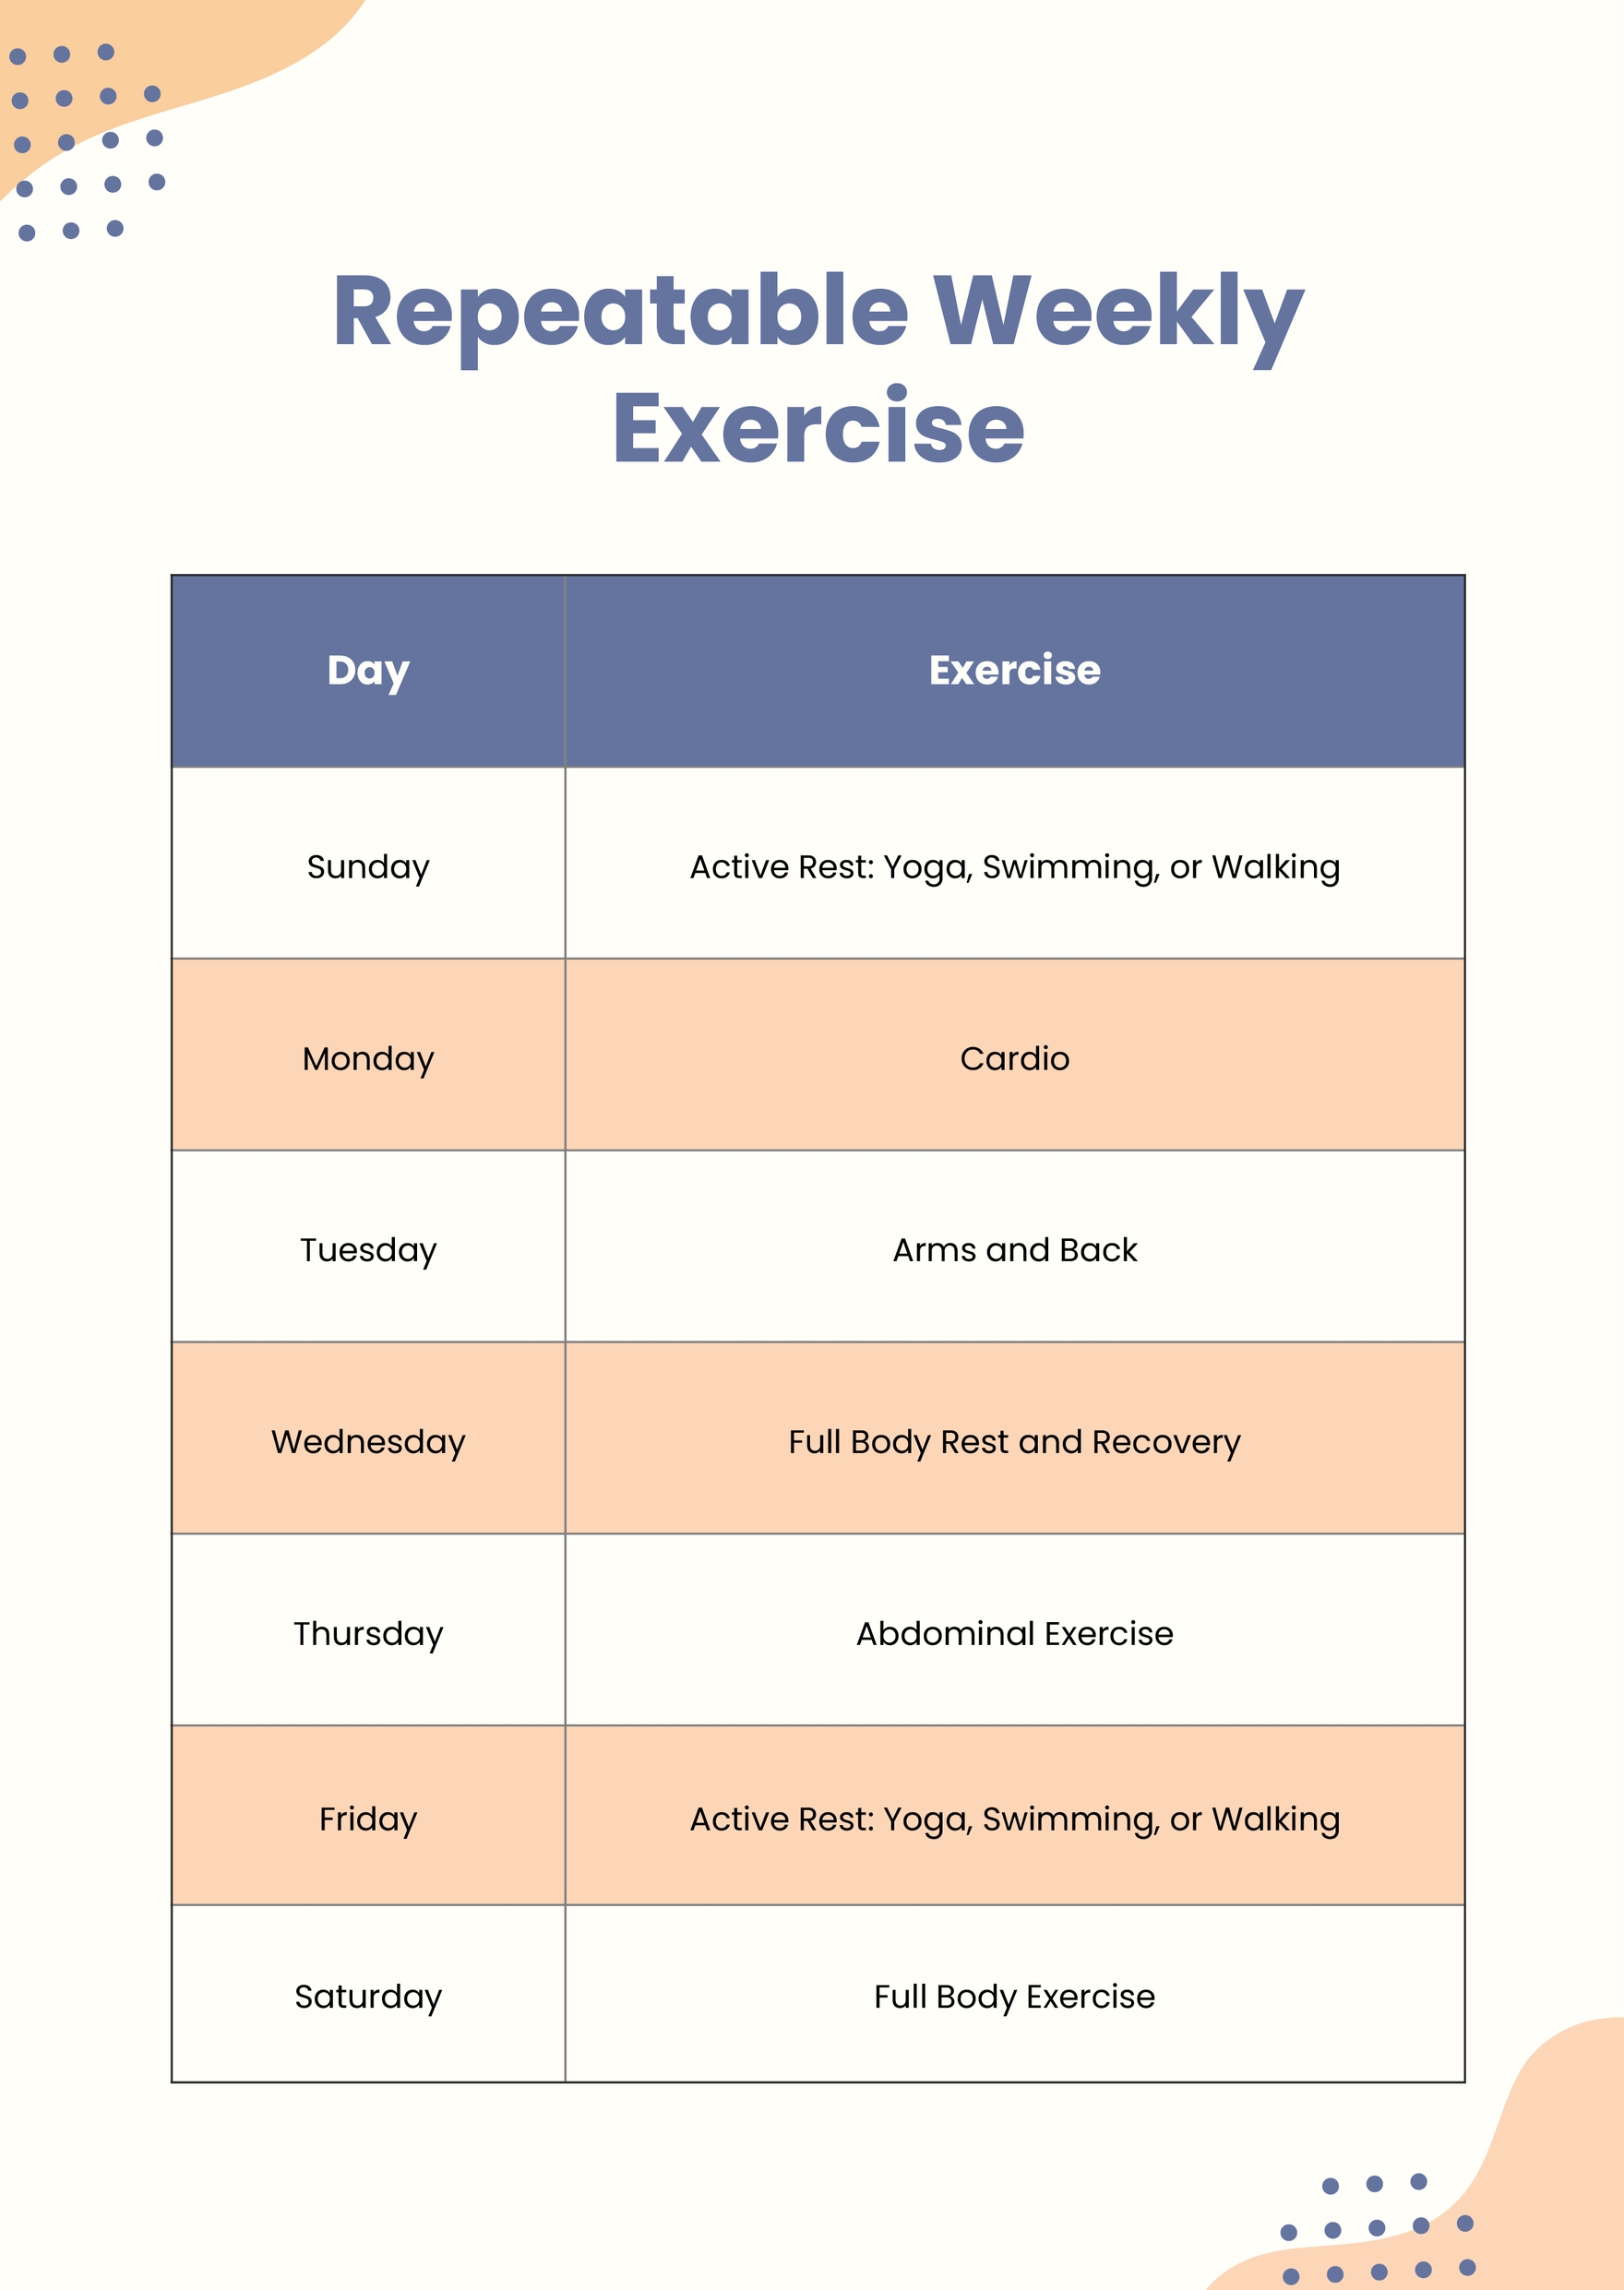
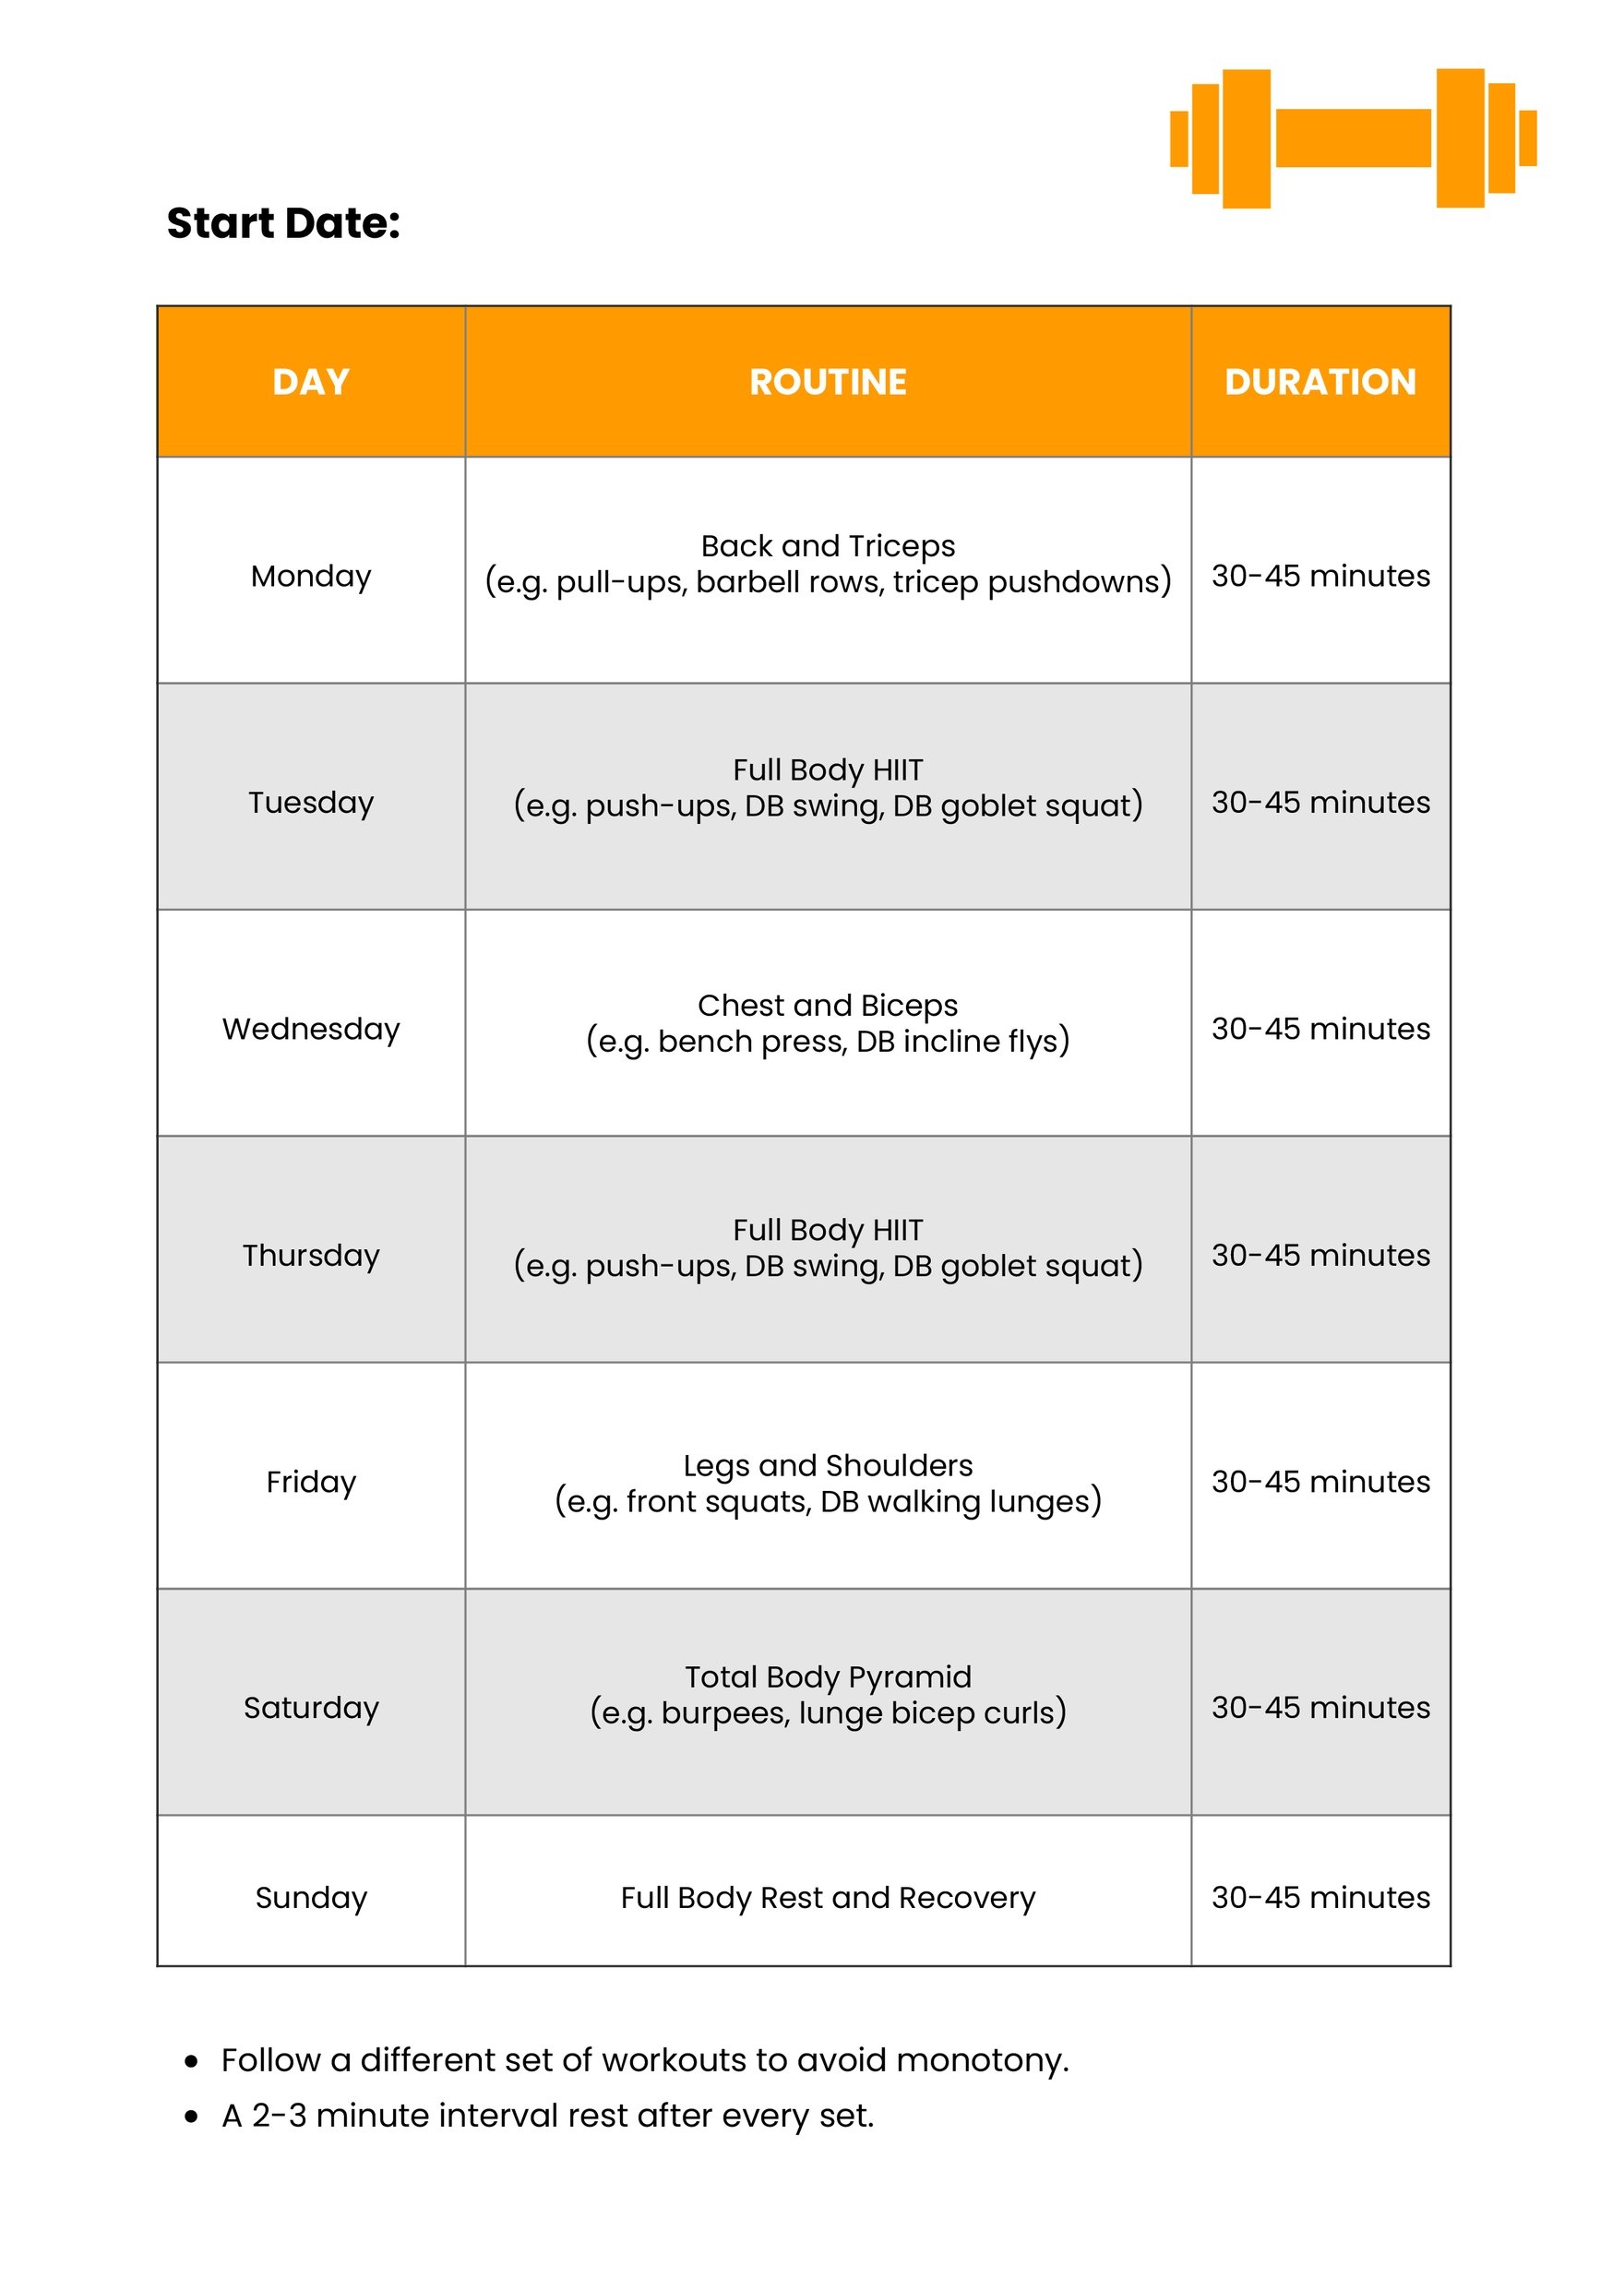
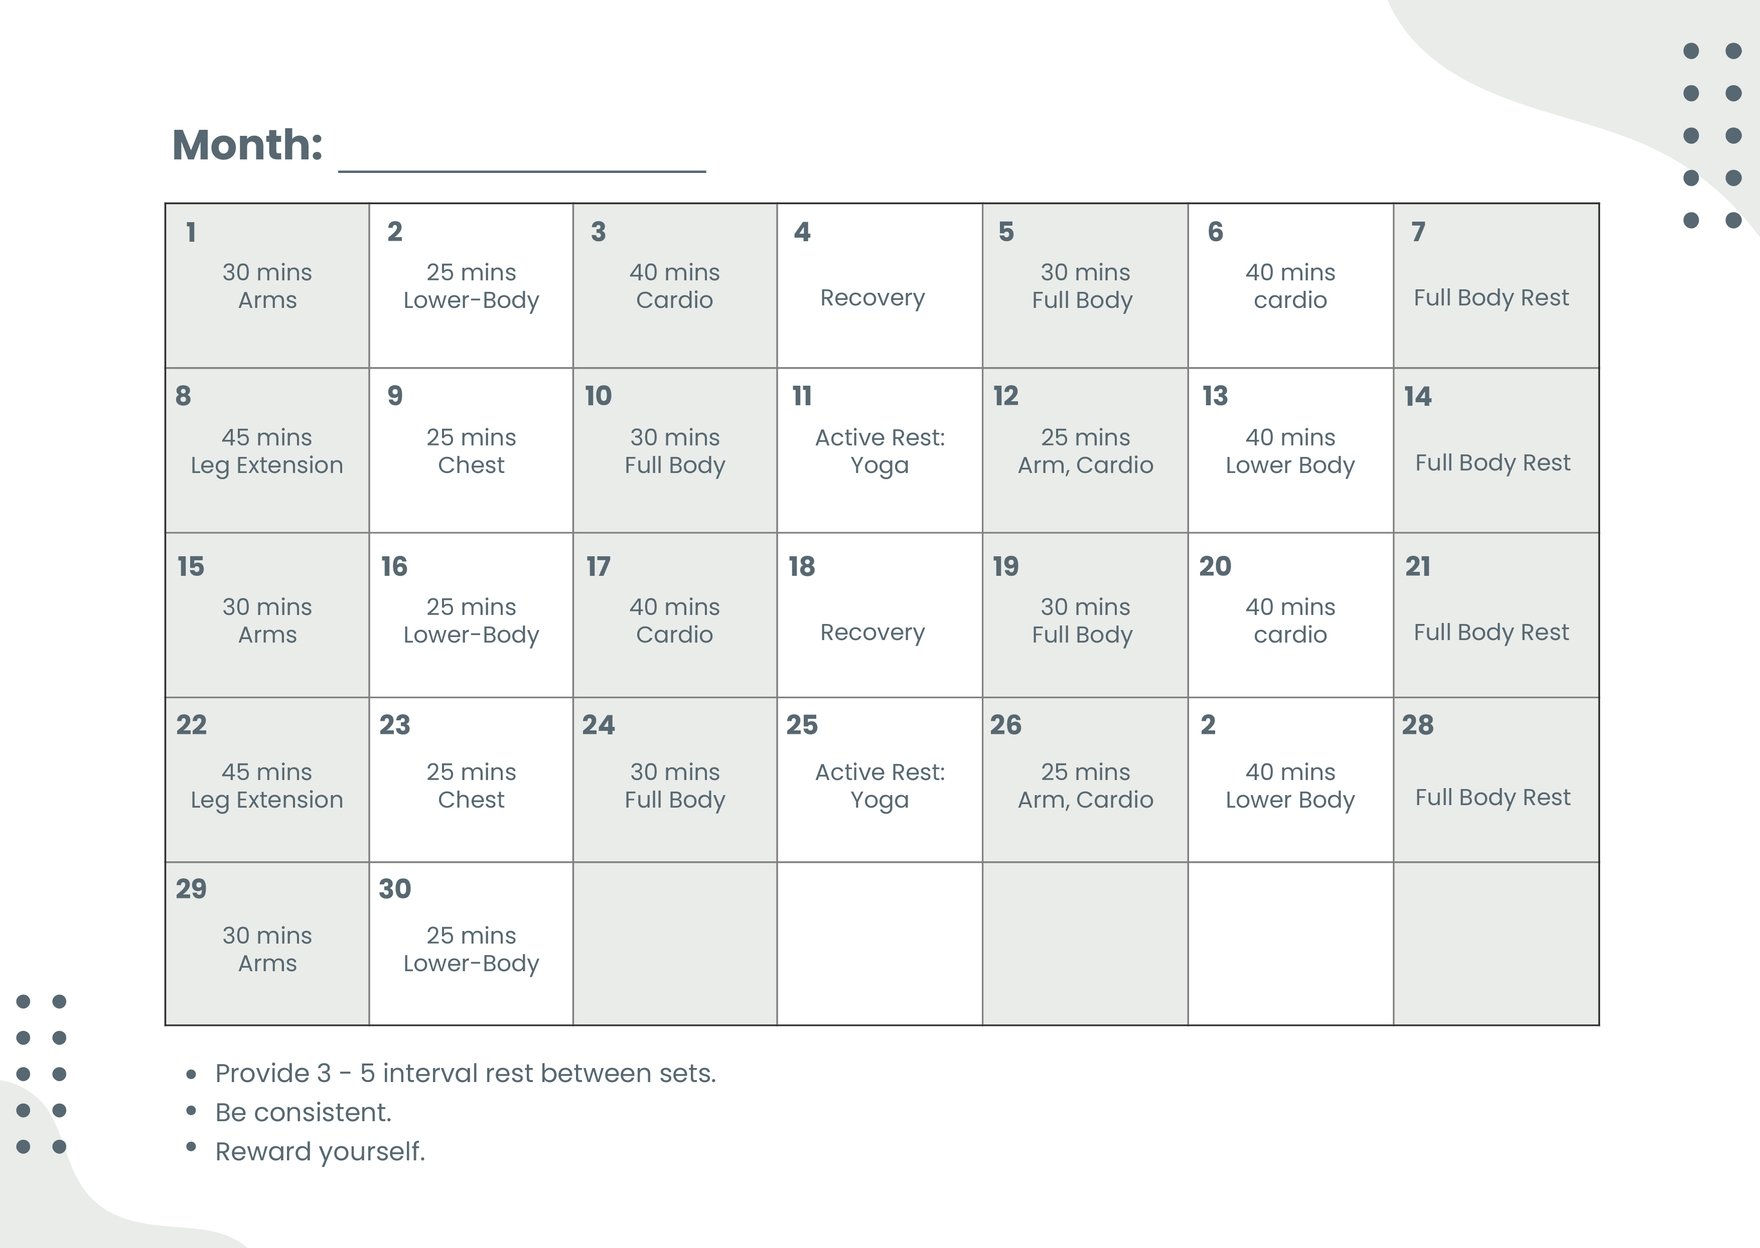
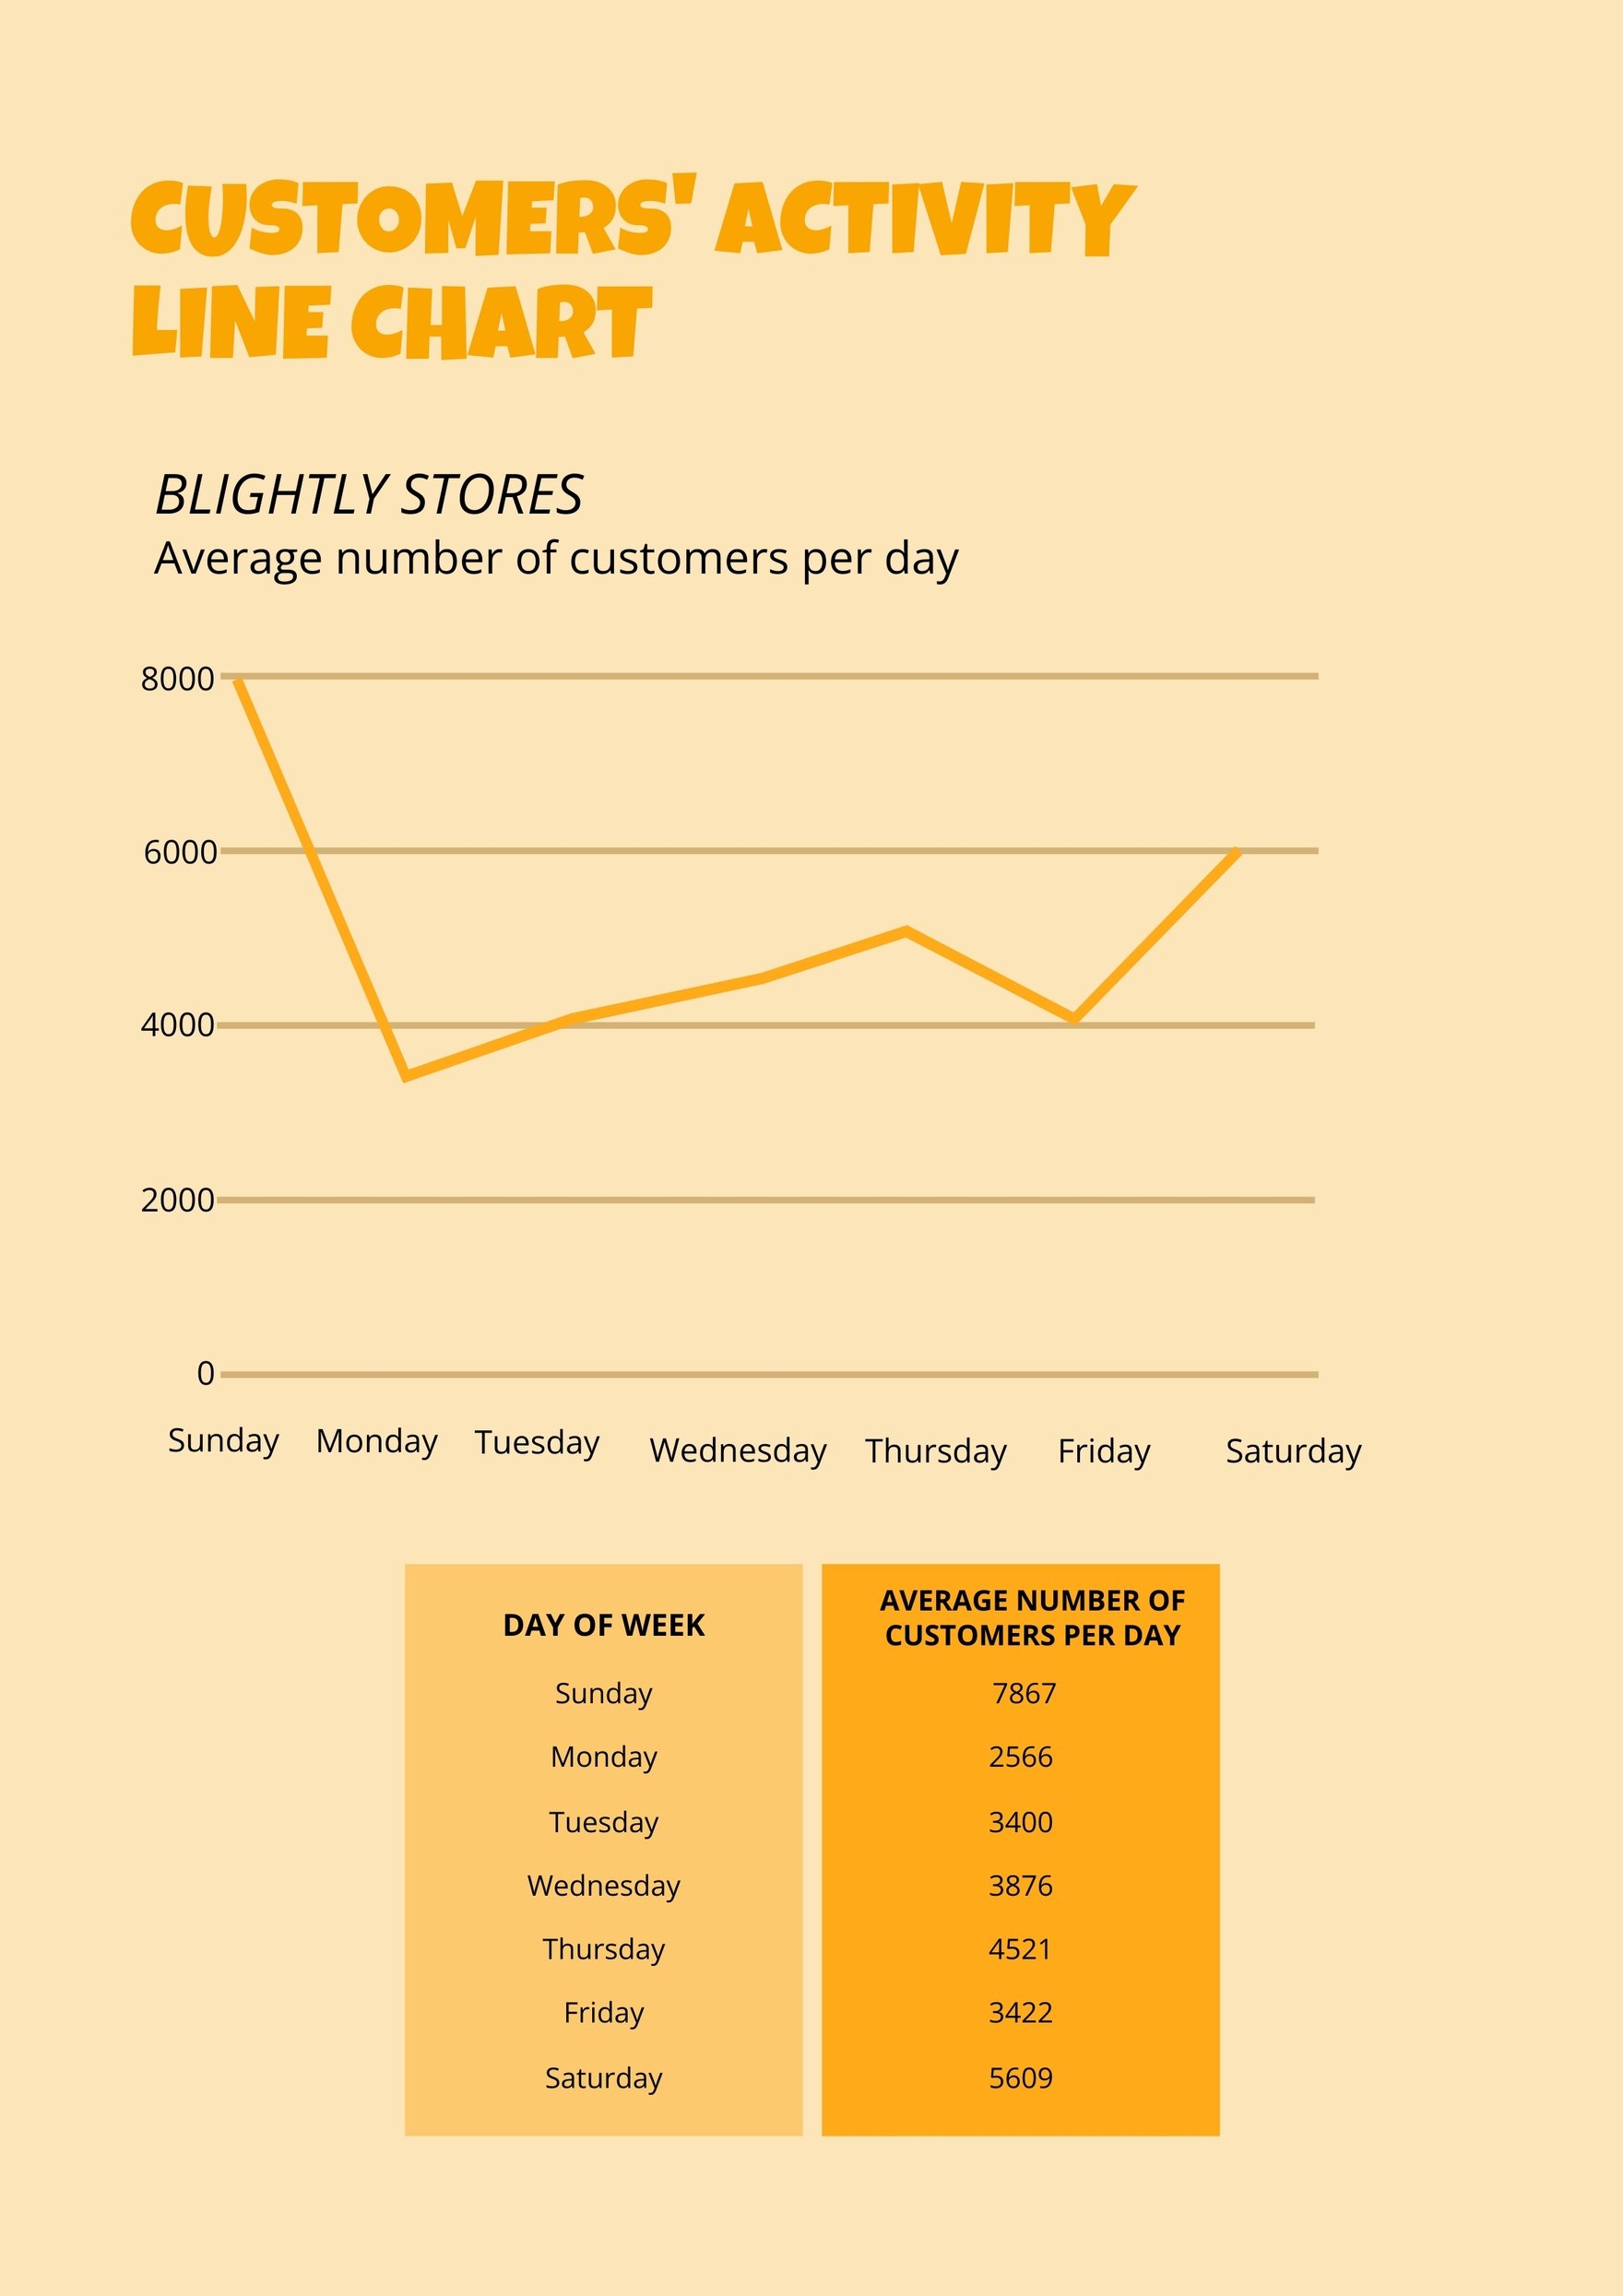
Bring your data insights to life with Activity Chart Templates from Template.net. Designed for educators, business professionals, and project managers, these templates keep your audience engaged, enhance clarity in presentations, and facilitate informed decision-making. Whether you're preparing to promote a sales strategy or organizing an event, these templates offer a seamless solution. Each template includes customizable layouts, precise chart types, and essential details like time grids and legends to clearly convey your information. Enjoy professional-grade design without the need for advanced skills. With Template.net, you'll have access to free templates that can be easily customized for both print and digital distribution.
Discover the many Activity Chart Templates we have on hand, each designed to meet diverse needs. Simply select a template and modify it by swapping in your own assets, and adjusting colors and fonts to match your brand. Advanced users can drag and drop icons or graphics, and even add animated effects to bring the charts to life. The possibilities are endless and require no prior technical skills, allowing you to unleash your creativity. Our library is regularly updated with fresh templates and new designs added weekly, ensuring you always have the latest tools at your fingertips. When you're finished, download or share your creation through multiple channels, whether via email, social media, or direct export. Collaborate with ease and elevate your content effortlessly.
