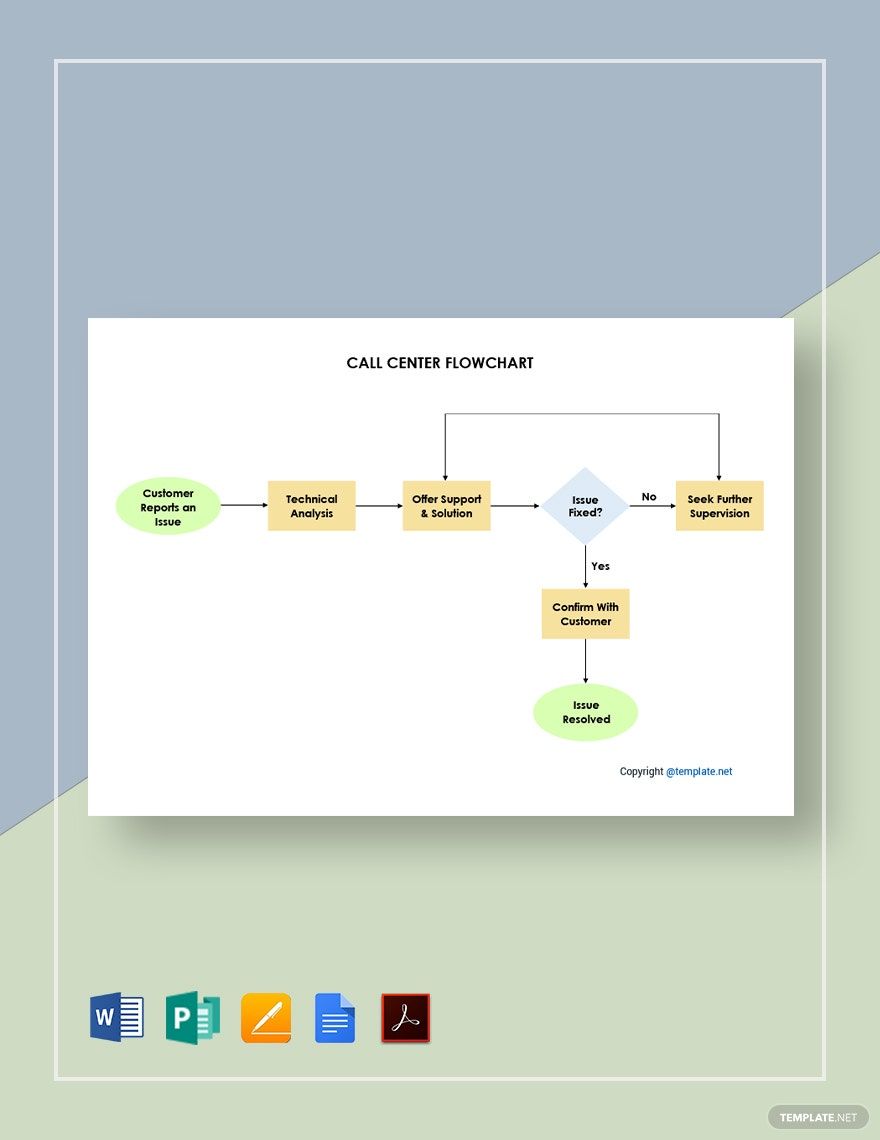
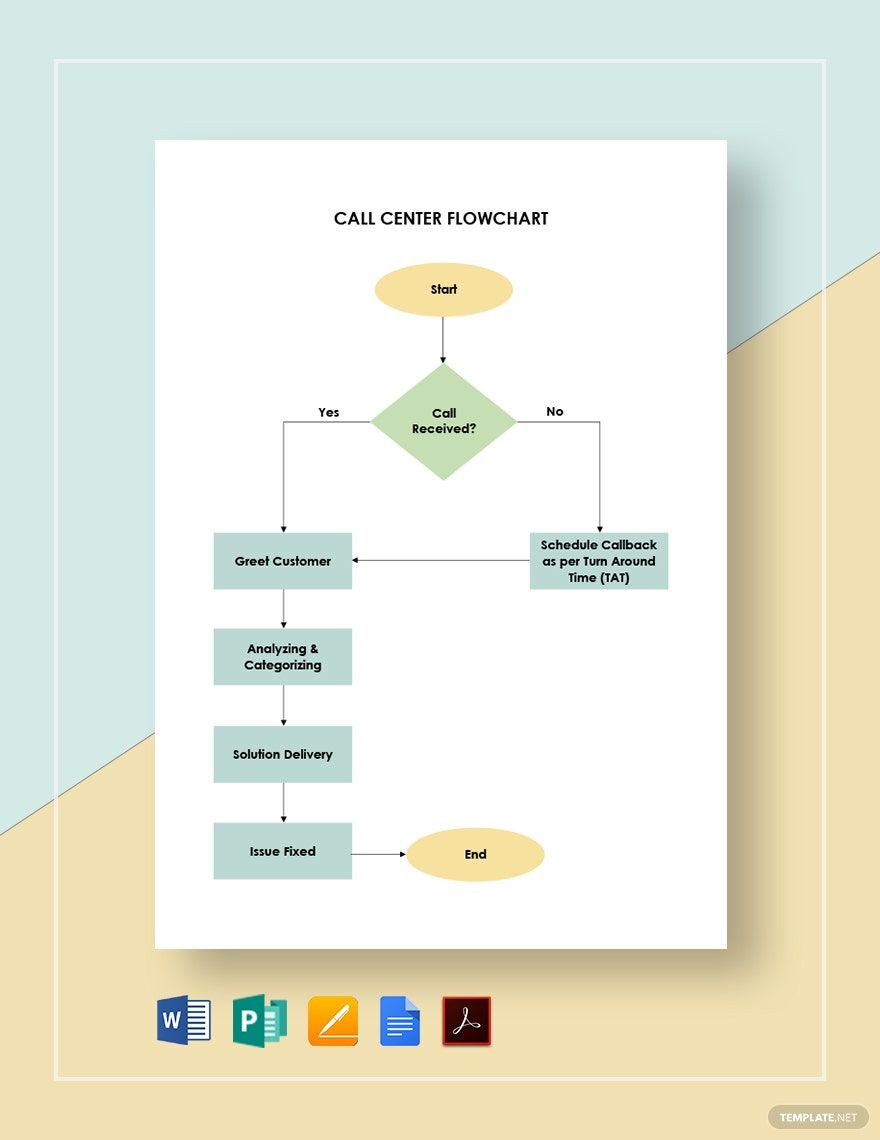
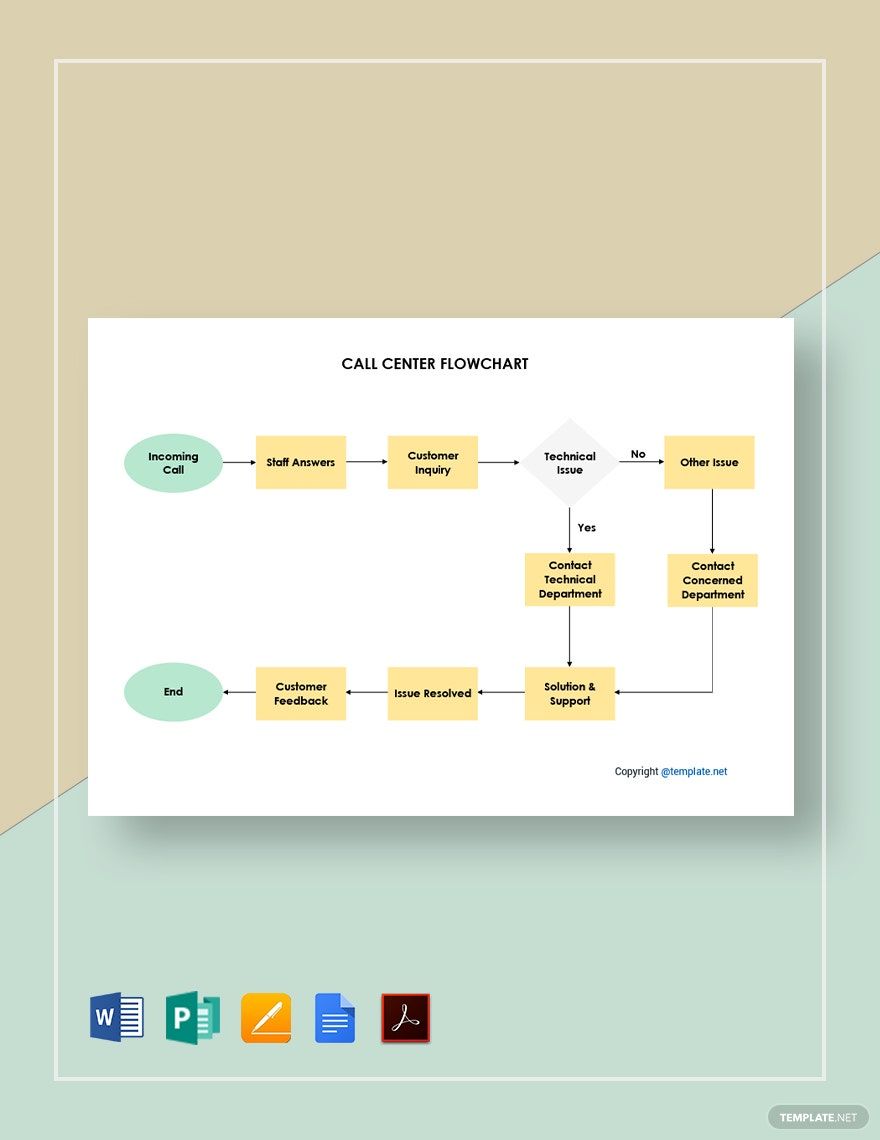
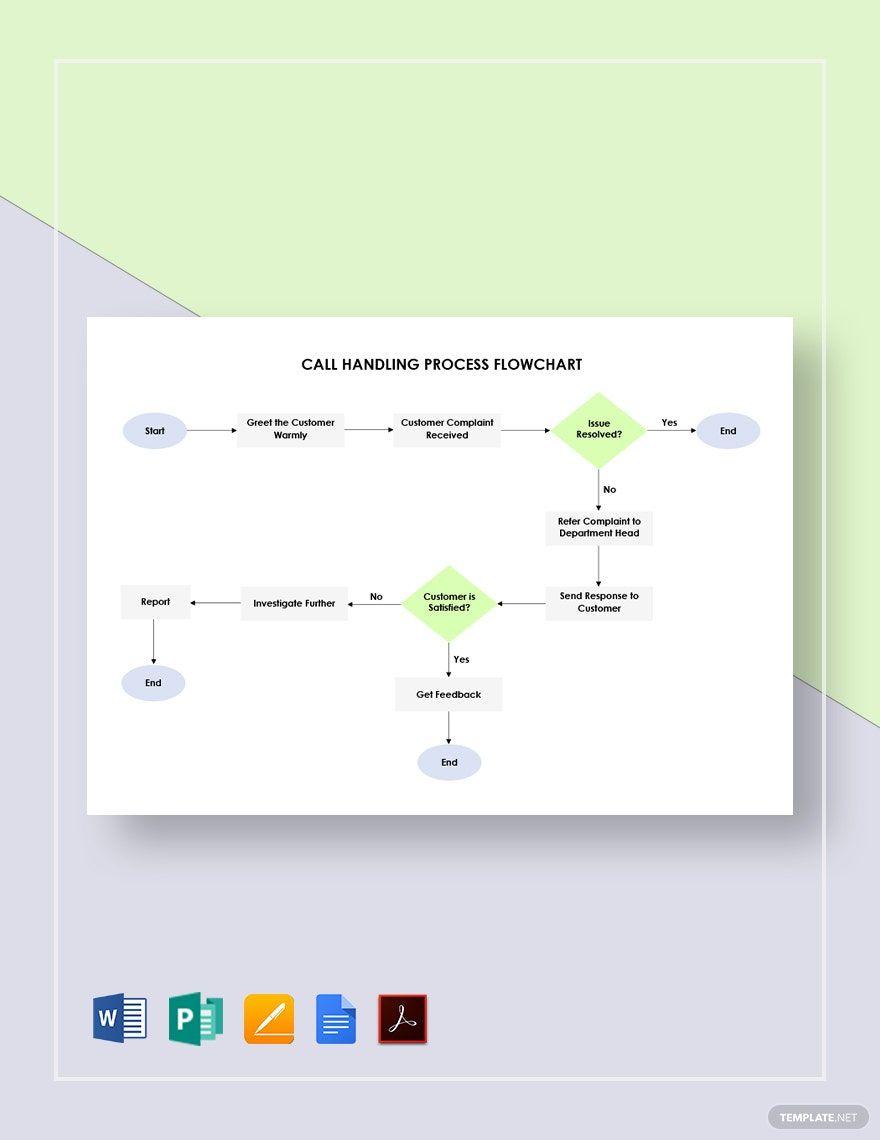
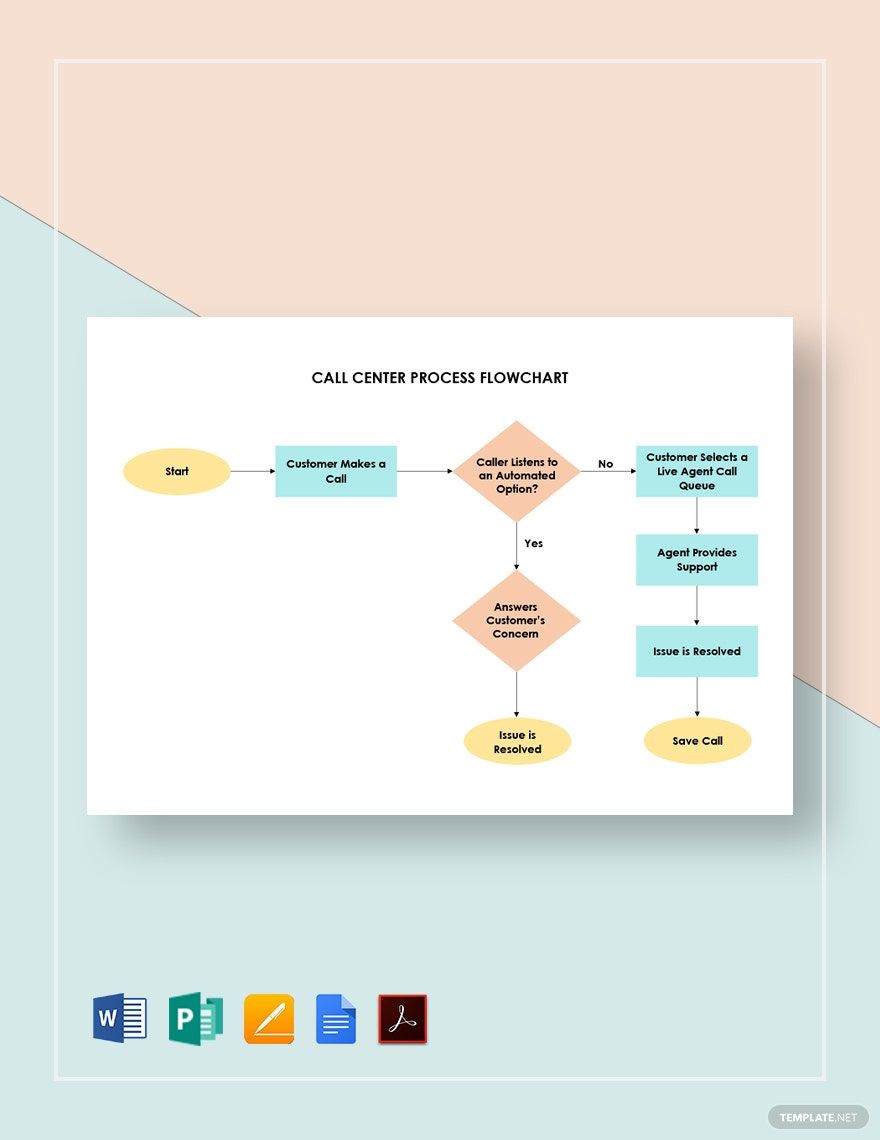
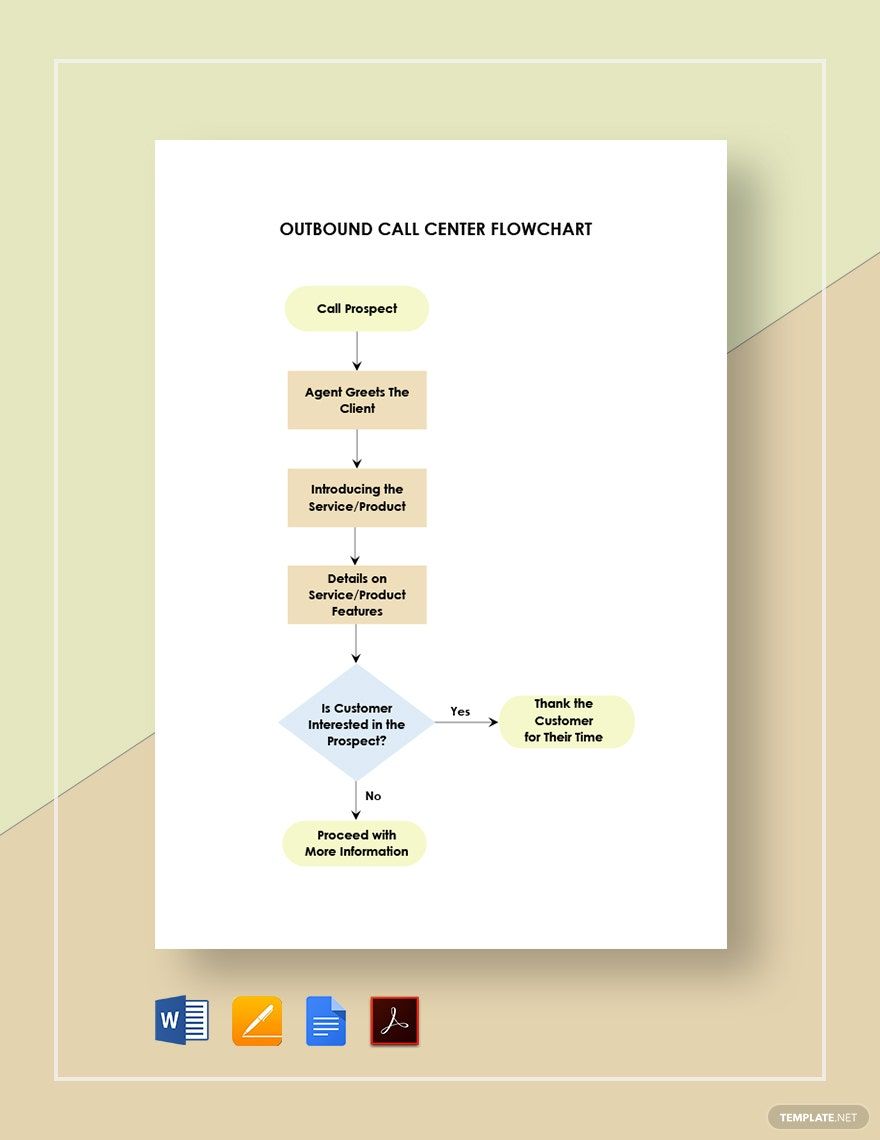
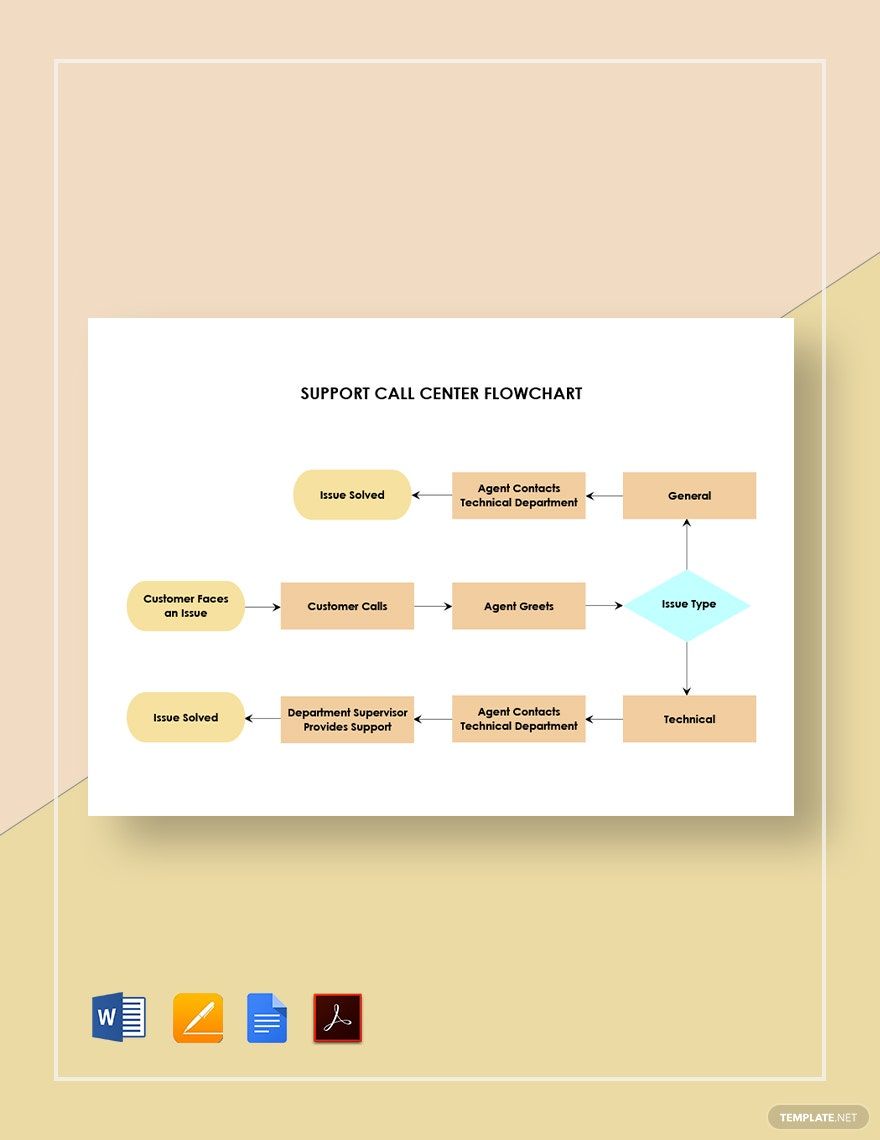
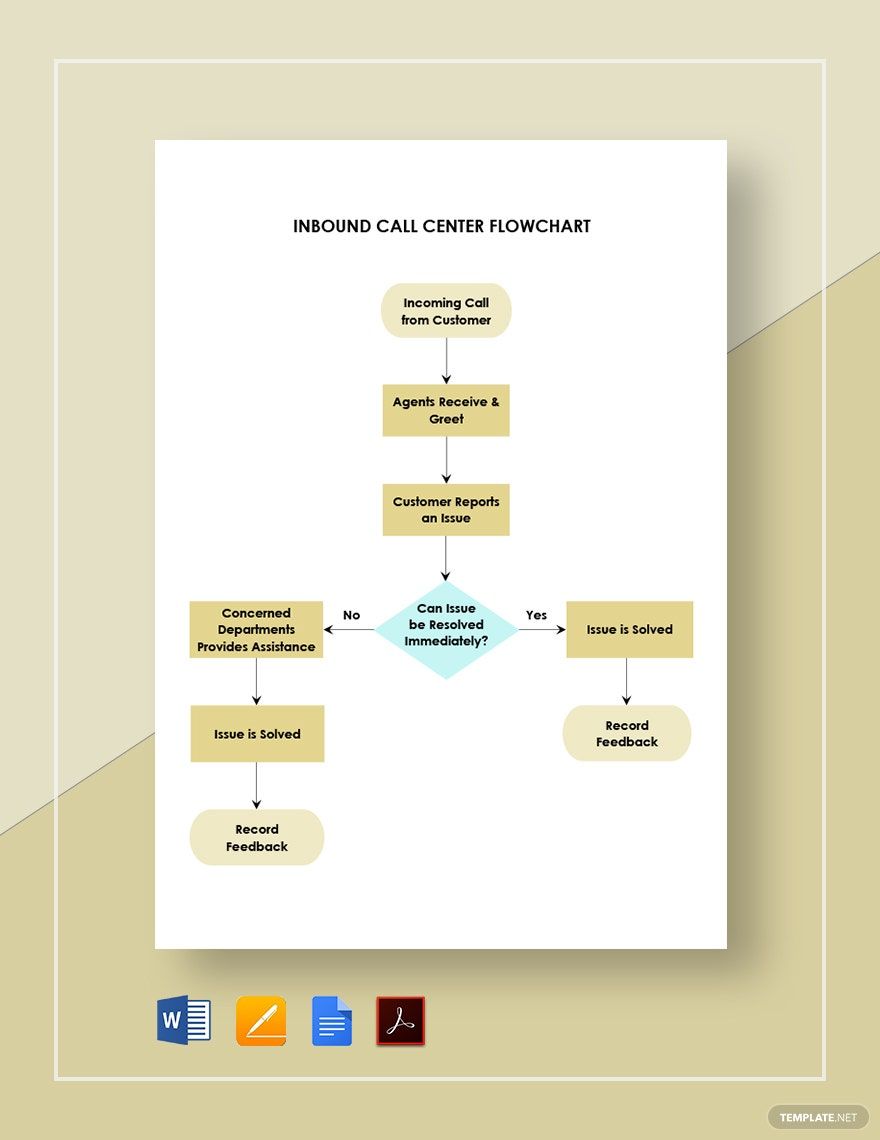
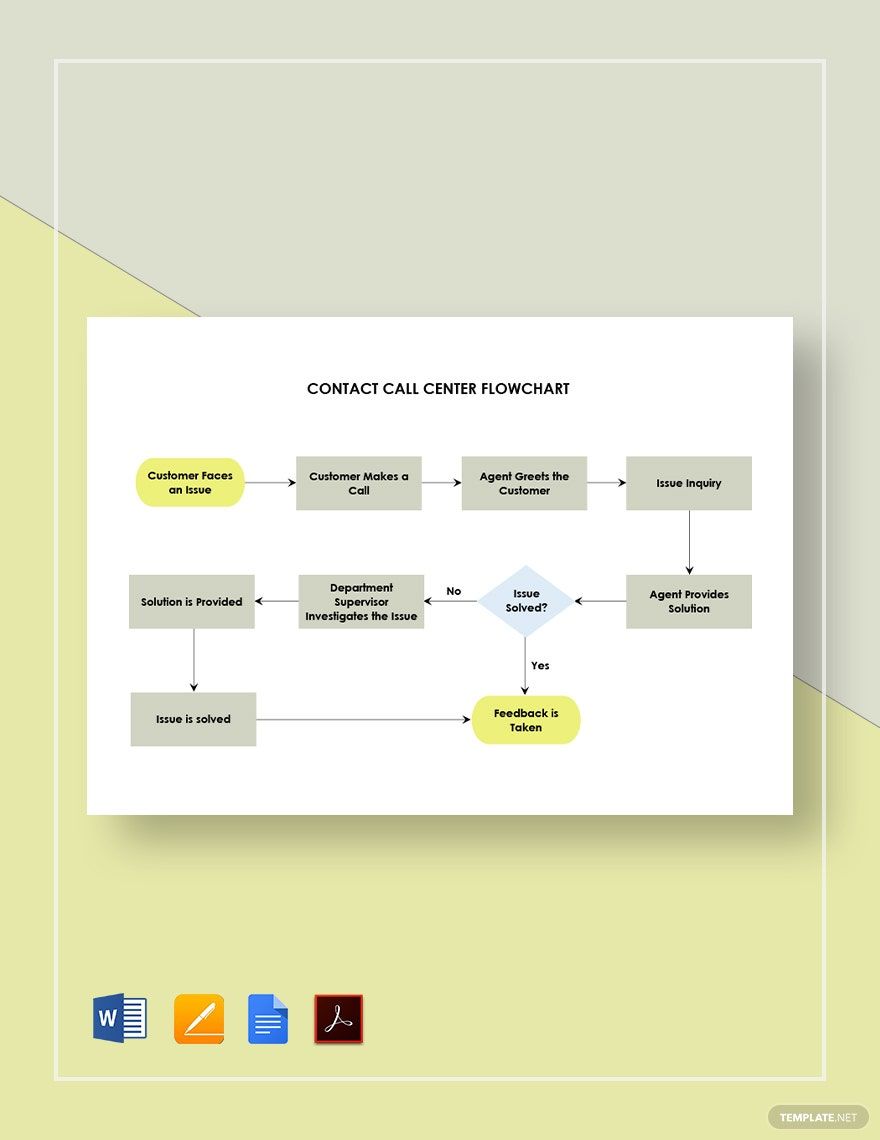
Achieving maximum client satisfaction is only possible when you build constant rapport with them. That’s how call center agencies are conceived. They provide what is vital in every firm’s success—customer relationship. They’re the frontline of customer service assigned to drive traffic and build a lasting connection with both patrons and potential market. With over thousands of transactions to manage in both local and international settings, manage your network and improve your business procedures with our premium Call Center Flowchart Template in Google Docs collection. They are professionally designed with a high-quality layout and authentic content made to be conveniently accessible and customizable. Unlock the keys to a prolific future. Download now!
How to Make a Call Center Flowchart In Google Docs
Microsoft’s State of Global Customer Service Report in 2018 had some affirmative statistics involving proactive customer service experience. A whopping 90% percent of global consumers prefer that they’ll be provided a channel where they can air out concerns and complaints while 58% of them revealed how having a customer service influences their brand choices significantly. On the other hand, 61% percent of them have cut ties with businesses that cater to poor customer service. This is an indication of how call center organizations play a compelling role in the industry.
Improve your customer relationship management process by employing a call center flowchart. Below are some tips on how you can make your own:
1. Draft an Outline
A flowchart, in the most basic sense, is a process diagram. It presents an entire procedure and all its nuances through a visual chart, which promotes easy comprehension and eliminates technical jargon. It’s important that you understand how the system works if you’re going to construct a flowchart. Call for a team discussion or talk to someone in the administration and discuss your organization’s work flow. Brainstorm possible roadblocks along the management process and what solutions can you do to solve them. List down the points and turns of the system and jot an outline draft.
2. Apply Flowchart Symbols
A flowchart’s distinct characteristic is its unique symbols. Flowchart symbols help spell out the process visually through its underlying meaning and representation. They help the viewers interpret the data on the layout at a glance. Master the symbols and identify which ones you can integrate on your chart. Determine which shapes are applicable for your process and sketch them on your draft.
3. Observe Minimalism and Consistency
When it comes to your flowchart’s aesthetic layout, aim to be consistent and minimal. Keep in mind that it’s a business document and not an art project. Design professionally by using muted and light tones. Limit your palette to two shades and use it consistently. Make your layout pleasing in the eyes not only to gain visual points but also to make it more readable and comprehensible. Loud and bright hues tend to distract viewers and is not a suitable choice for technical materials.
4. Keep Everything in a Single Page
Avoid adding a second page on your business flowchart. Strive to fit the entire diagram on a single page. If the process is lengthy and requires another leaf, don’t place the second part at the back. Attach the papers side-by-side and connect them with the arrows and shades altogether. It’s so much easier to trace the flow when they’re all in the same area instead of flipping to another copy.
5. Validate the Result
Don’t conclude your flowchart-making without confirming if you’ve written the right data. Visualize the entire process and determine if the steps make logical sense and are linked perfectly. Ask a superior or the team involved in executing the procedure if the management flowchart's details are without flaw. This is necessary for ensuring that the right scheme will be performed. Committing a single mistake could cause chaos and ruin an entire department’s work flow.
