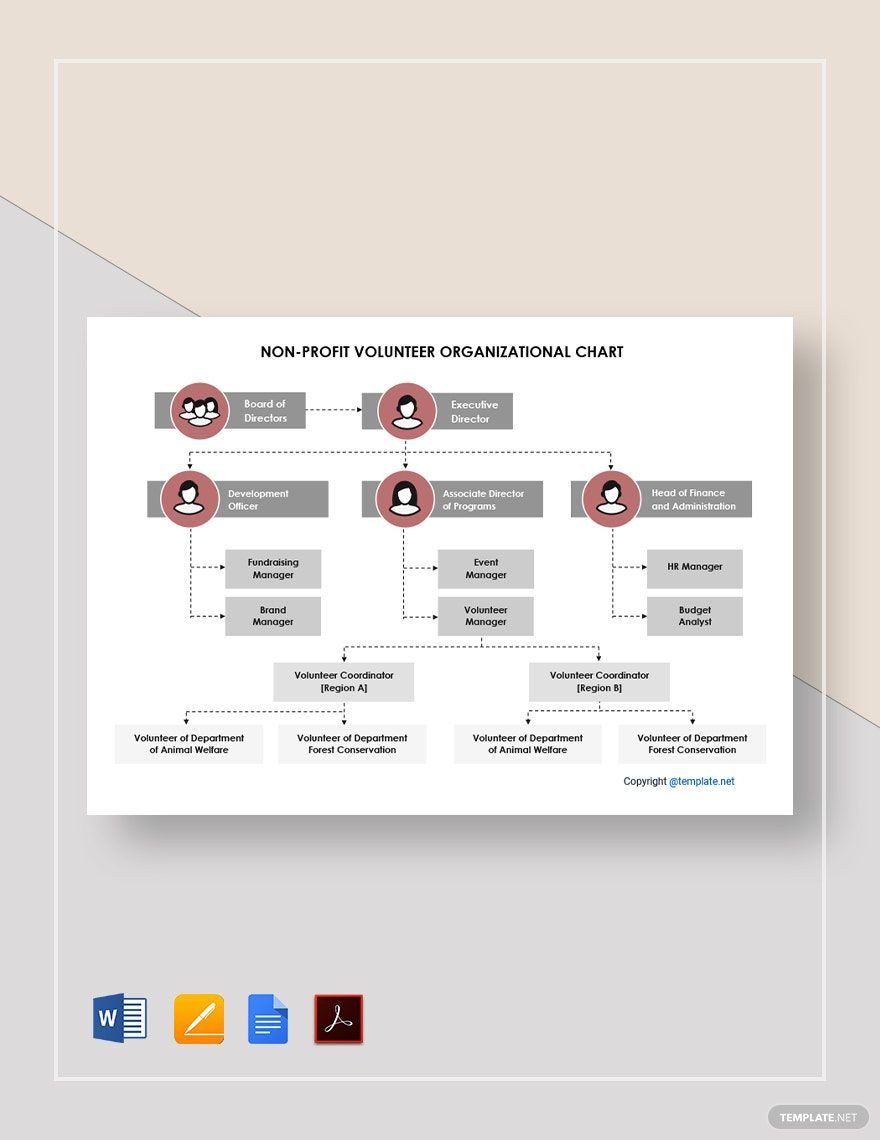
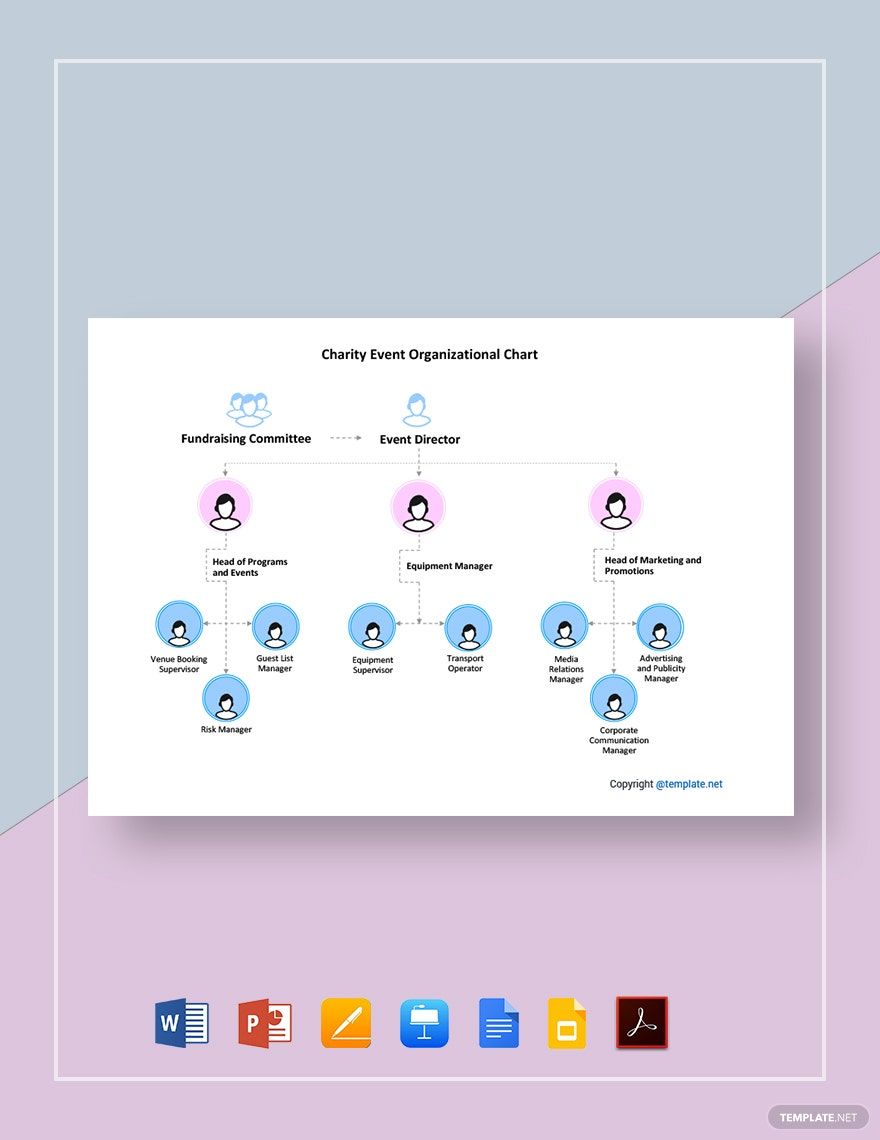
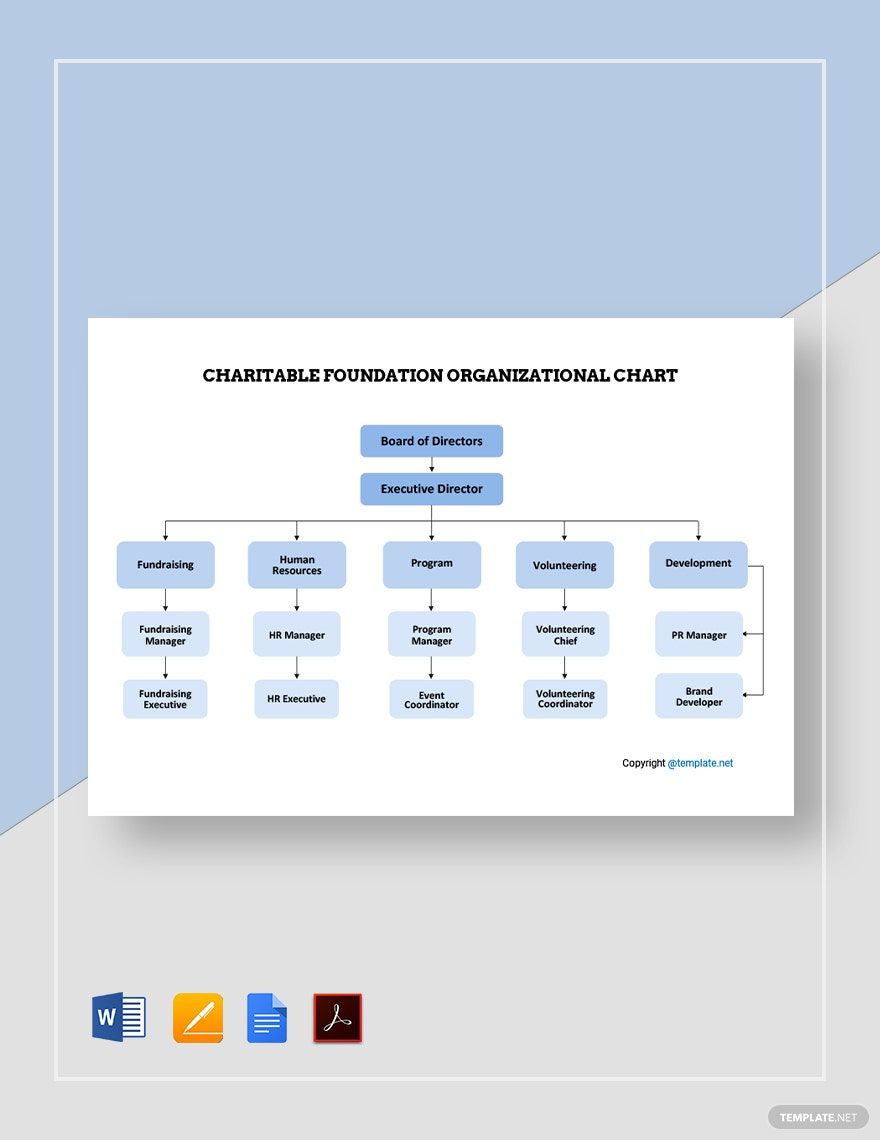
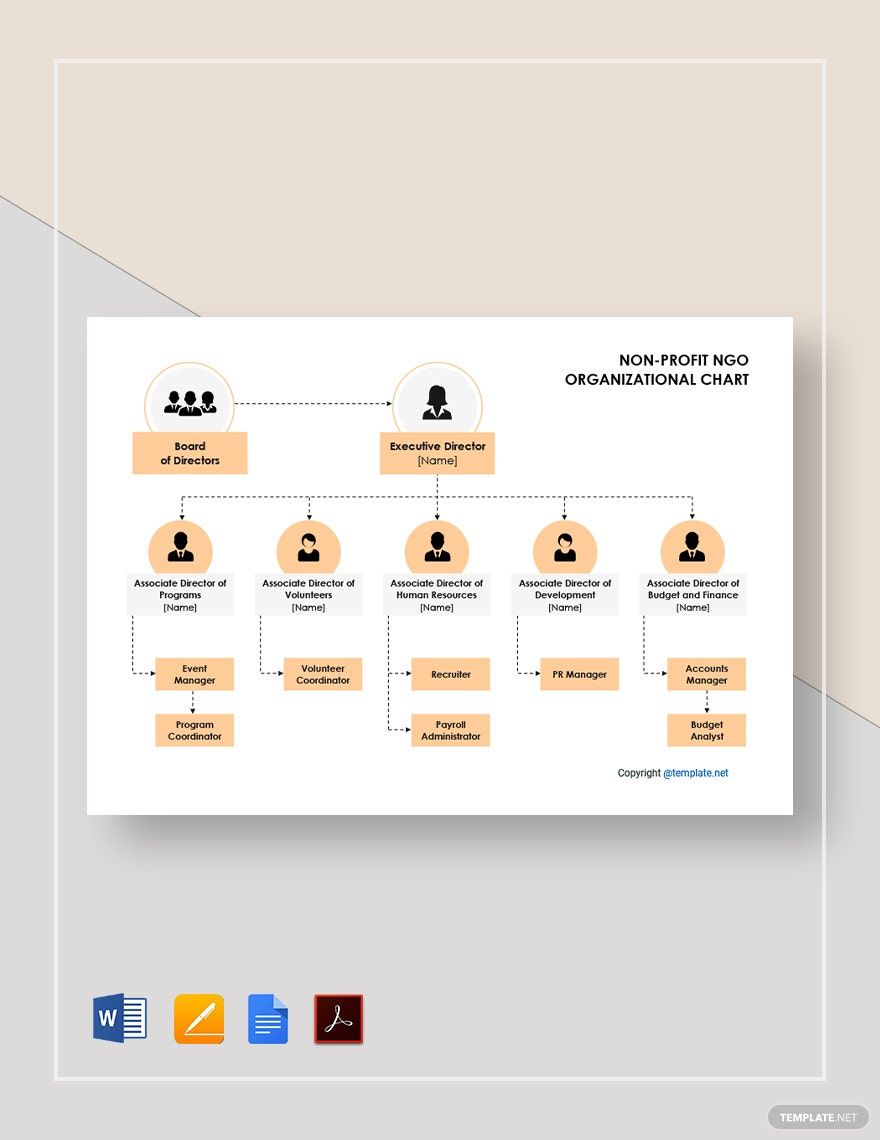
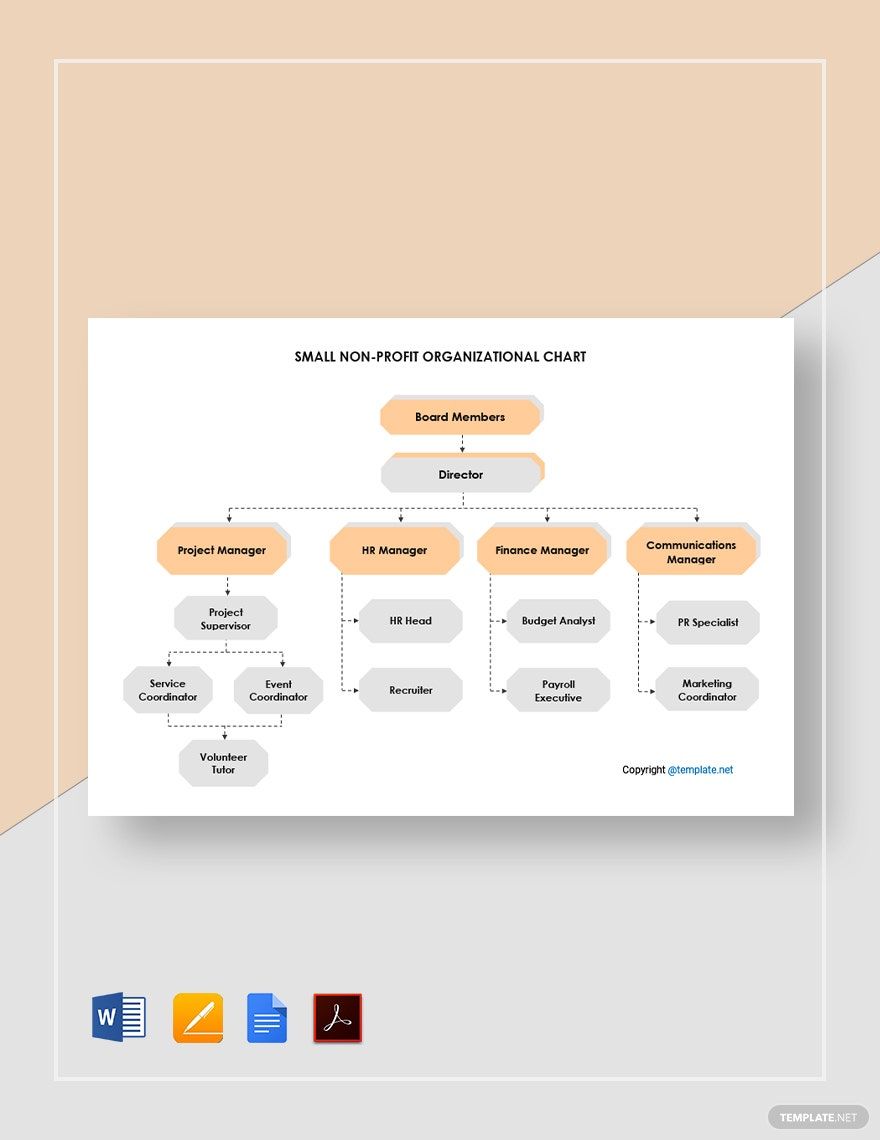
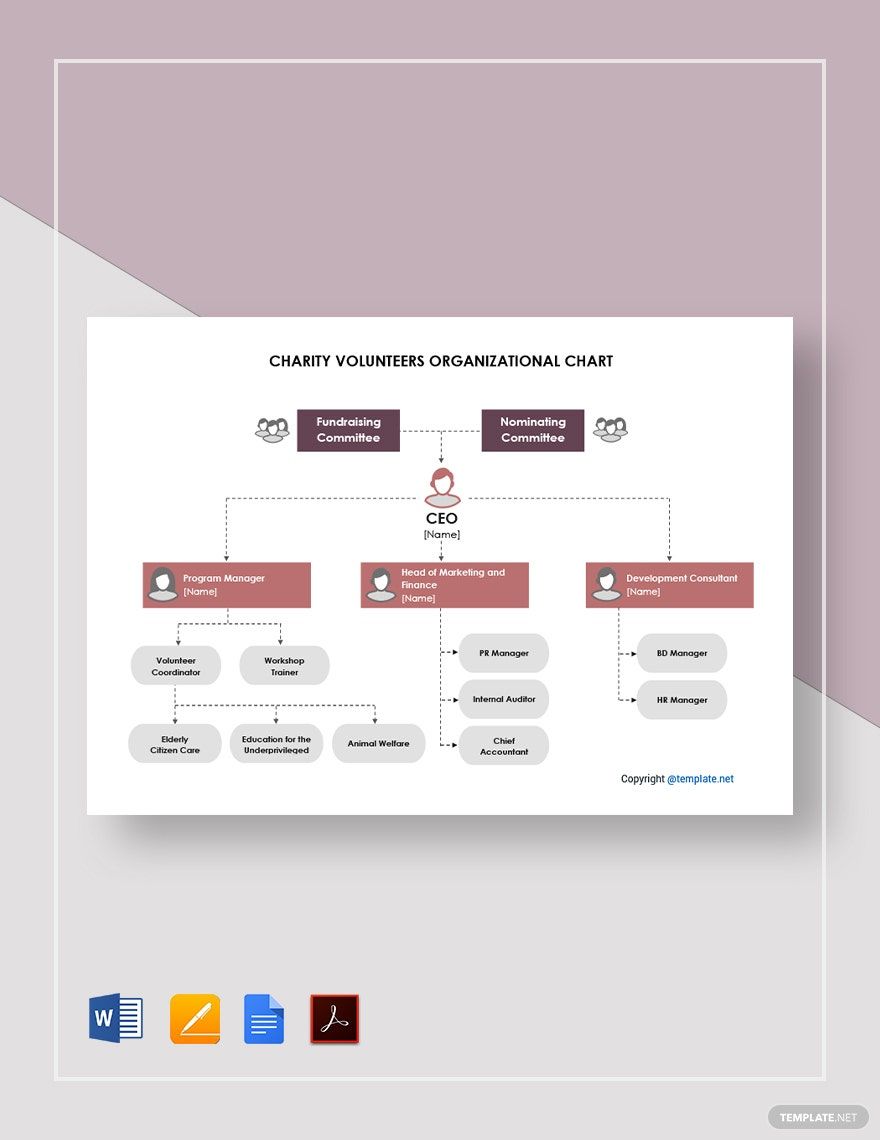
Although a lot may say that the world is selfish and unkind, there are still people who embrace philanthropy. These are the people who like giving donations and supporting organizations like charities. On the other hand, people who work in charities like you have to keep things organized, too. You can do that through flowcharts. If you don't have one, then download from our Charity Flowchart Templates! These are 100% customizable and available in A4 and US letter sizes. These are editable in Word, Pages, Google Docs, Publisher, and PDF. Download now and make your charitable organization more productive and efficient!
What Is a Charity Flowchart?
A charity flowchart is a diagram that charities use to help them with workflows. This chart helps an organization to be efficient with their jobs.
How to Create a Charity Flowchart
In the USA, there are 1.5 million registered nonprofit organizations, and part of this number is charities. Speaking of charities, you only don't spread awareness or raise money, but you also have to be organized to perform well. So, we'd like to help you with that through a charity flowchart. Here are the steps for you:
1. Have One Focus
Your basic chart shouldn't have a lot of topics on it. You should set your eyes to only one subject or process. Is it a fundraising grant chart flowchart or a charity donation flowchart? This way, you can focus only on one process to make things quicker for you.
2. Organize the Chart Well
You can start by brainstorming the processes that your chart needs. Make a draft of the steps that you're going to do. Next, finalize the steps and organize them. Make sure that you organize the steps well. Likewise, in finalizing the list, make sure that you limit words in each step. Don't put long sentences. If you did, the sentences will not fit on the symbols and people will take a longer time reading your flowchart.
3. Use the Right Symbols
Symbols are one of the distinct features of a workflow chart. Each symbol represents something. To illustrate, the diamond shape represents making a decision. A box represents a single or subprocess. So, when you make your flowchart, choose the right symbols for each step.
4. Use Legible Typographies
In choosing the right typographies for your printable chart, you have to make sure that you select the legible ones. This way, people can scan the chart. Also, you may choose single typography for all the content of your chart to create consistency.
5. Add Colors
If you want the editable chart to look more engaging, you can colors. As a tip, use the same colors for the same shapes so that people can easily identify them. Don't just pick random colors. You have to make sure that the colors will complement each other. Don't choose the ones that are hard on the eyes.
