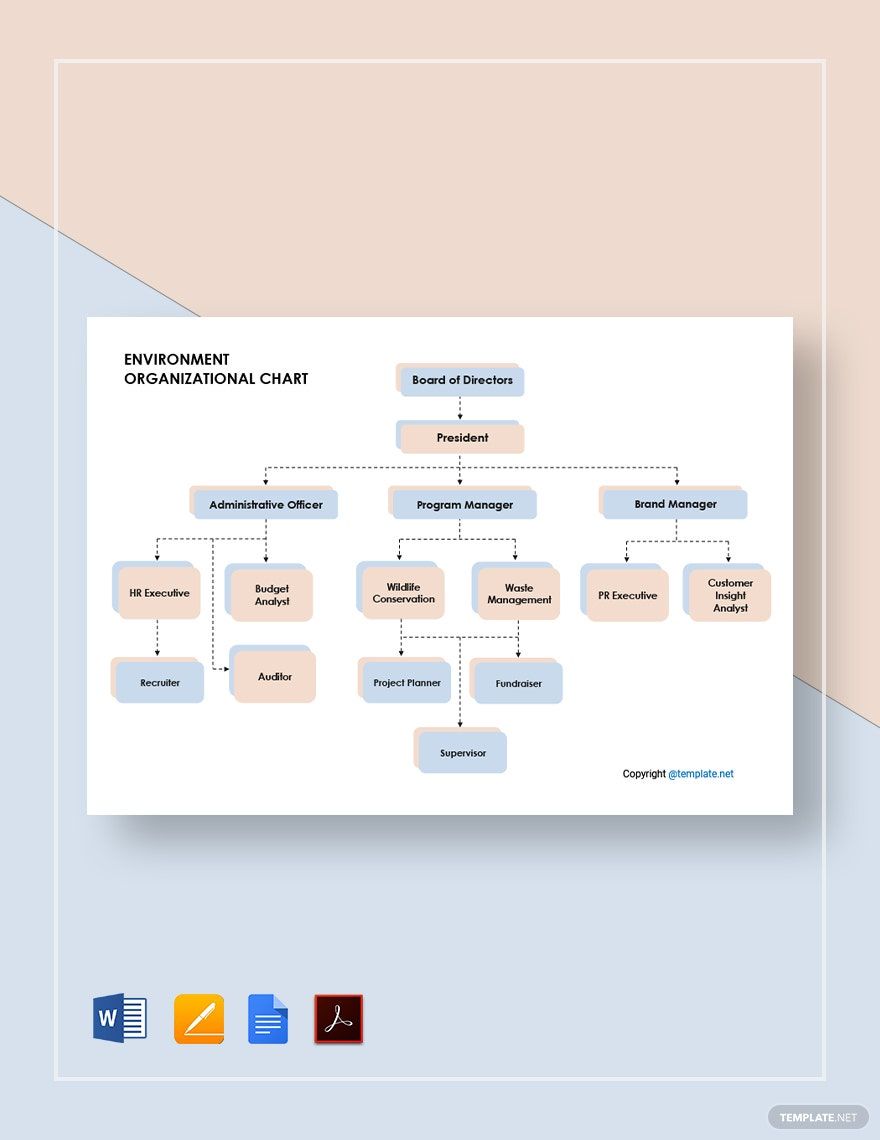
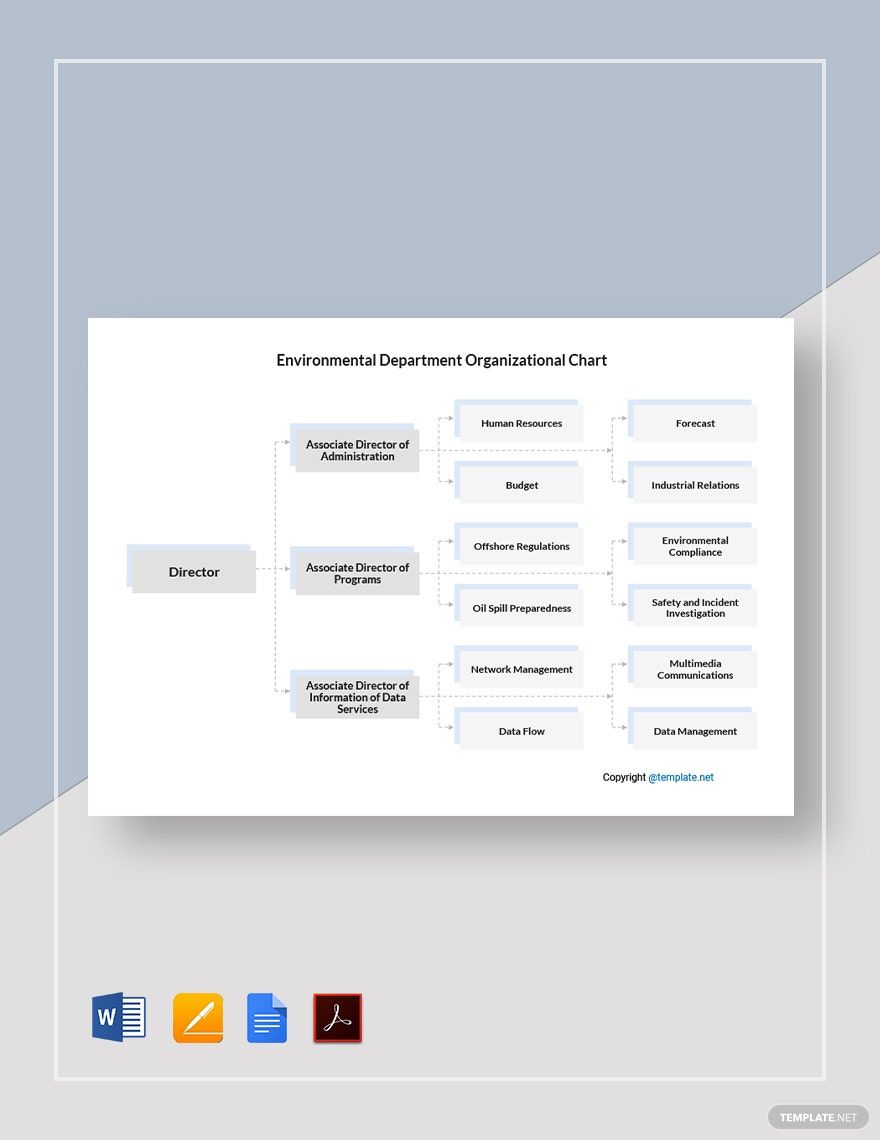
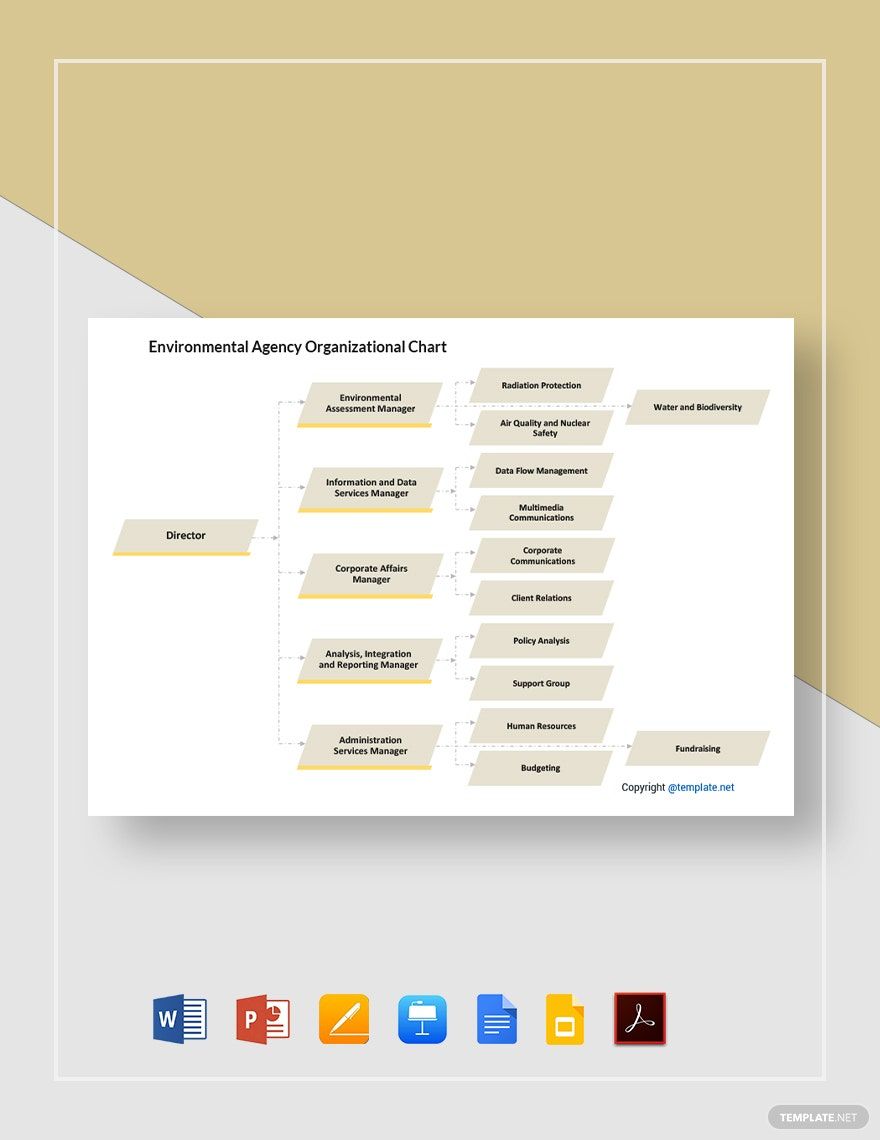
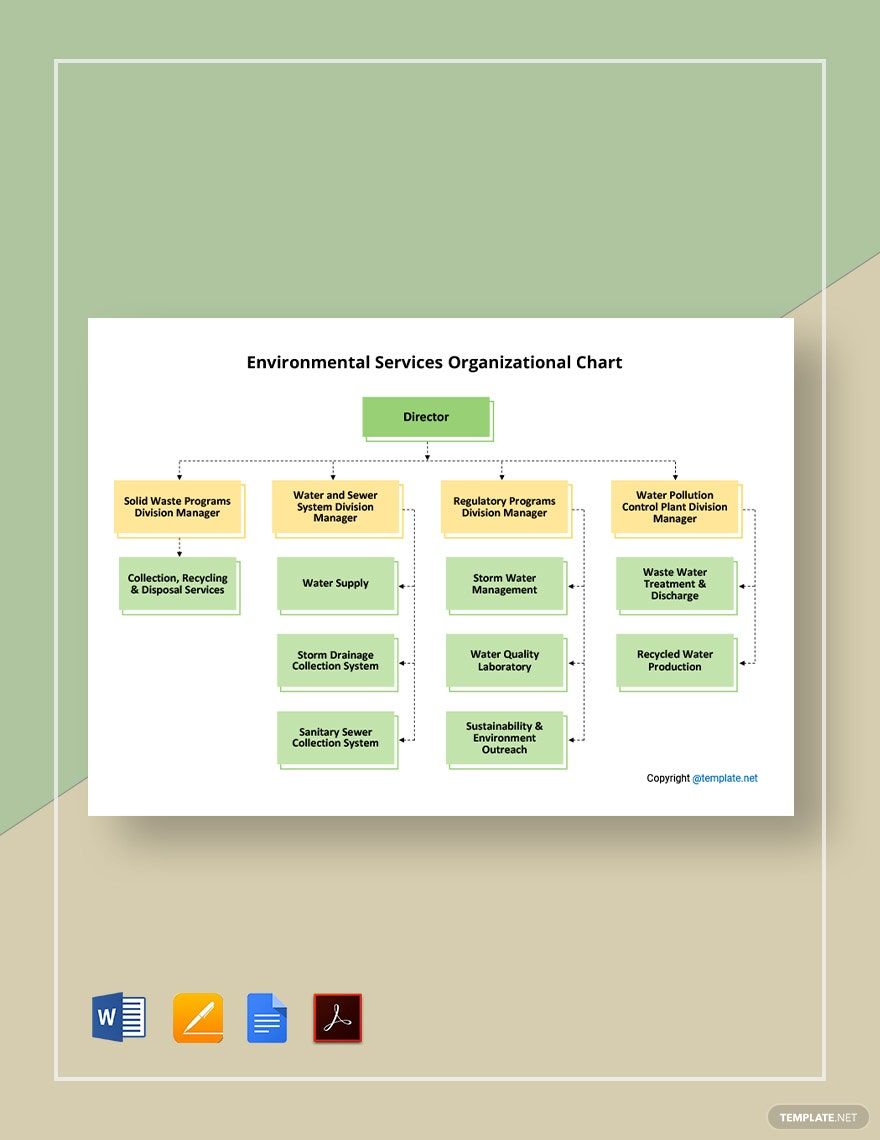
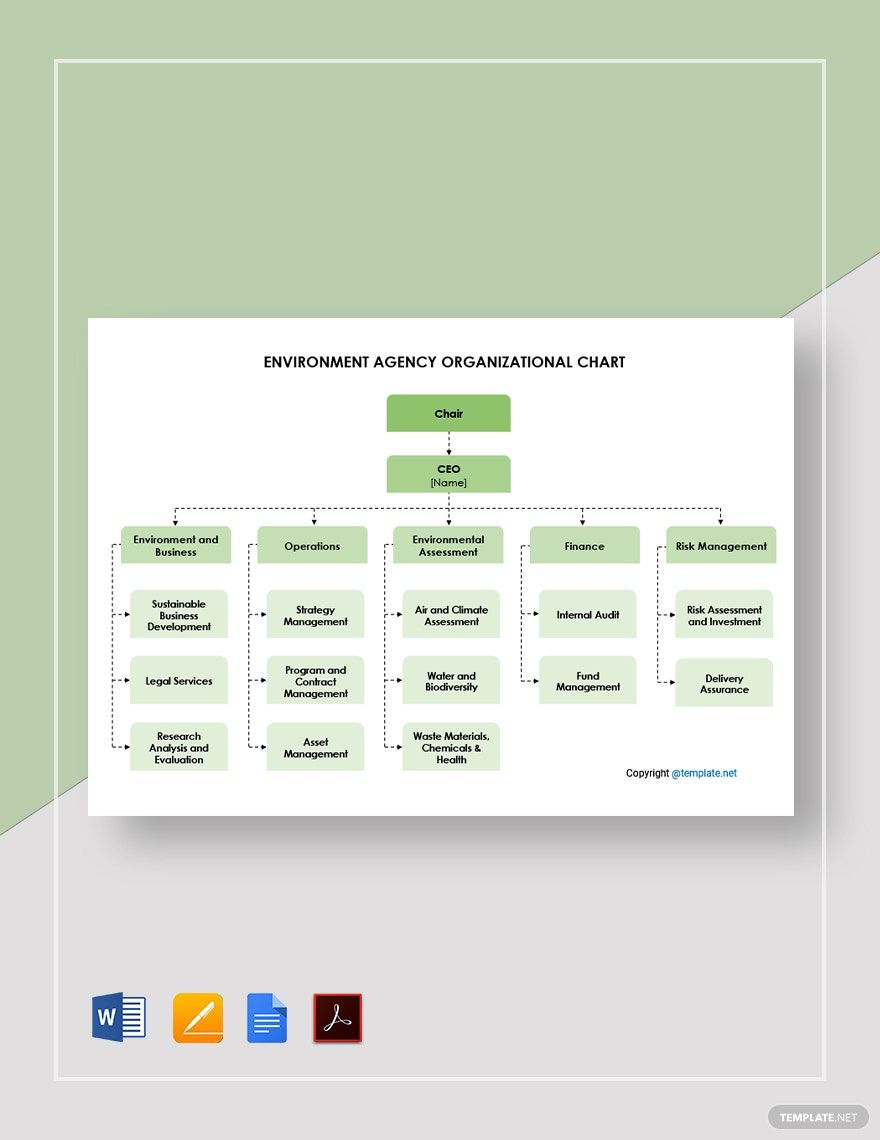
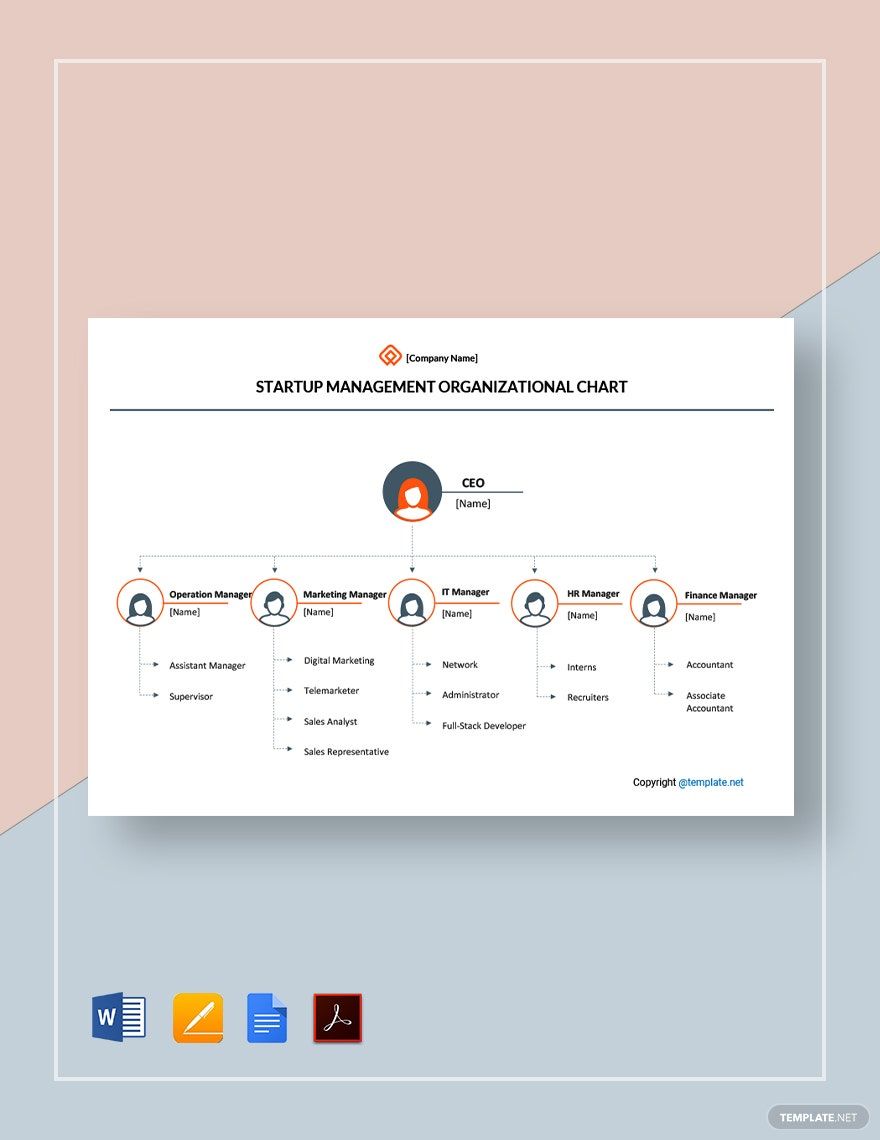
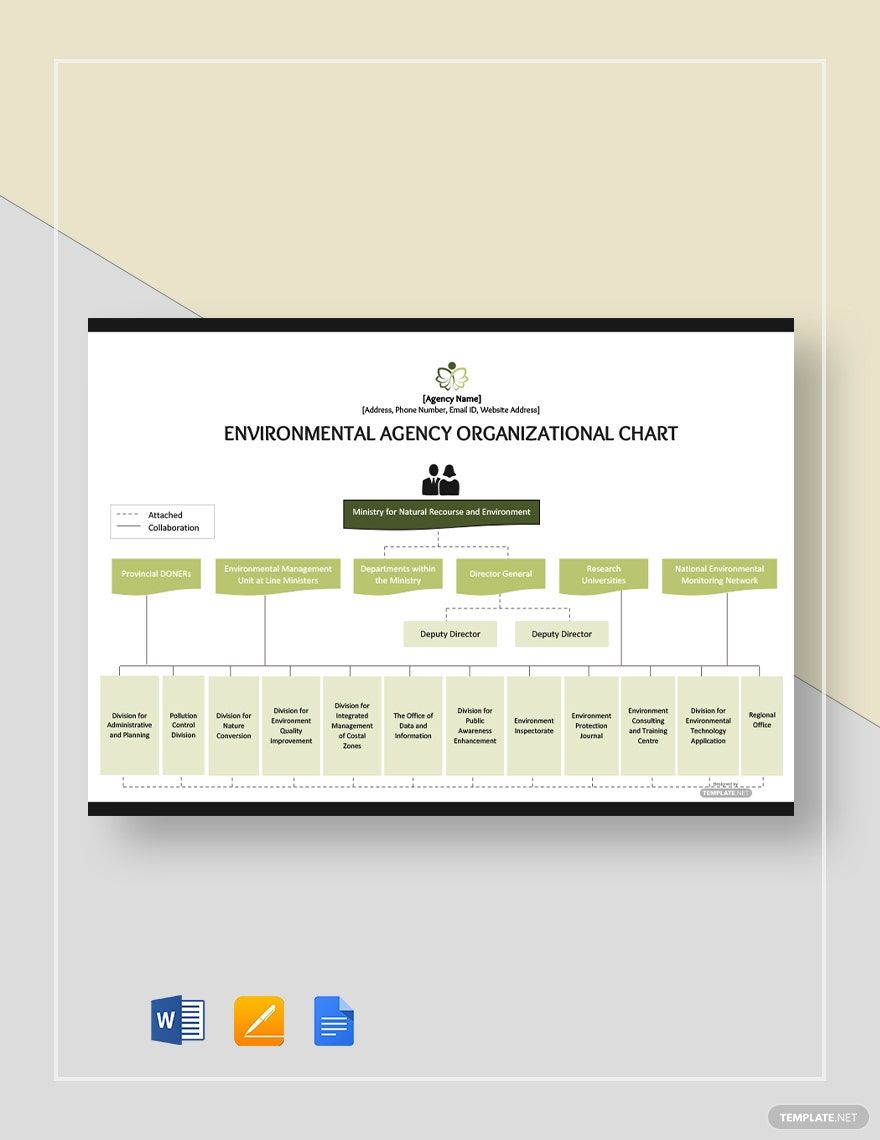
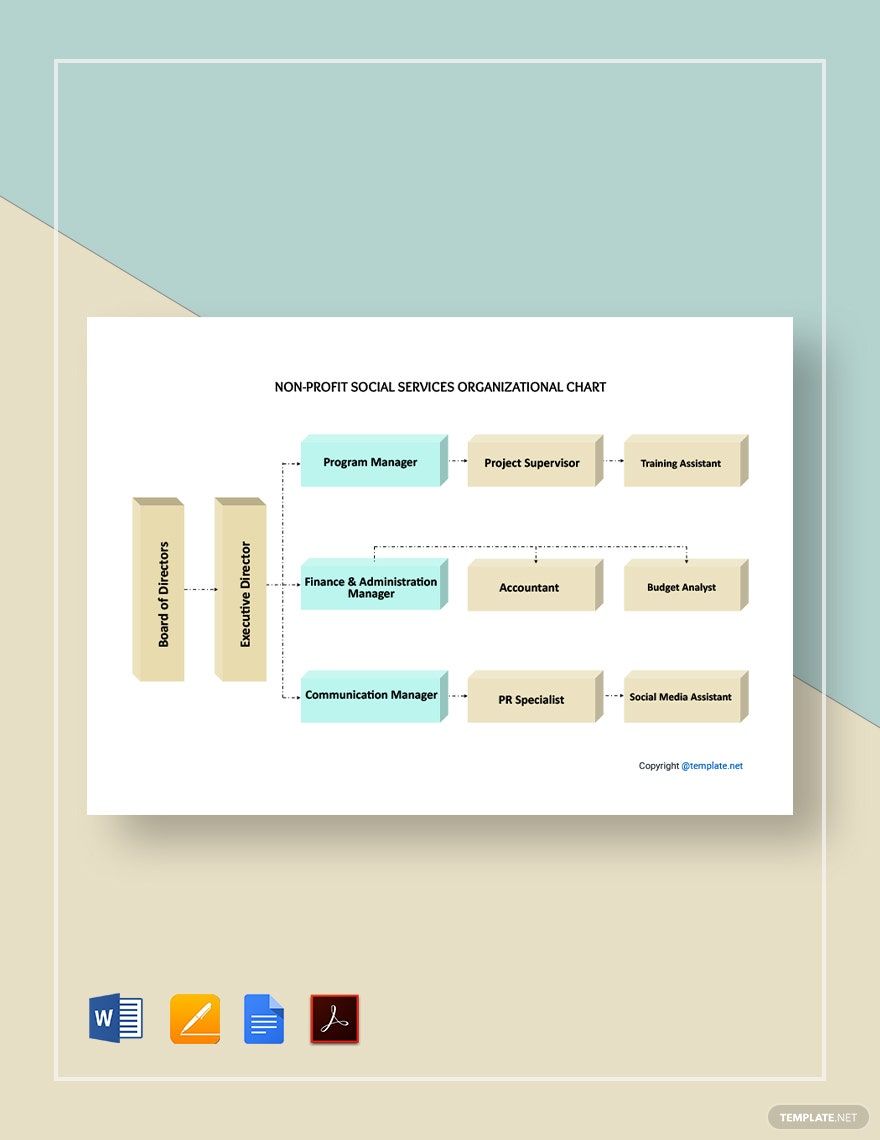
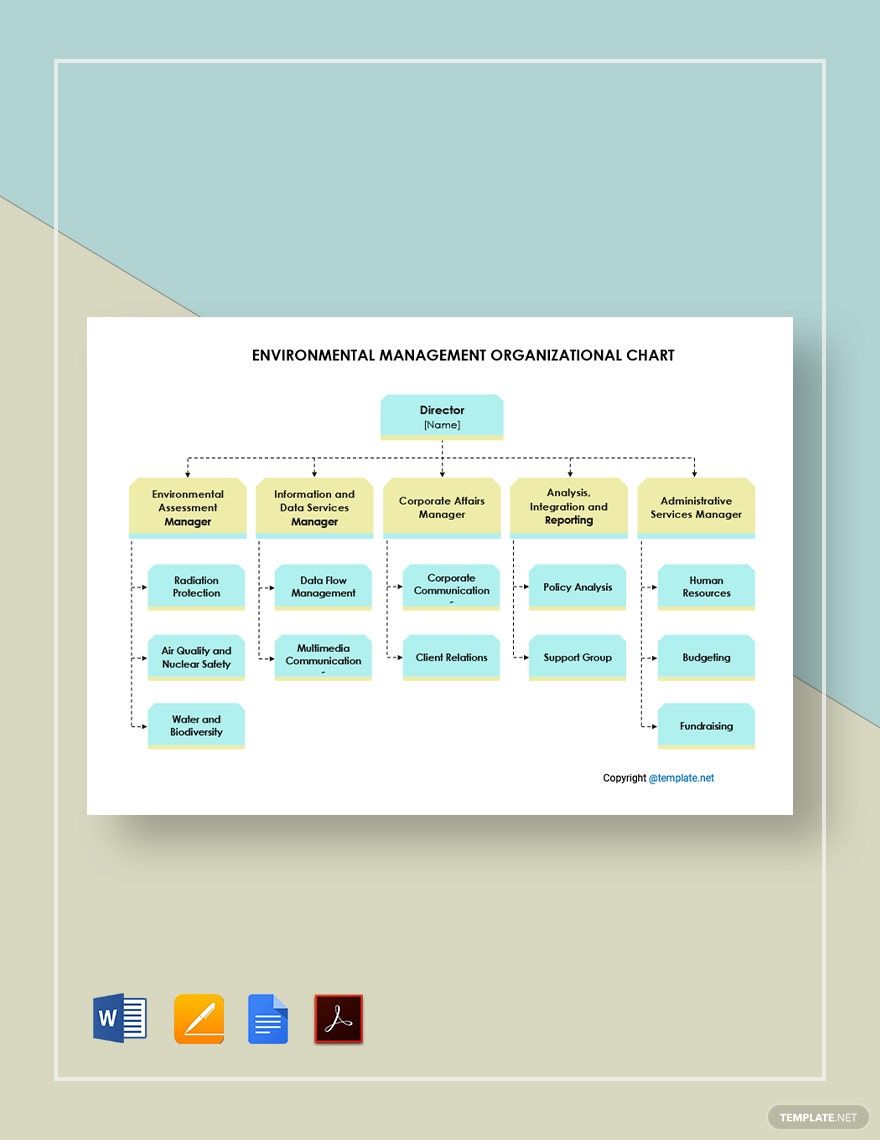
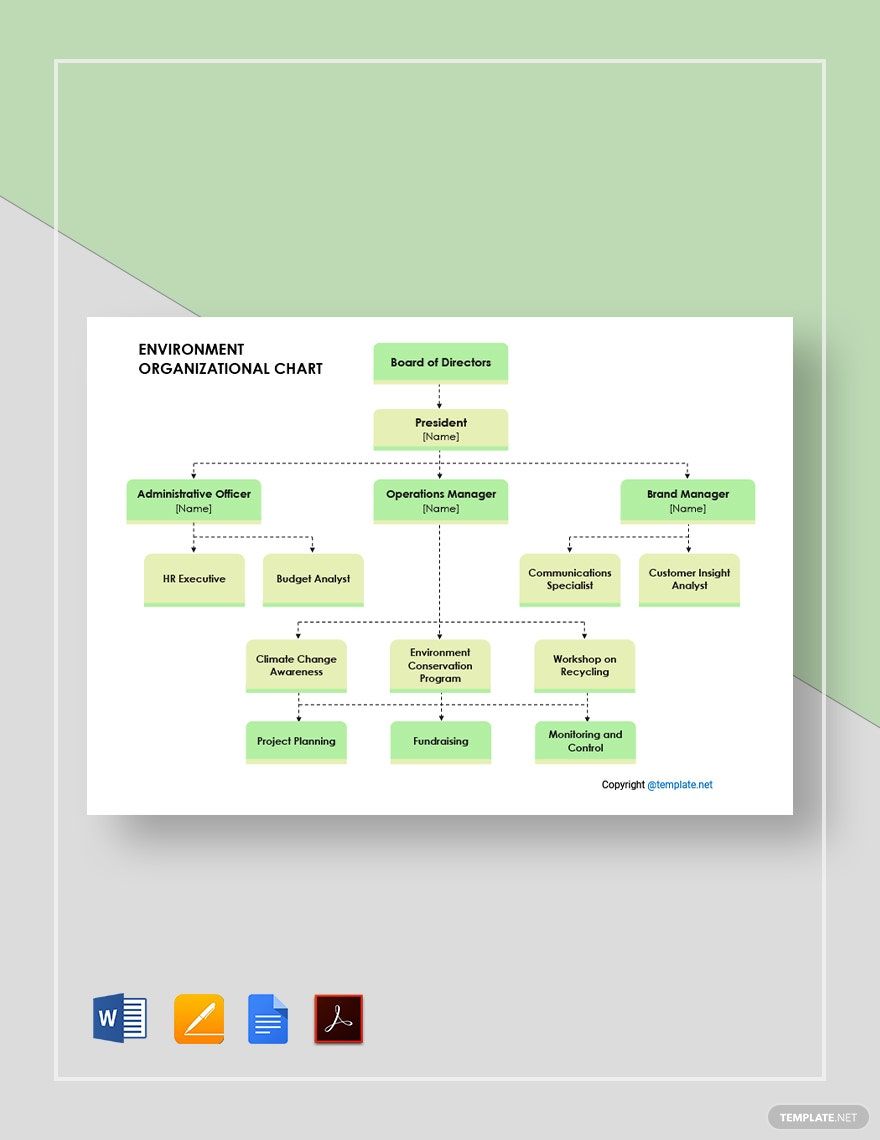
Are you trying to develop an organizational chart for your environmental agency? Fret no more. We got your back! We have a good number of Organizational Chart Templates that can help structure and illustrate the relation and hierarchy of command within the organization that you run. They are printable and 100% customizable. Best of all, you can download all of these for free. Available in A4 and US letter sizes and Microsoft Word and other file formats. So, why create from scratch and waste your precious time when you can use our templates below? Do your self a favor and pick from one of our chart templates now!
How To Create an Environment Organizational Chart in MS Word
It's evident how the environment has changed since the first Earth Day. In the past, our ecosystem was thriving. But that's not the case now. Pollution and the wrongdoings of humans resulted in a climate emergency, global warming, etc. As the climate worsens, safety and environmental concern from humans increases, prompting the creation of environmental agencies. According to National Geographic, the Environmental Protection Agency has 48 environmental accomplishments since the first Earth Day.
As an agency whose aim is to protect the environment and provide environmental education to people, it's crucial that you have a well-structured chart. A visual representation of the hierarchy of people and positions significantly affects how these people perform their work within the agency. This also ensures that goals and targets are met.
To guide you in creating an organizational chart for your agency, take a look at the steps below.
1. Identifying the Purpose and Goals
Start by understanding the purpose and goals of the agency. The chart you are going to create should reflect the agency, so be sure you are aware of their views and mission.
2. Gathering the Data
To create a comprehensive and simple chart, you need to collect all the essential data. Jot down all the key players and personnel working in the agency. Input their position and titles beside their names. Jot them down in hierarchical order, so it's easy for you to create and arrange the chart later on.
3. Deciding on a Structure
After gathering the data, your next step is to decide on a structure. You can structure your chart into three different ways; vertically, horizontally, or both vertically and horizontally. The most commonly used structure is the vertical org chart structure. The only problem with this is it makes your chart look longer. So avoid using this when there are too many positions and names in your line-up. The best choice would be a combination of both vertical and horizontal structures.
4. Graphing and Designing the Chart
An organizational chart and a flow chart have similarities, so think of flow charts when graphing. Since you listed all the necessary information in a hierarchical order, graphing your chart is easy. For the design, choose basic shapes and colors. Remember, the background color should be in darker shade compared to the font color. You may add in some designs if you want, but not too much. A basic chart is enough as long as it's well-structured and all the information is there. Don't forget to include your logo.
5. Reviewing your Work
It is vital to review your work to avoid mistakes. Check each information that you've inputted. Make sure the position and names are spelled correctly. Proper labeling and correct spelling of names is a crucial part of an environment organizational chart. No one wants their name to be misspelled. Once you're finished, thoroughly check your work to make sure there are no more mistakes before publishing or printing out your chart. Post this inside the office for everyone to see.


