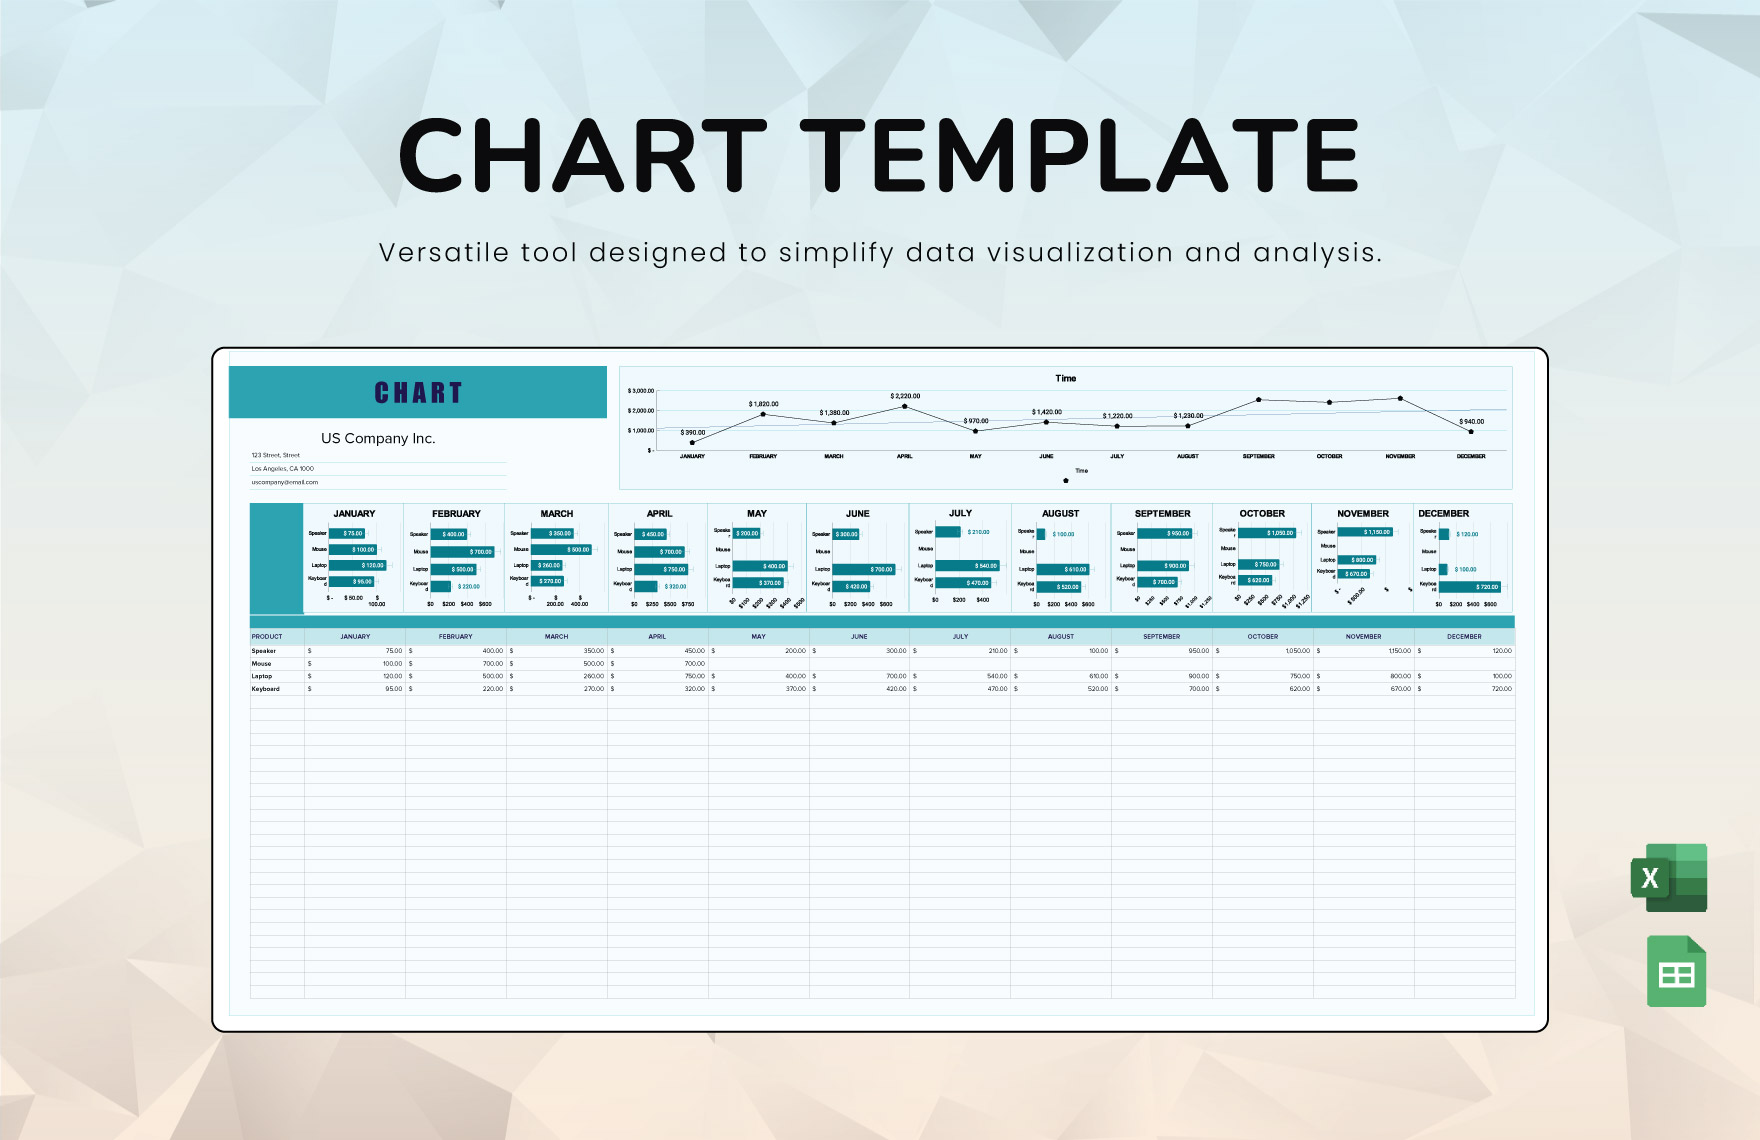
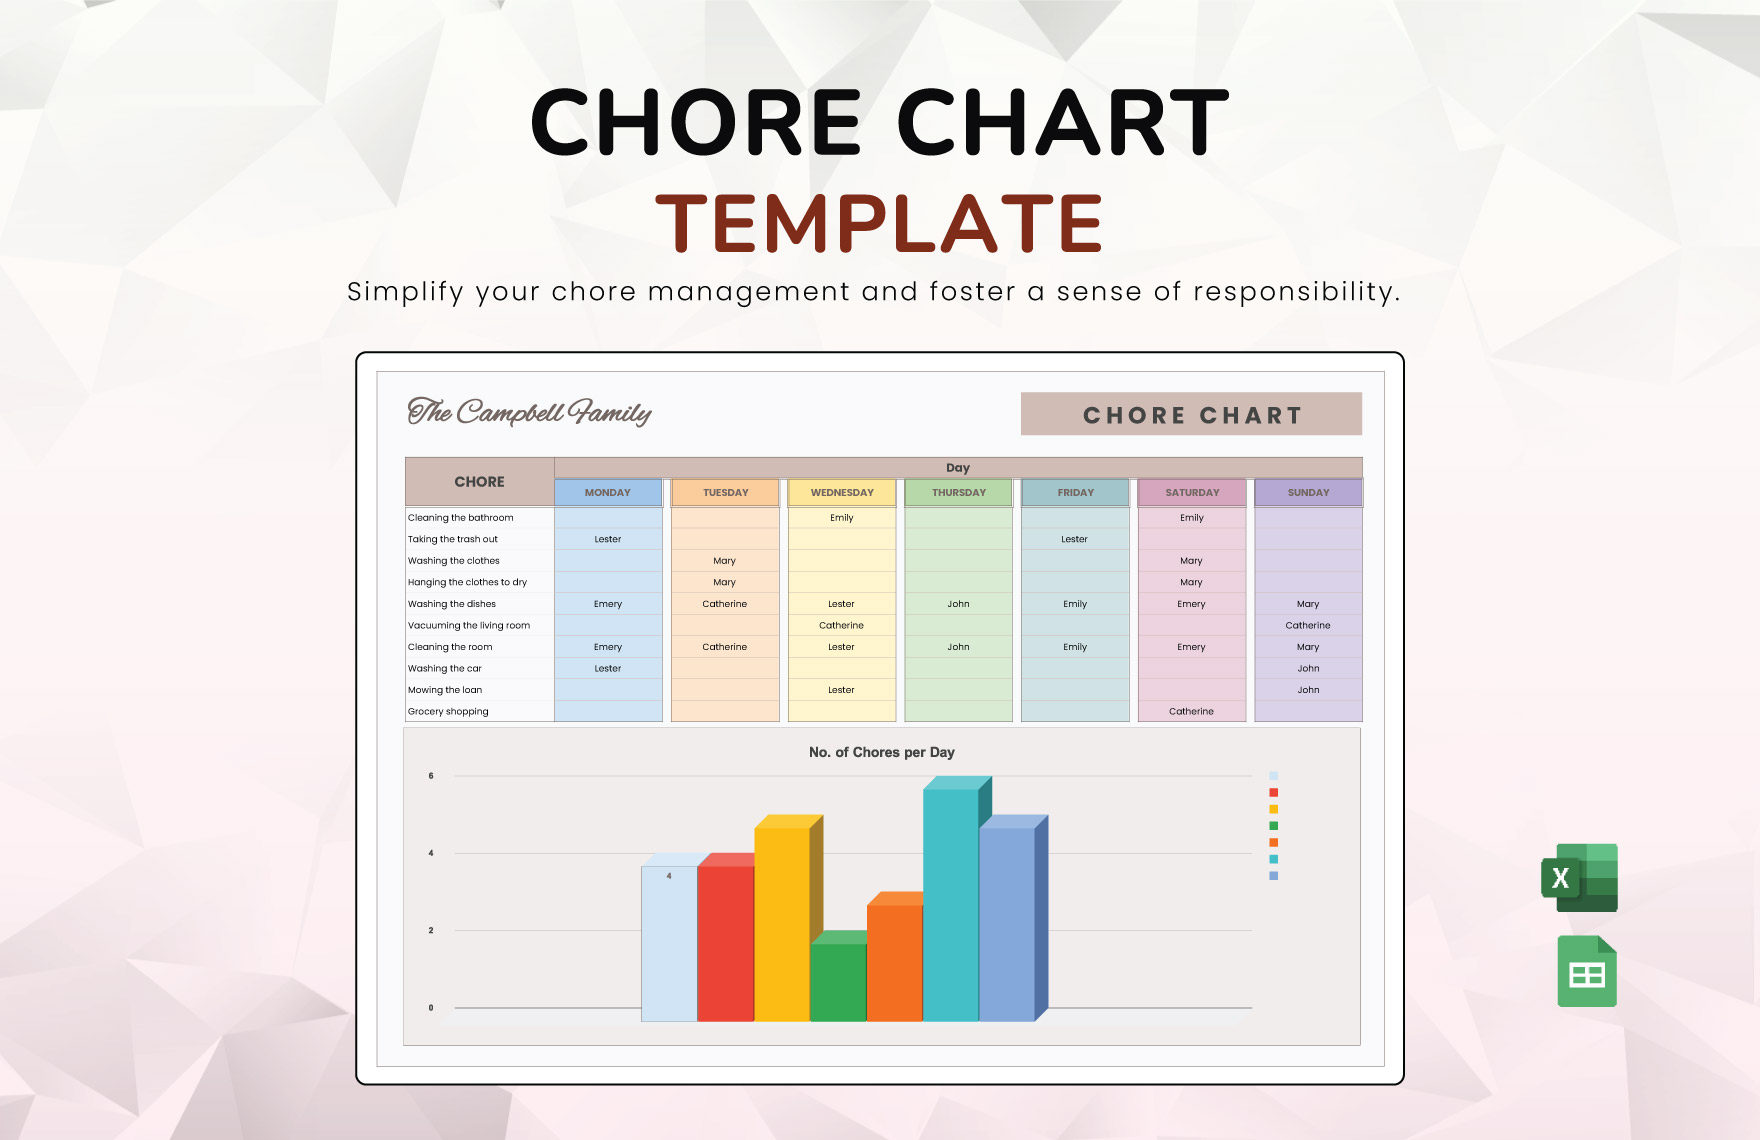
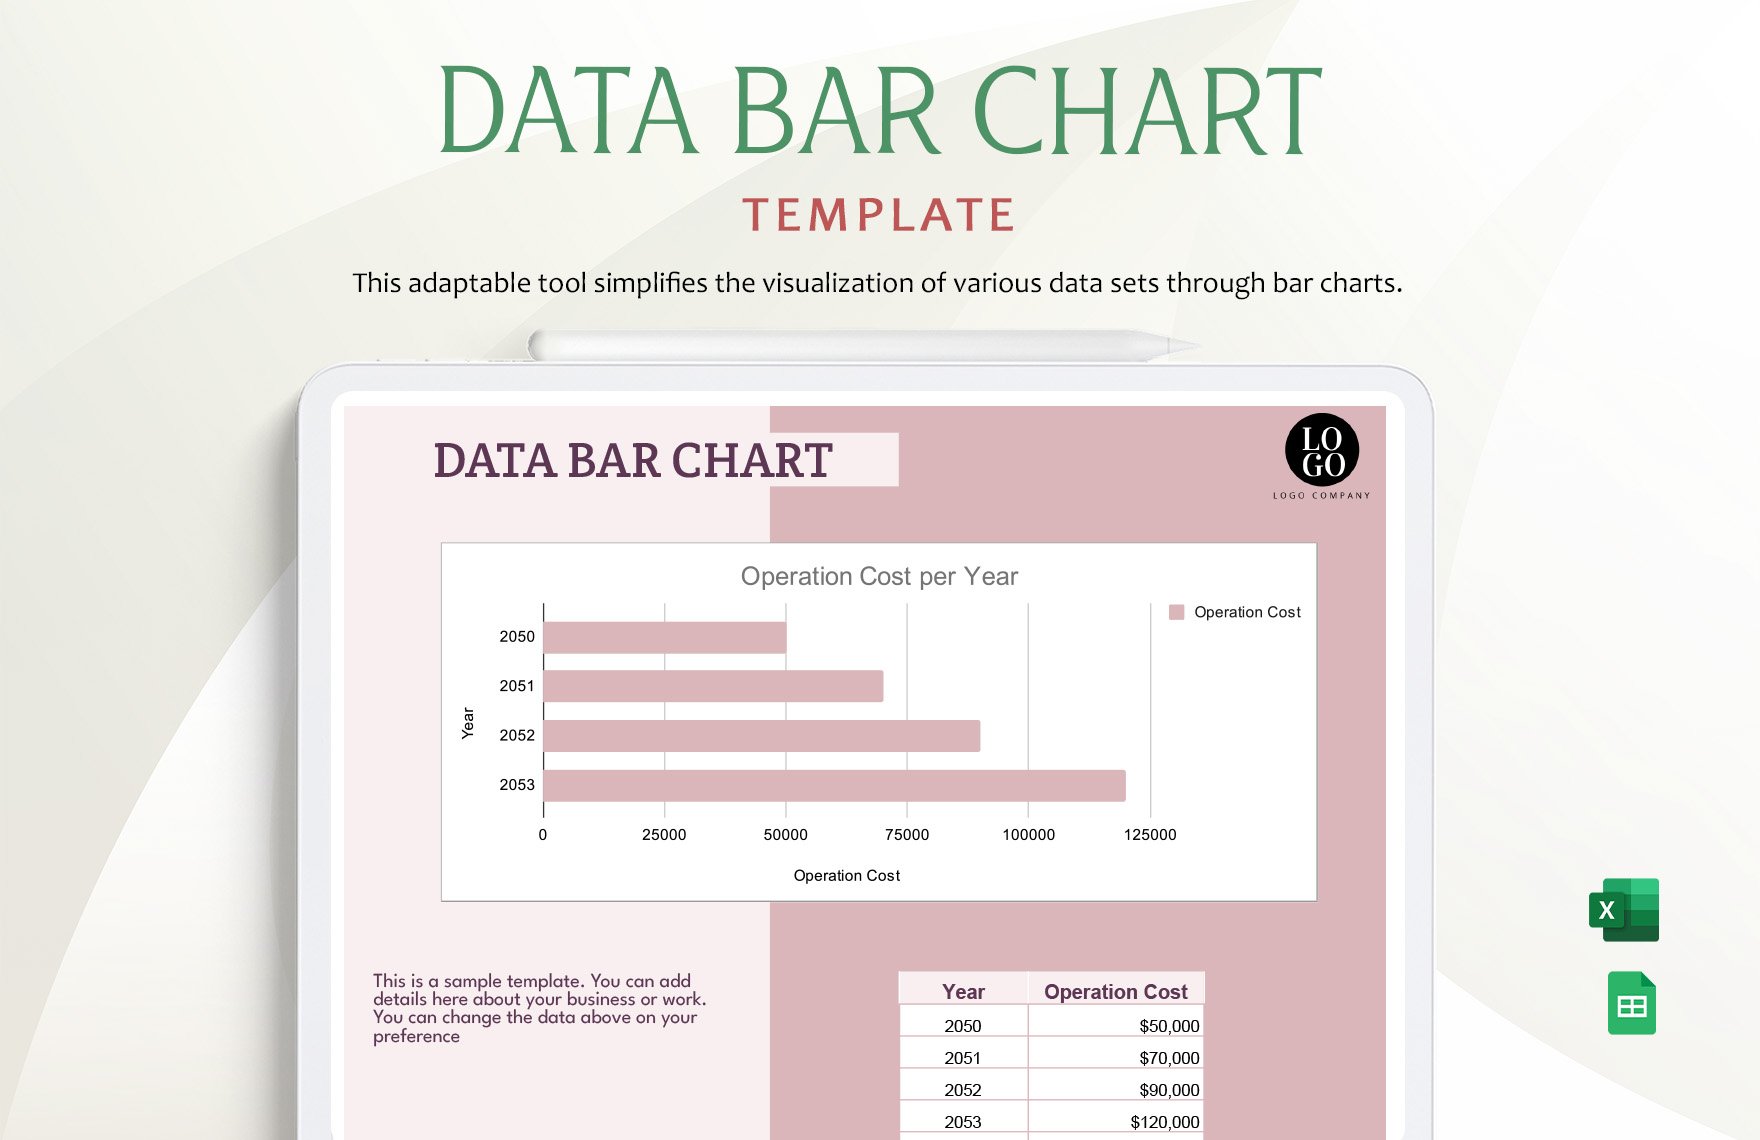
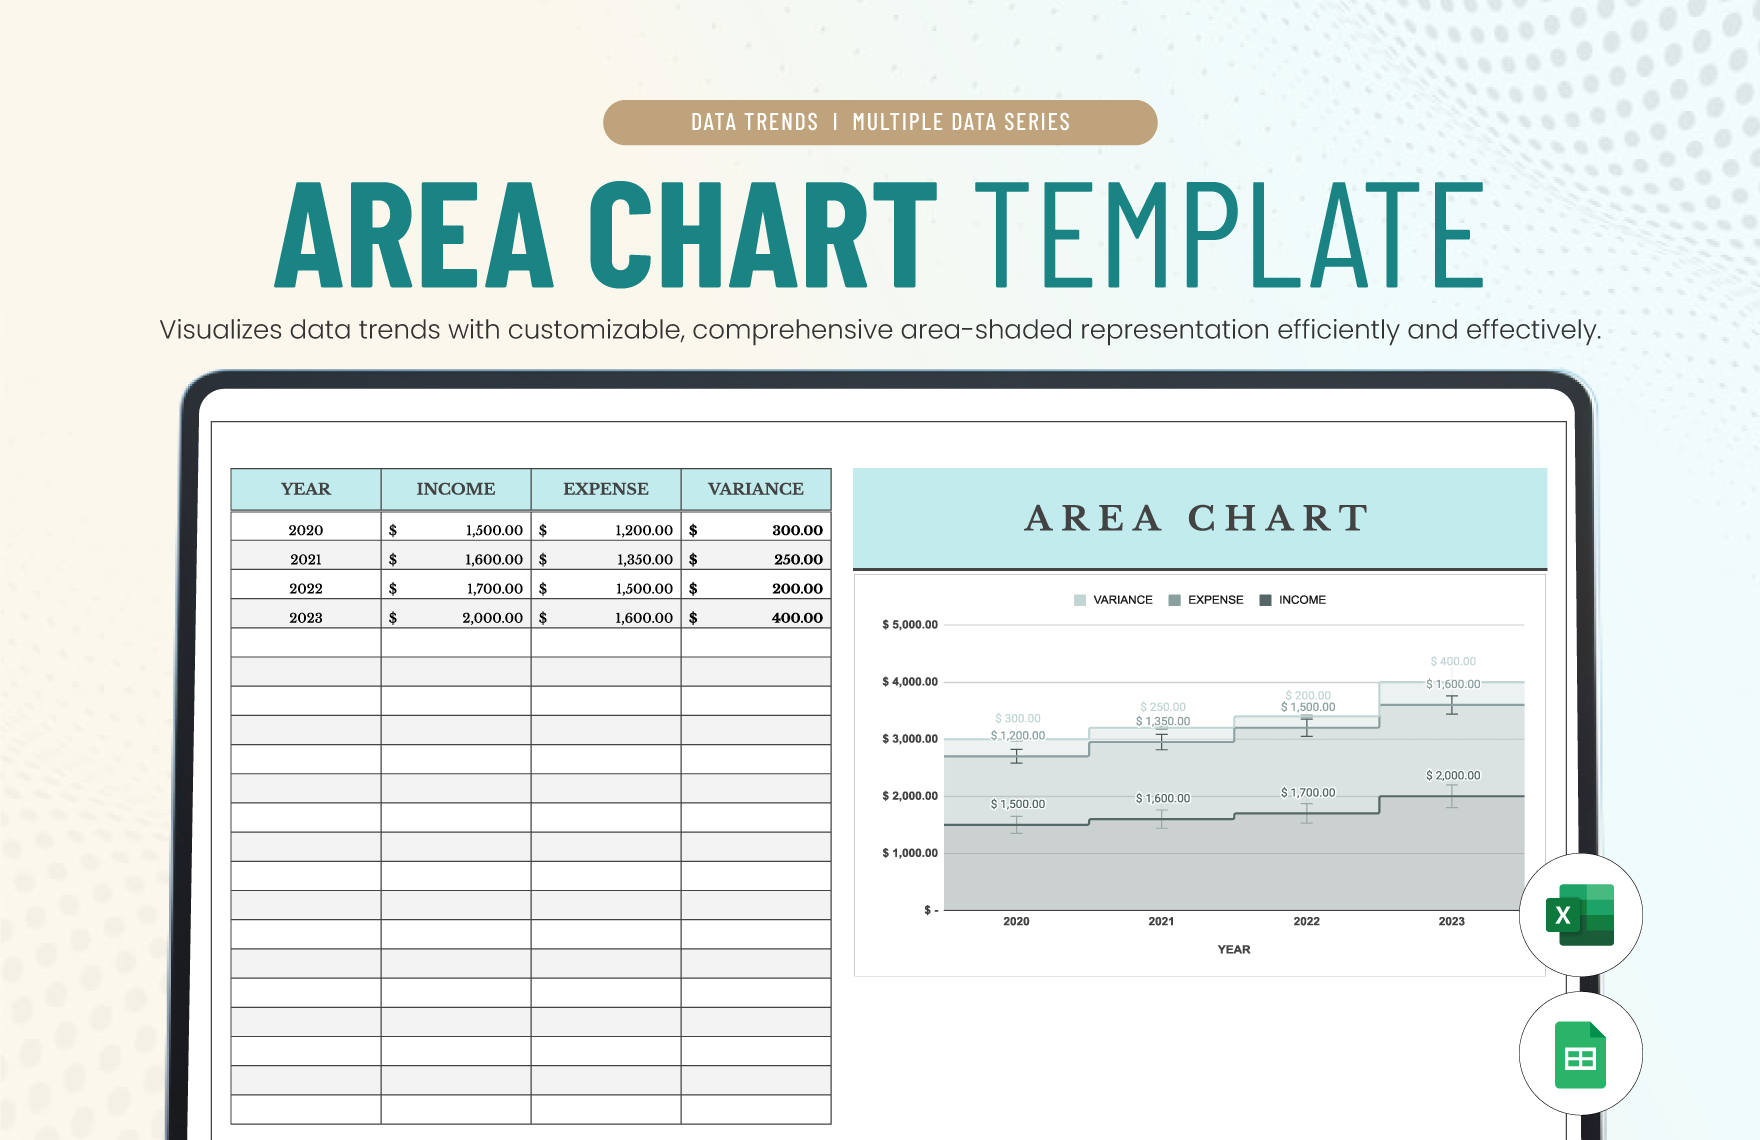
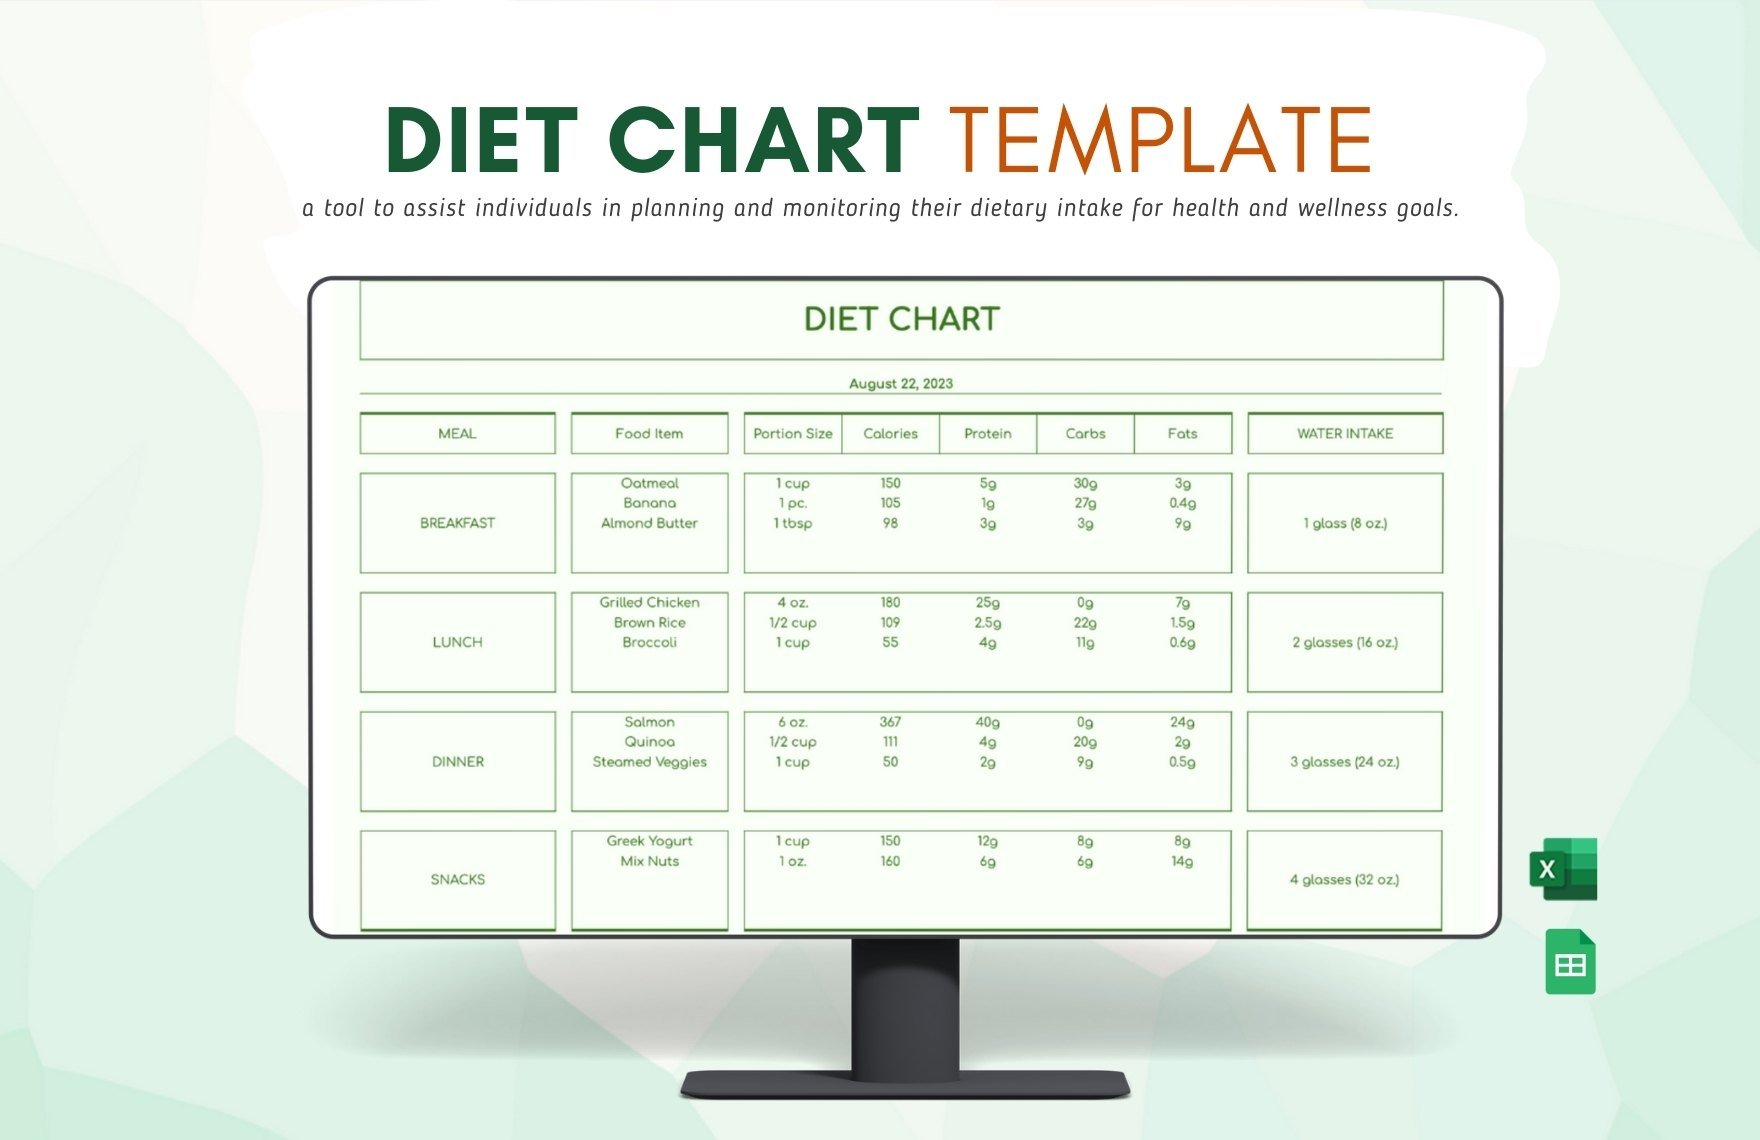
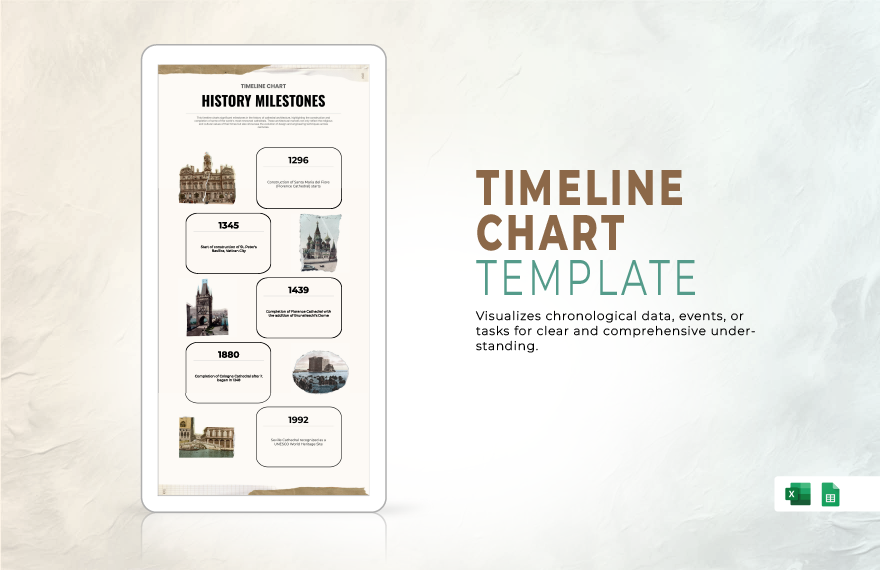
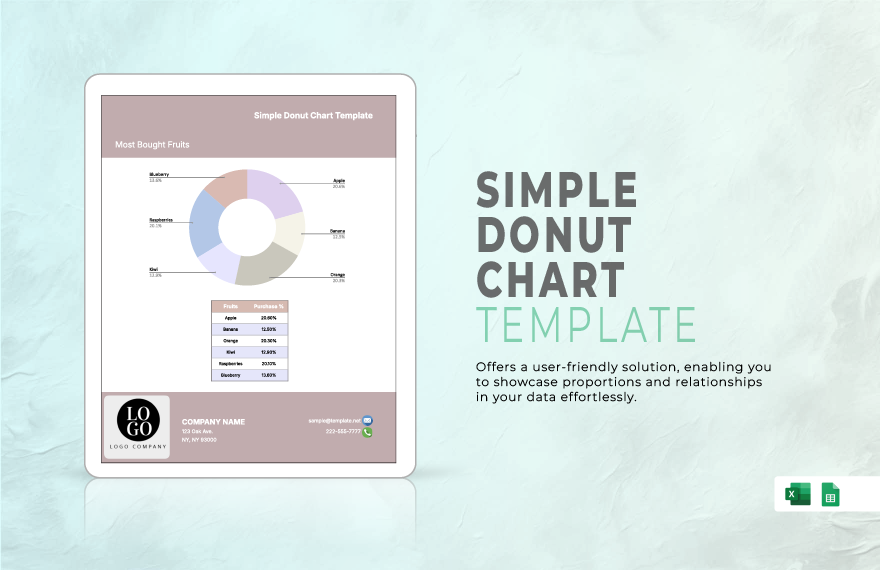
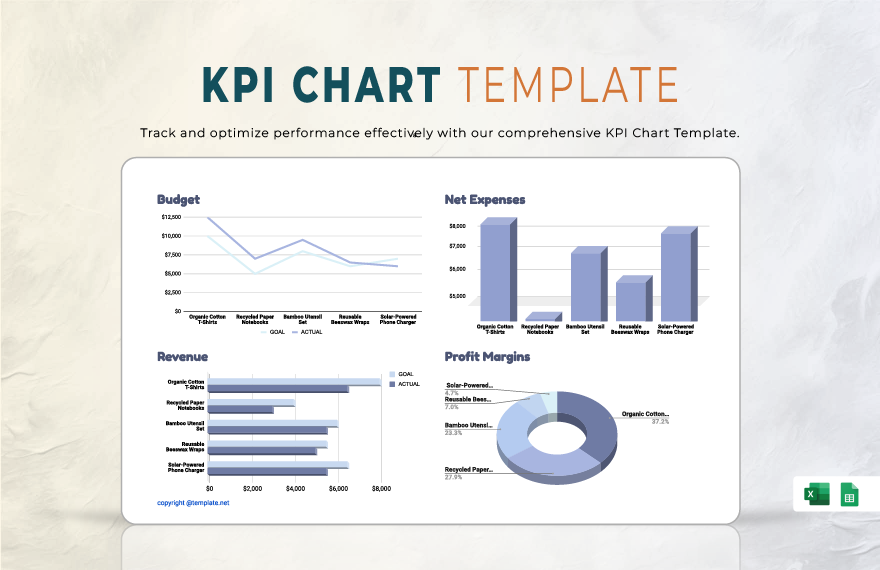
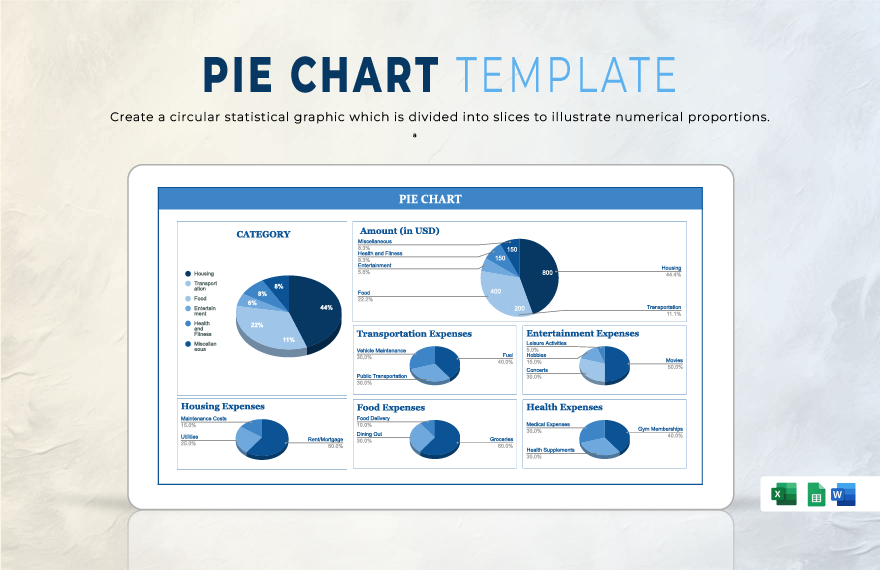
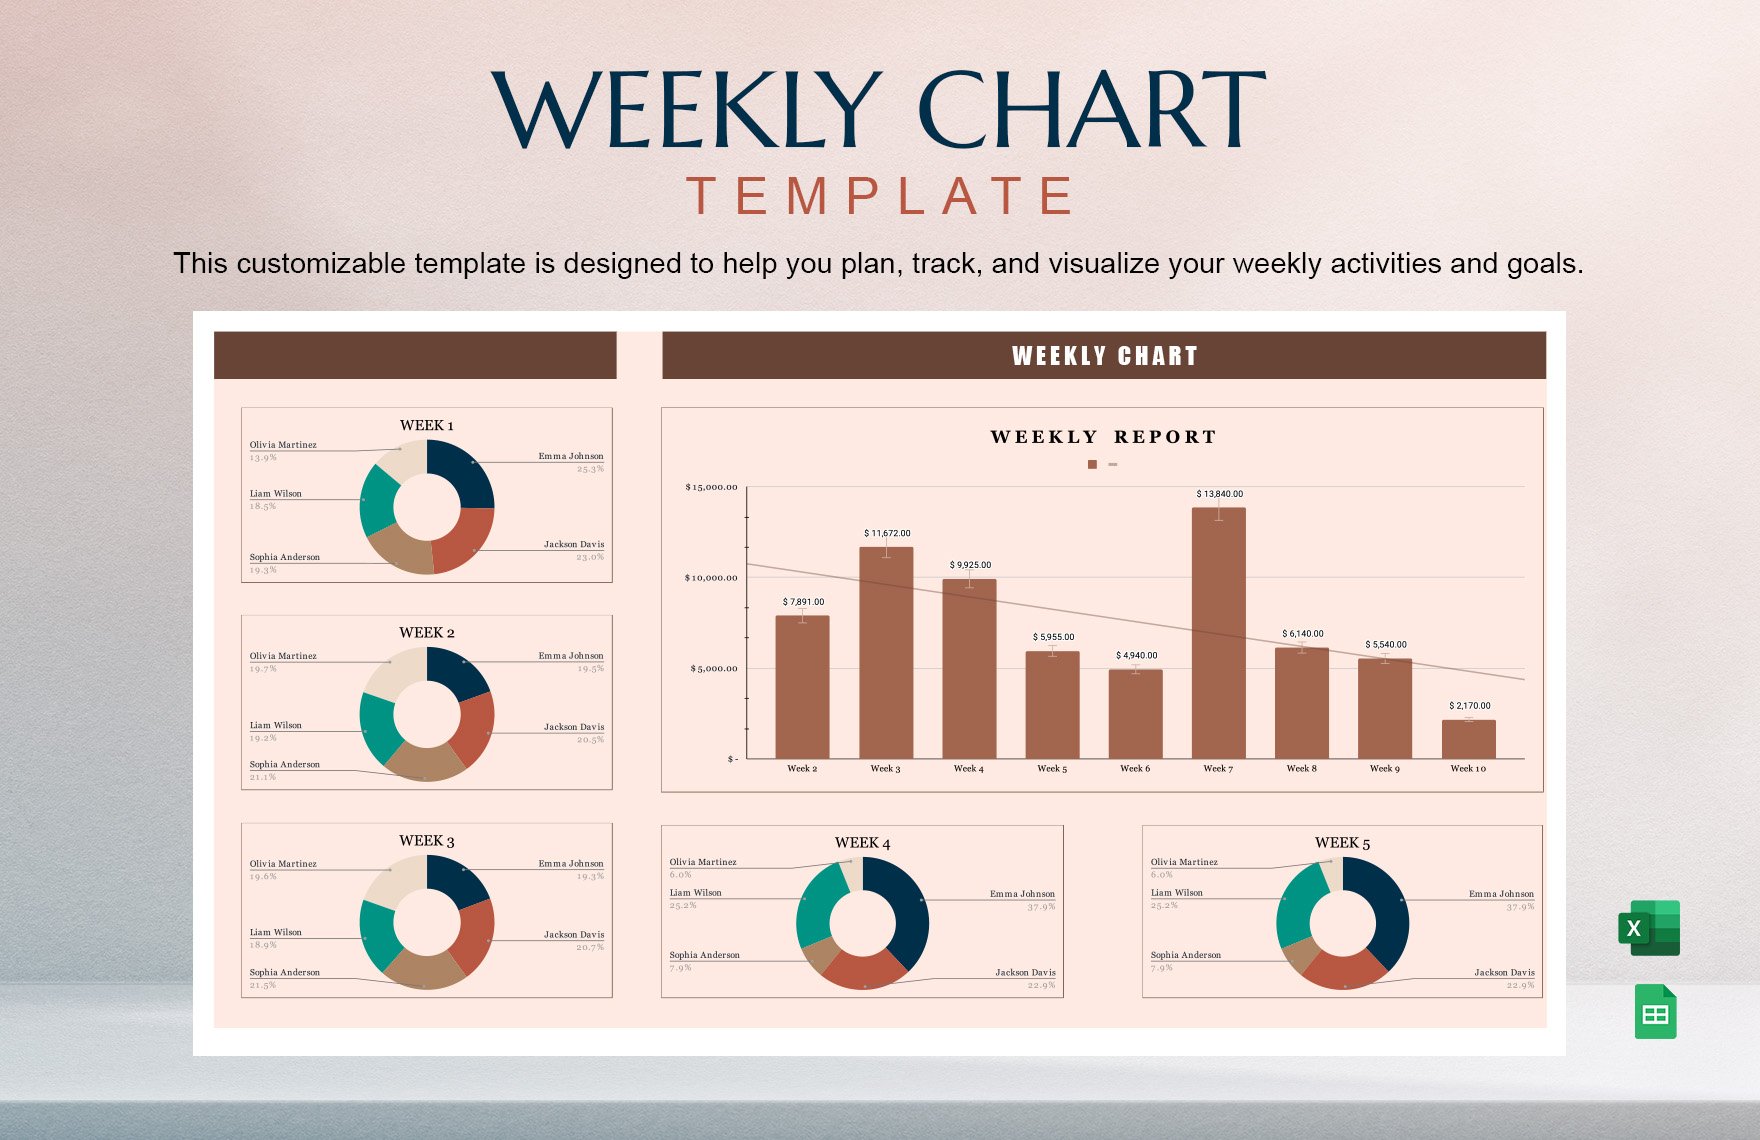
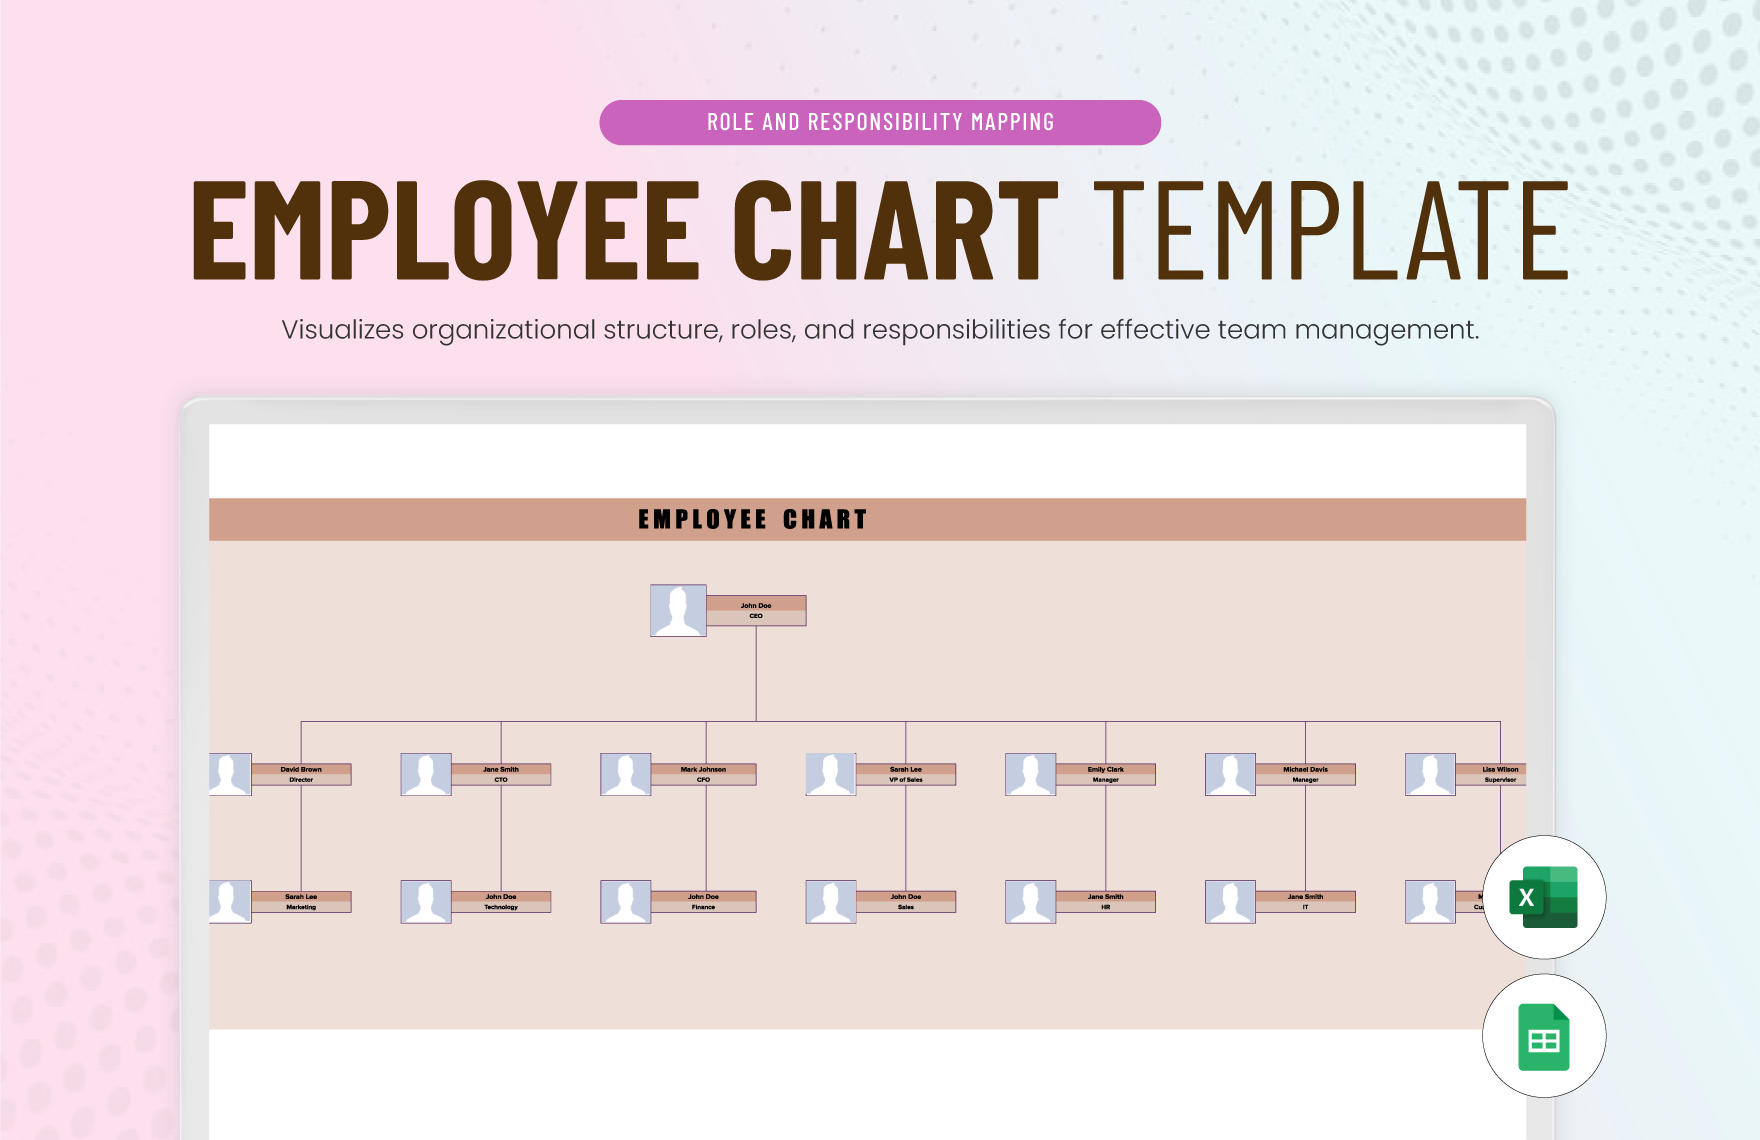
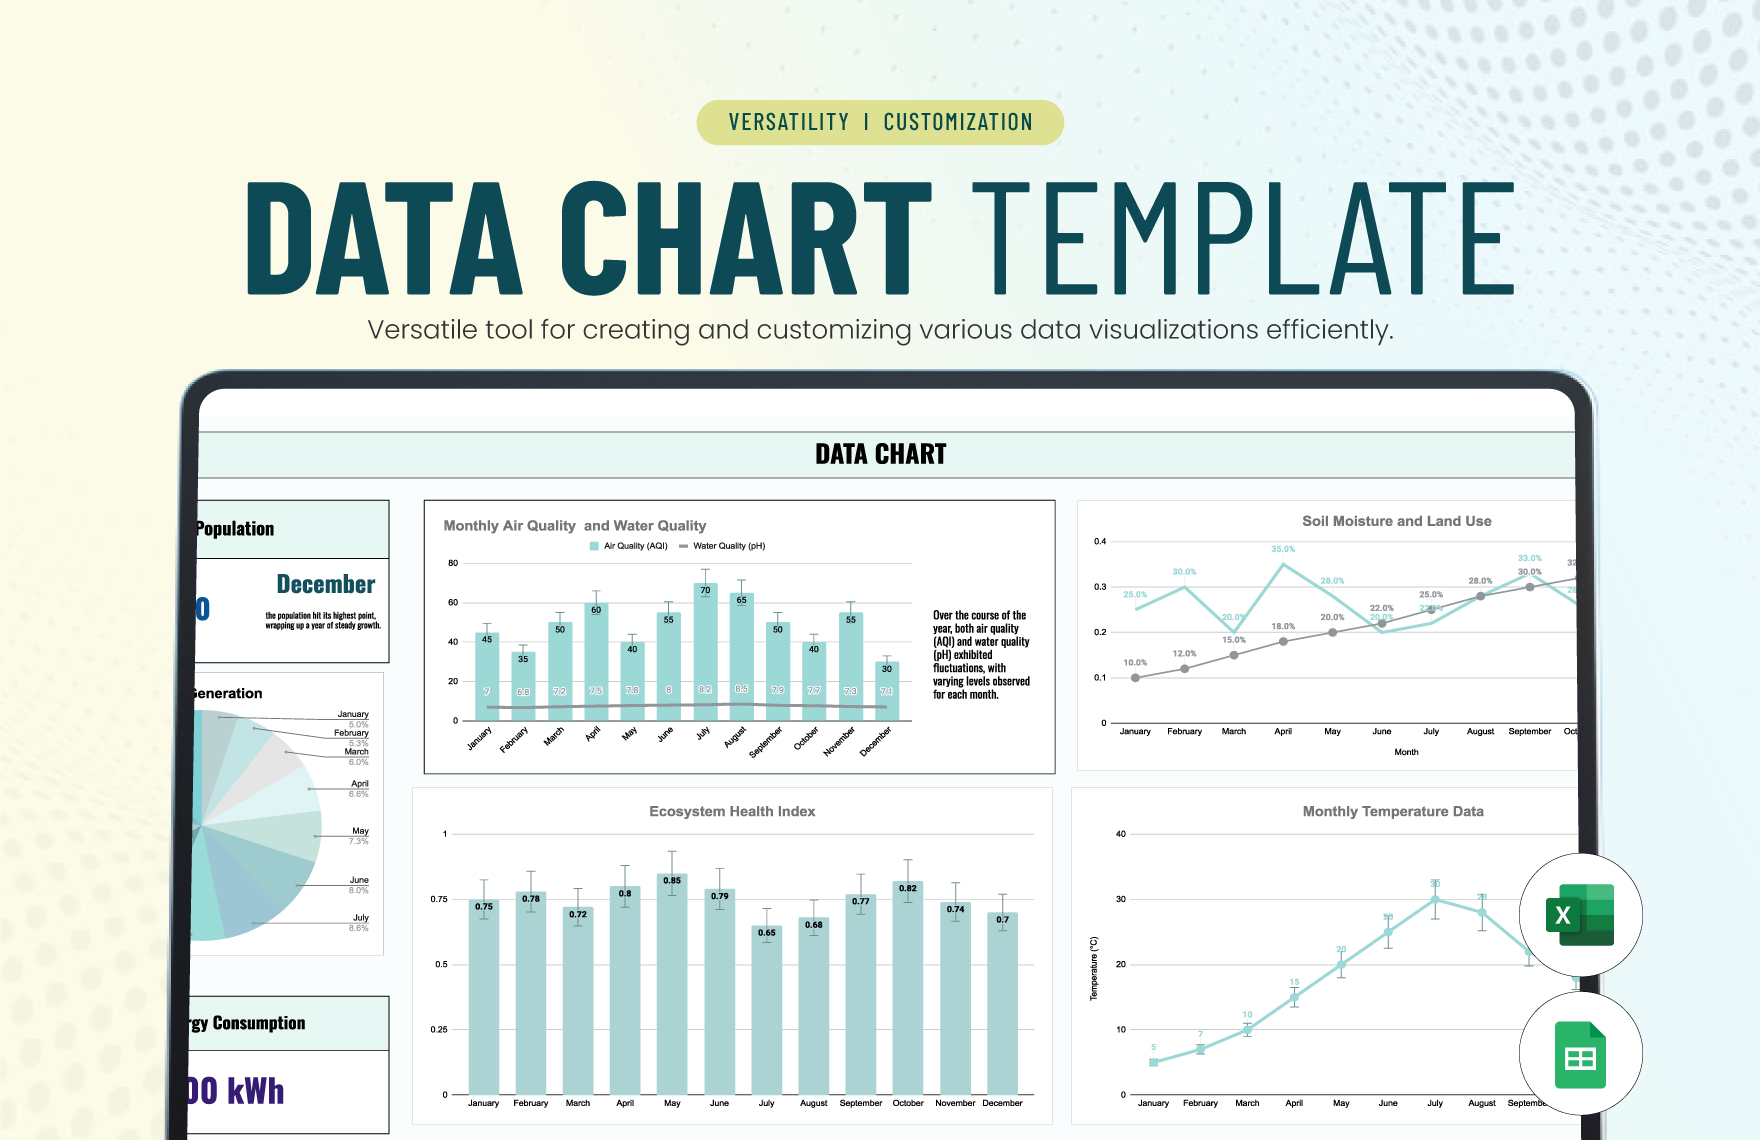
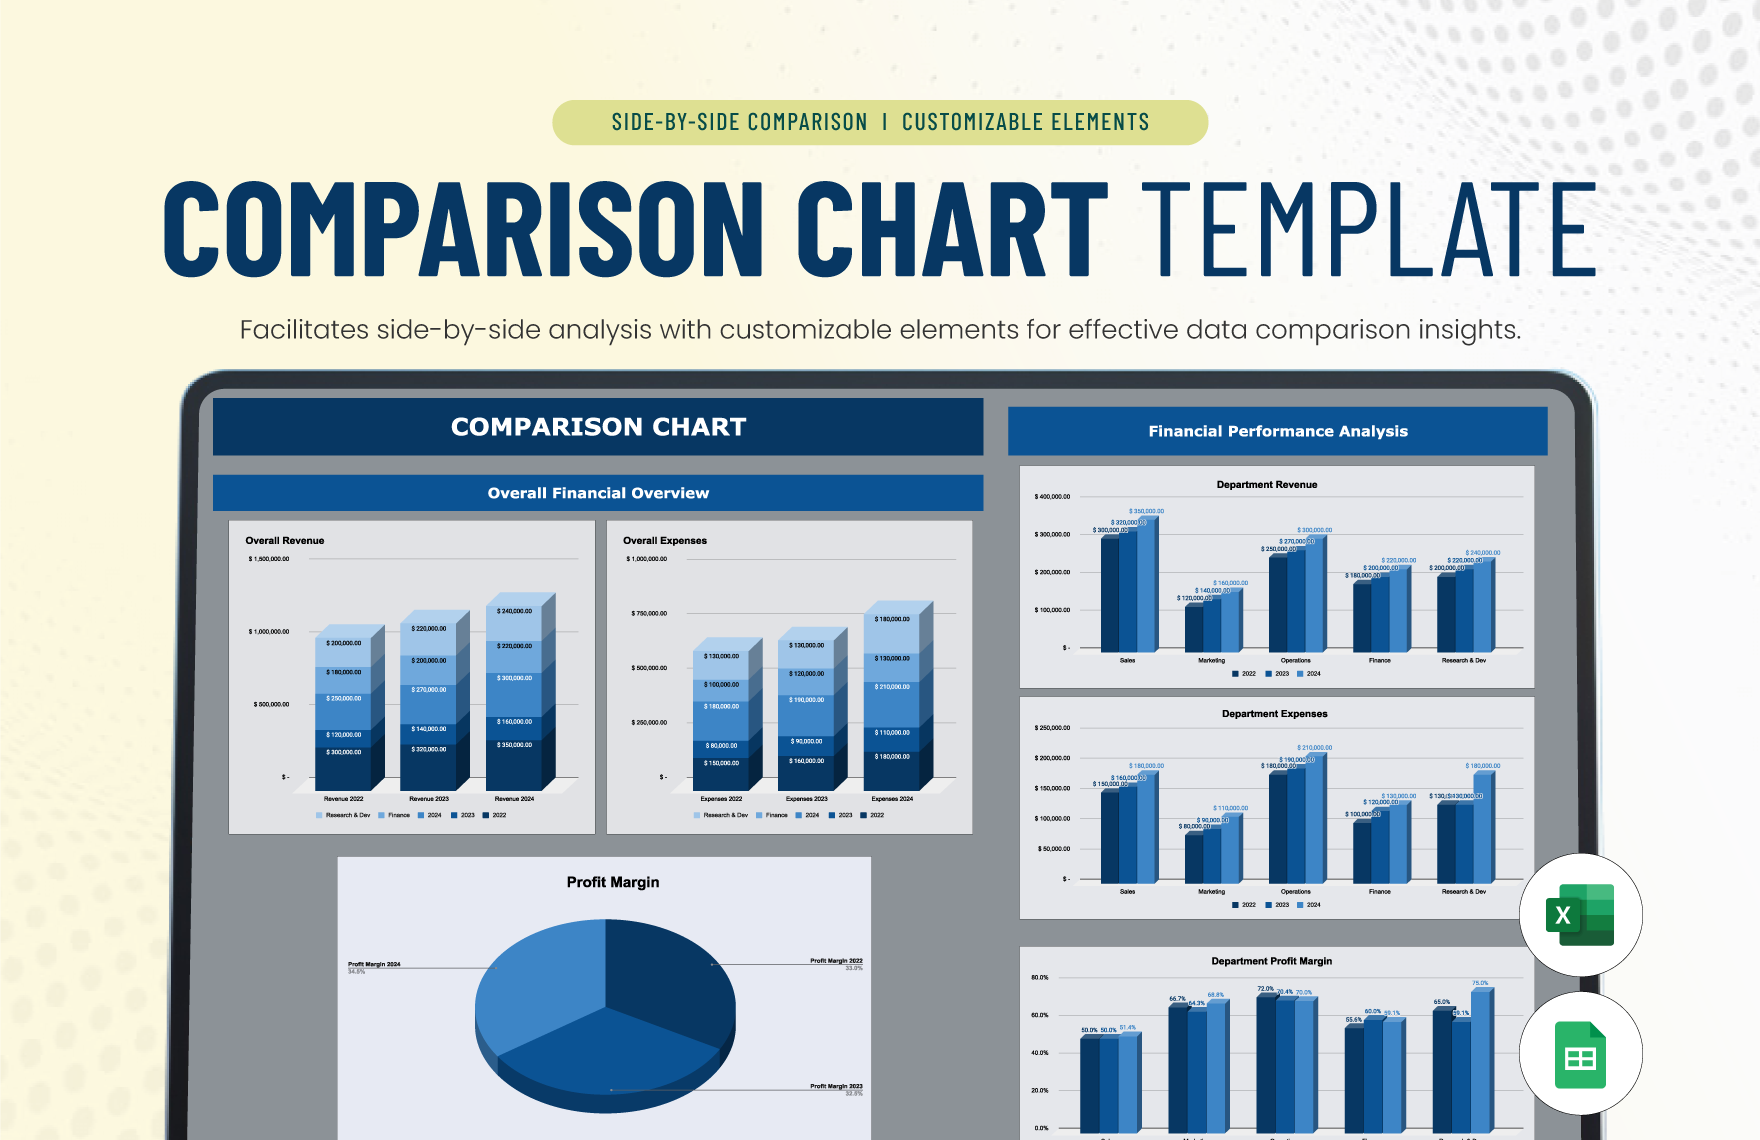
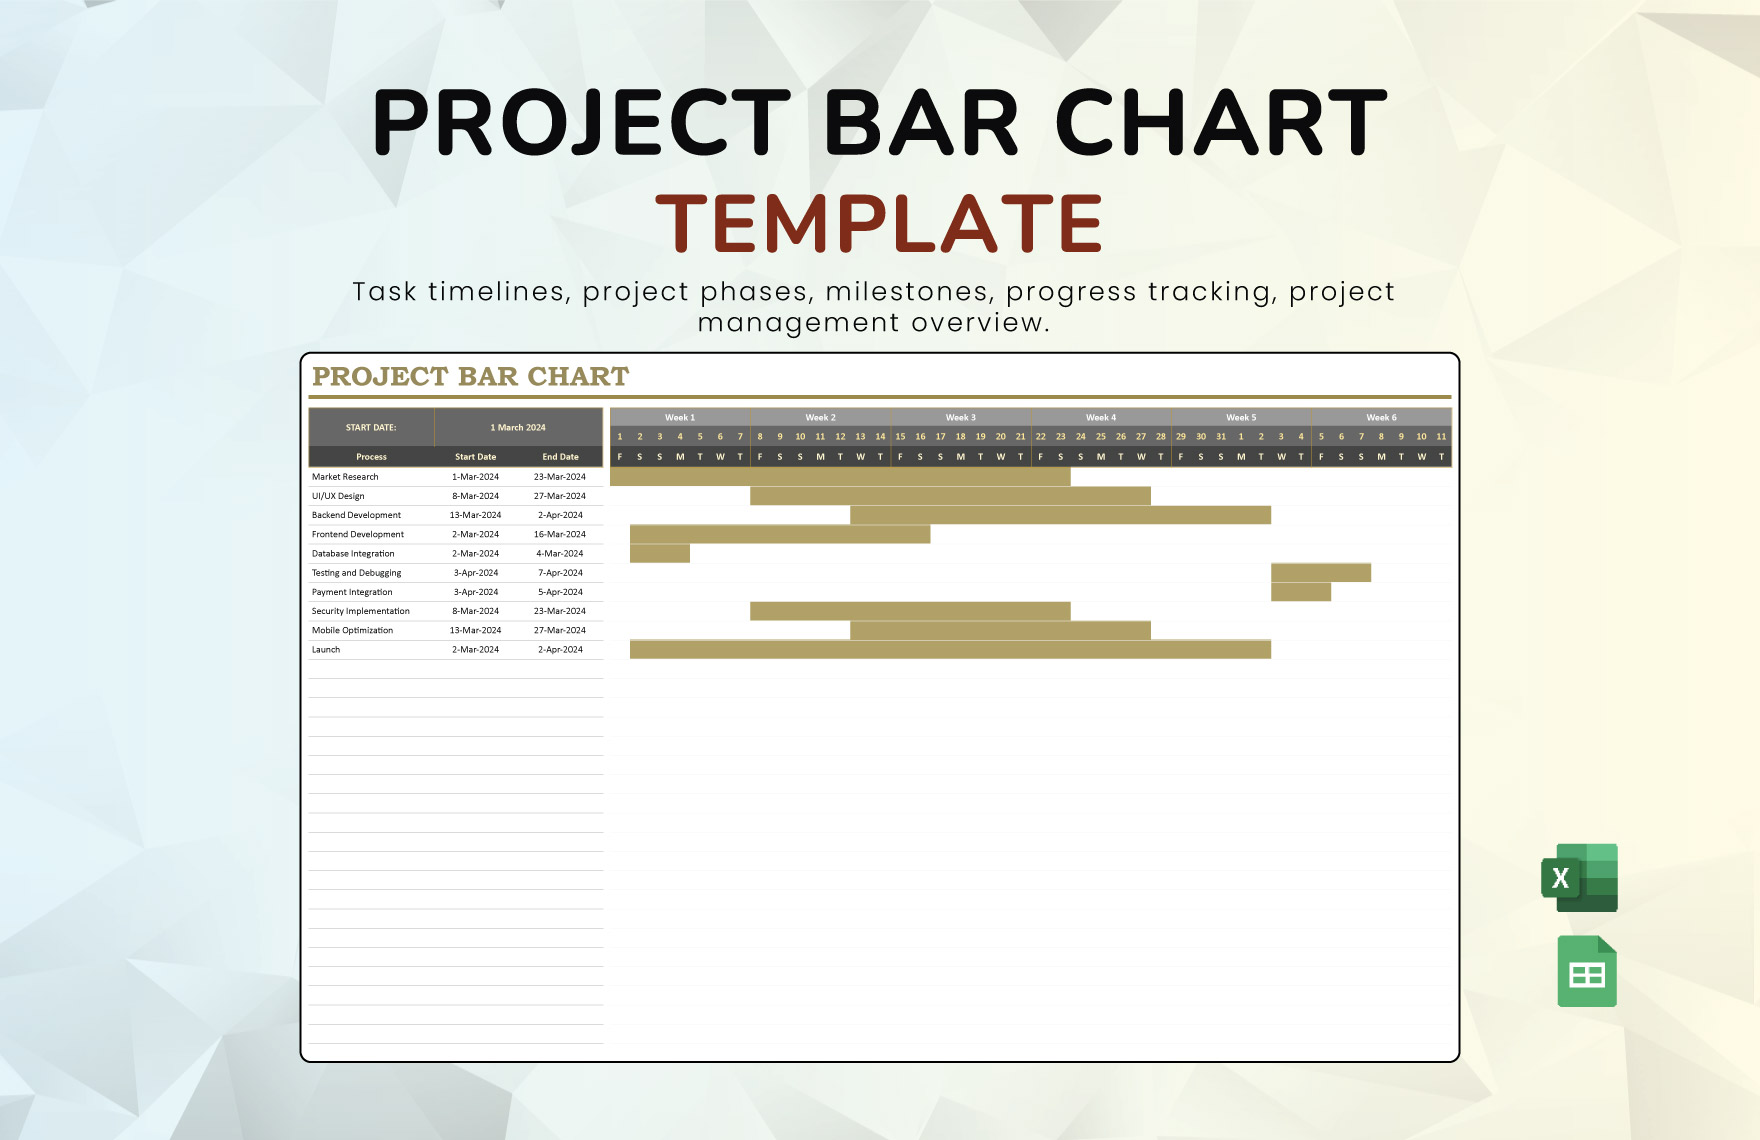
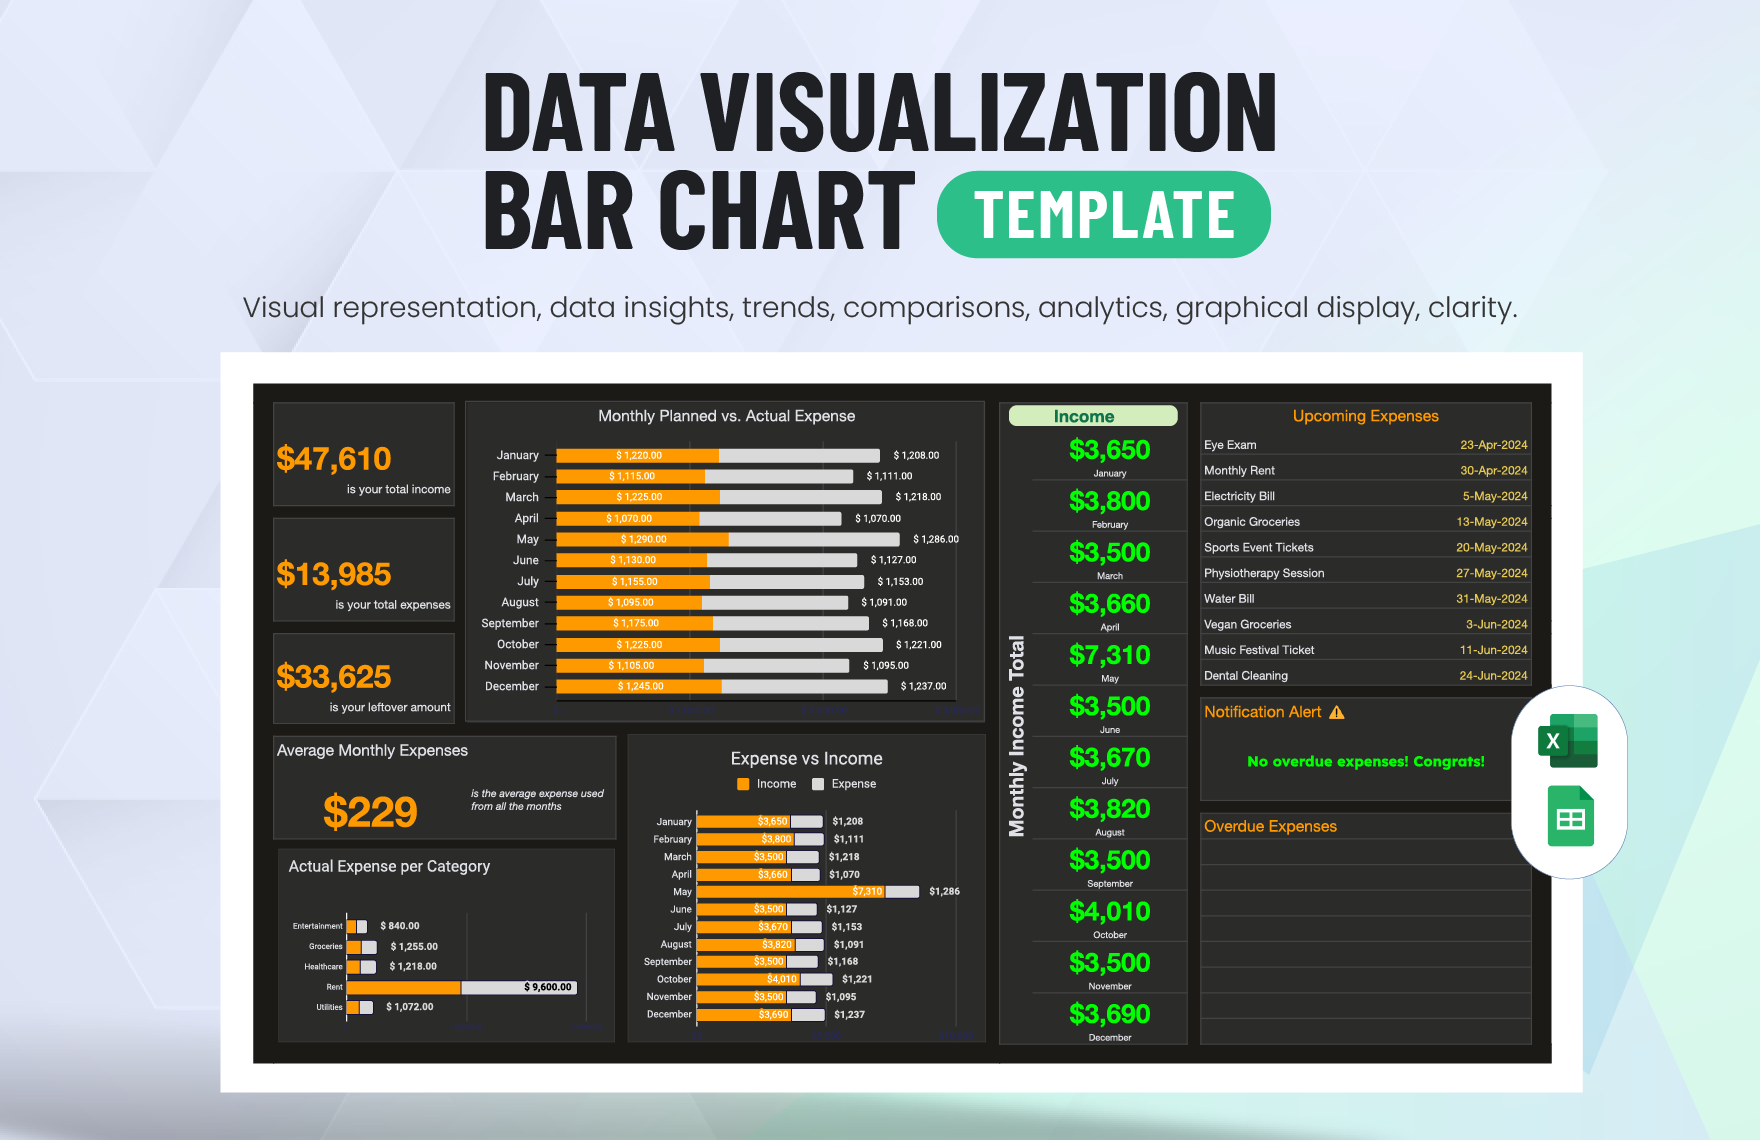
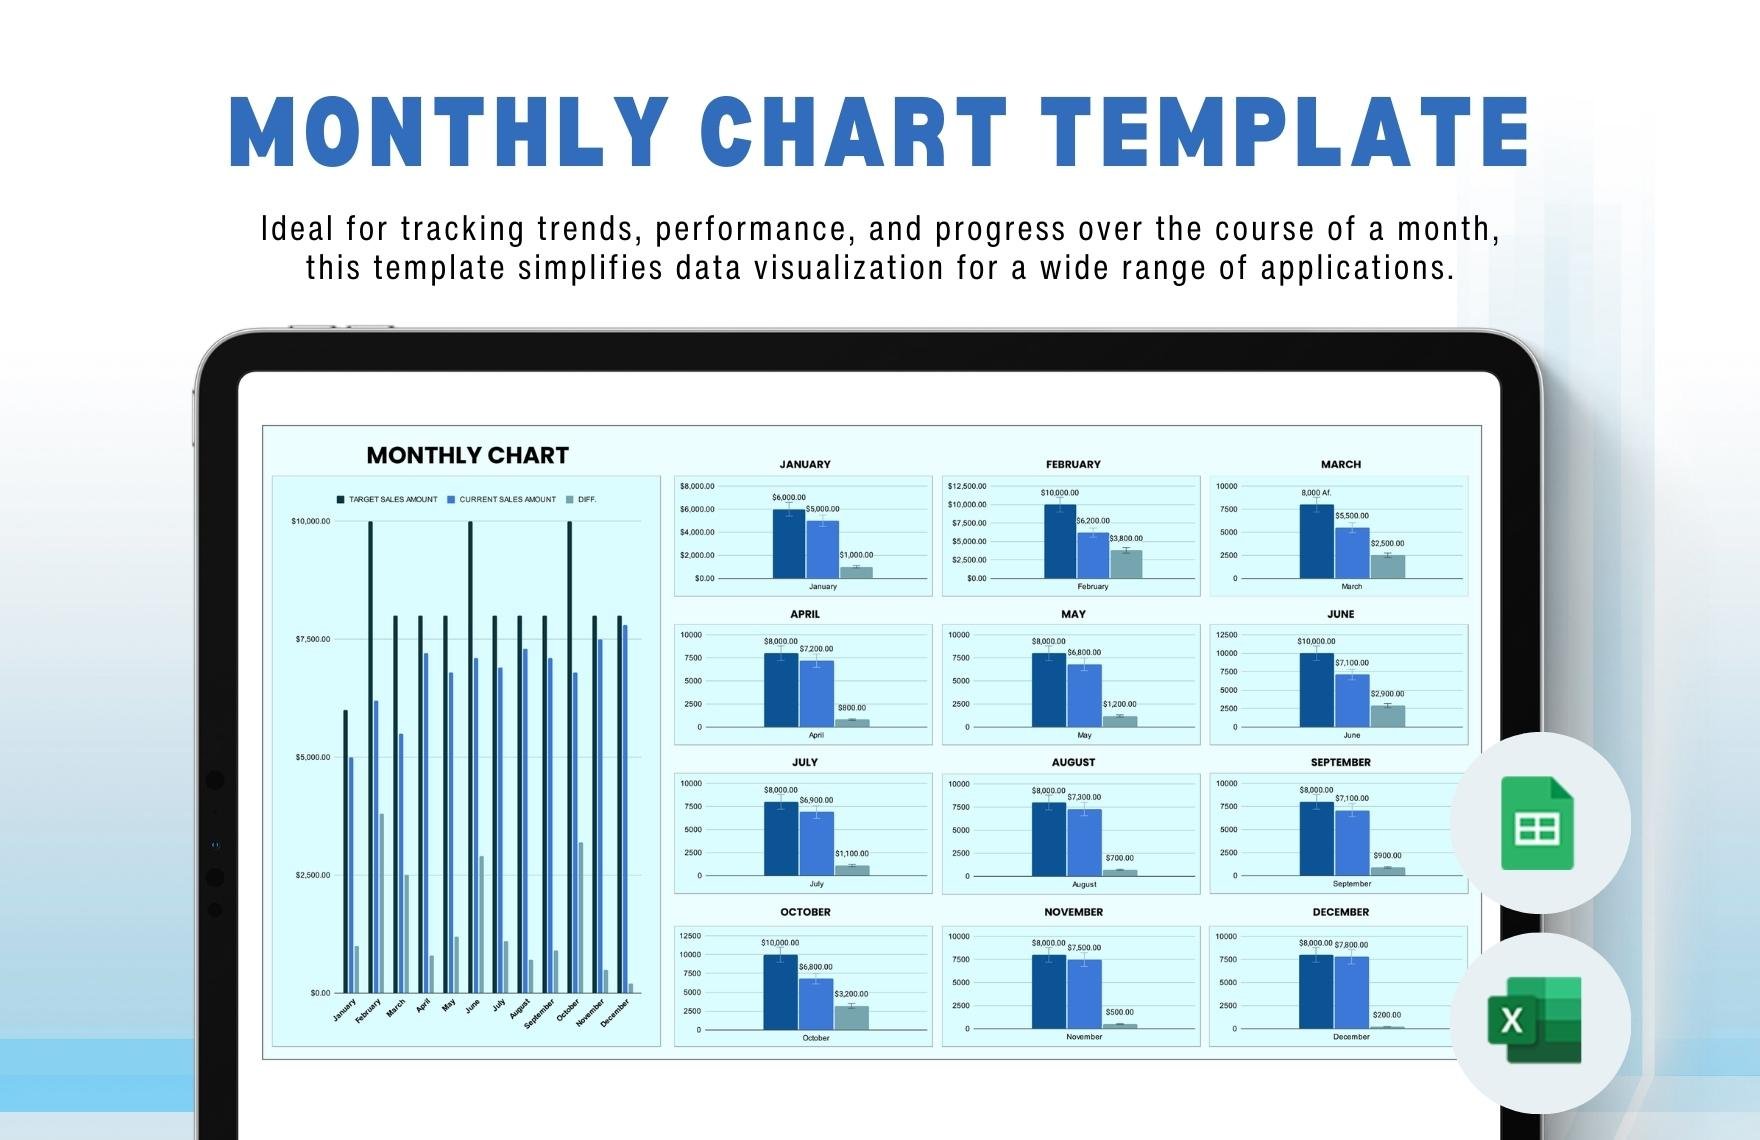
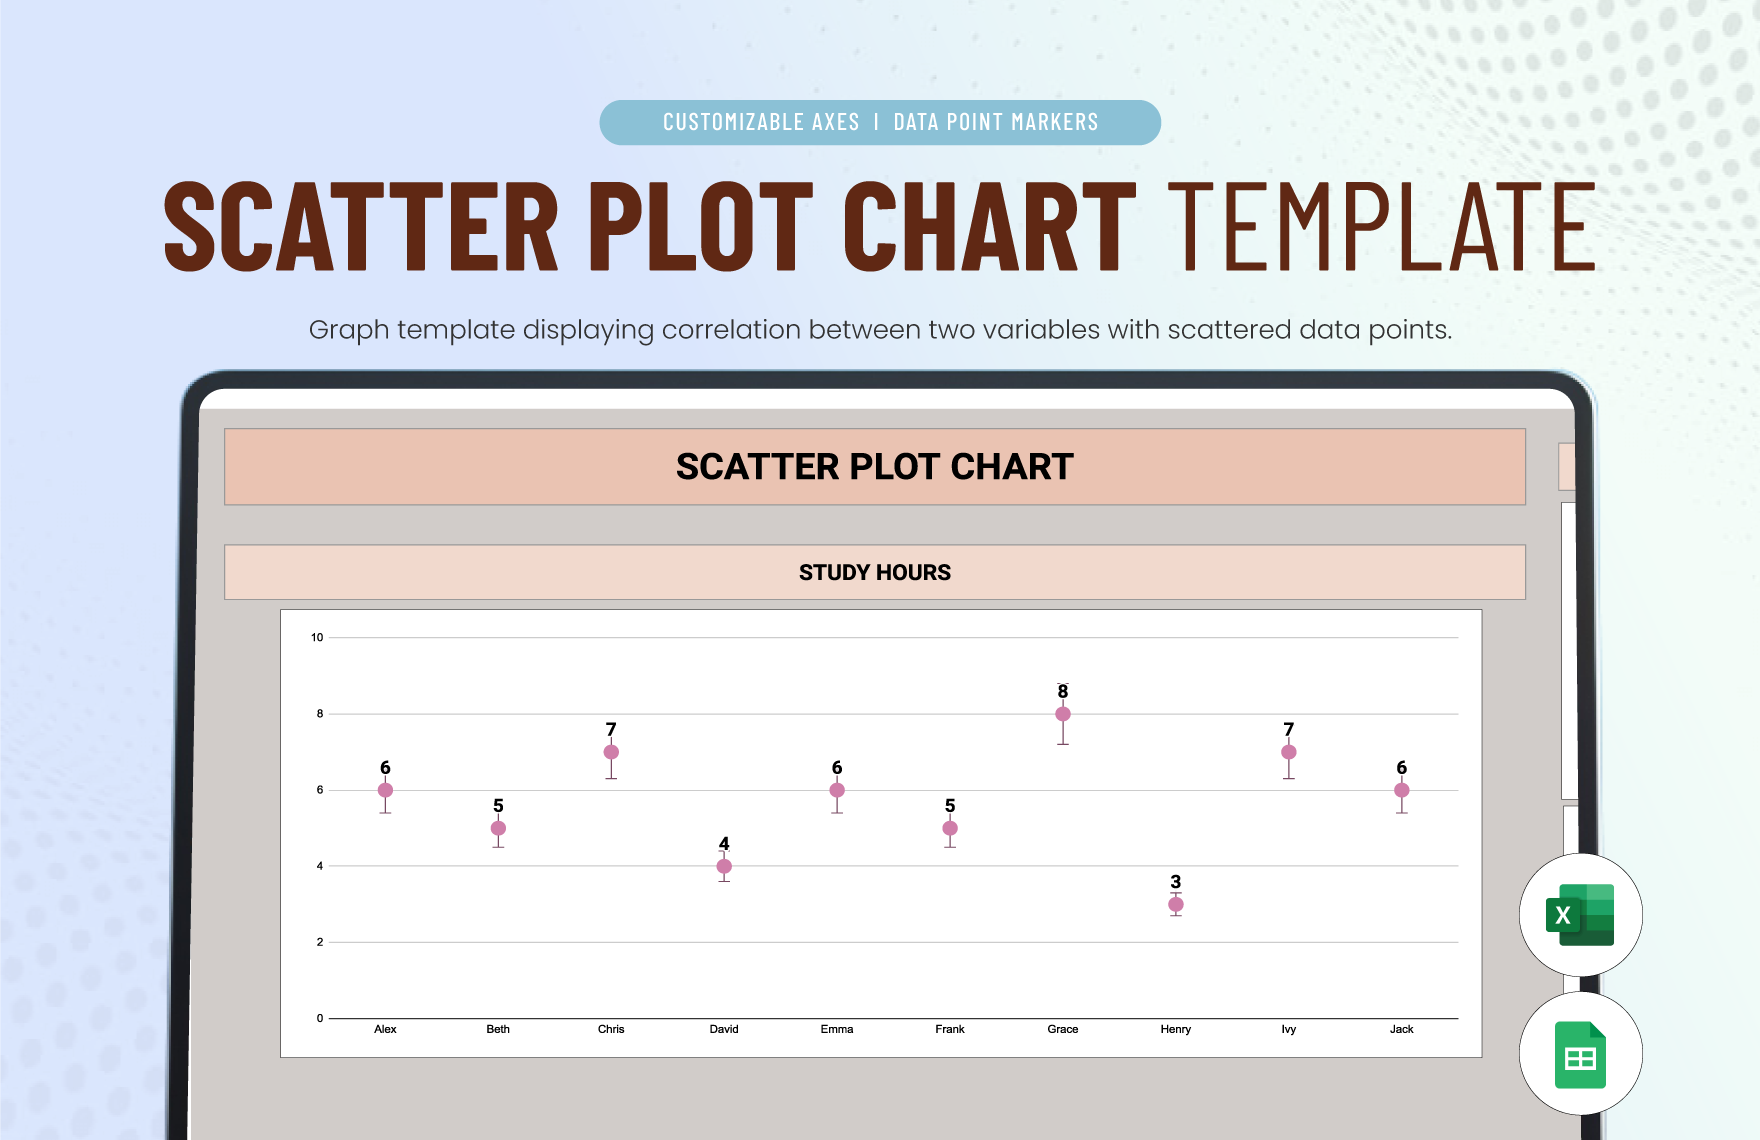
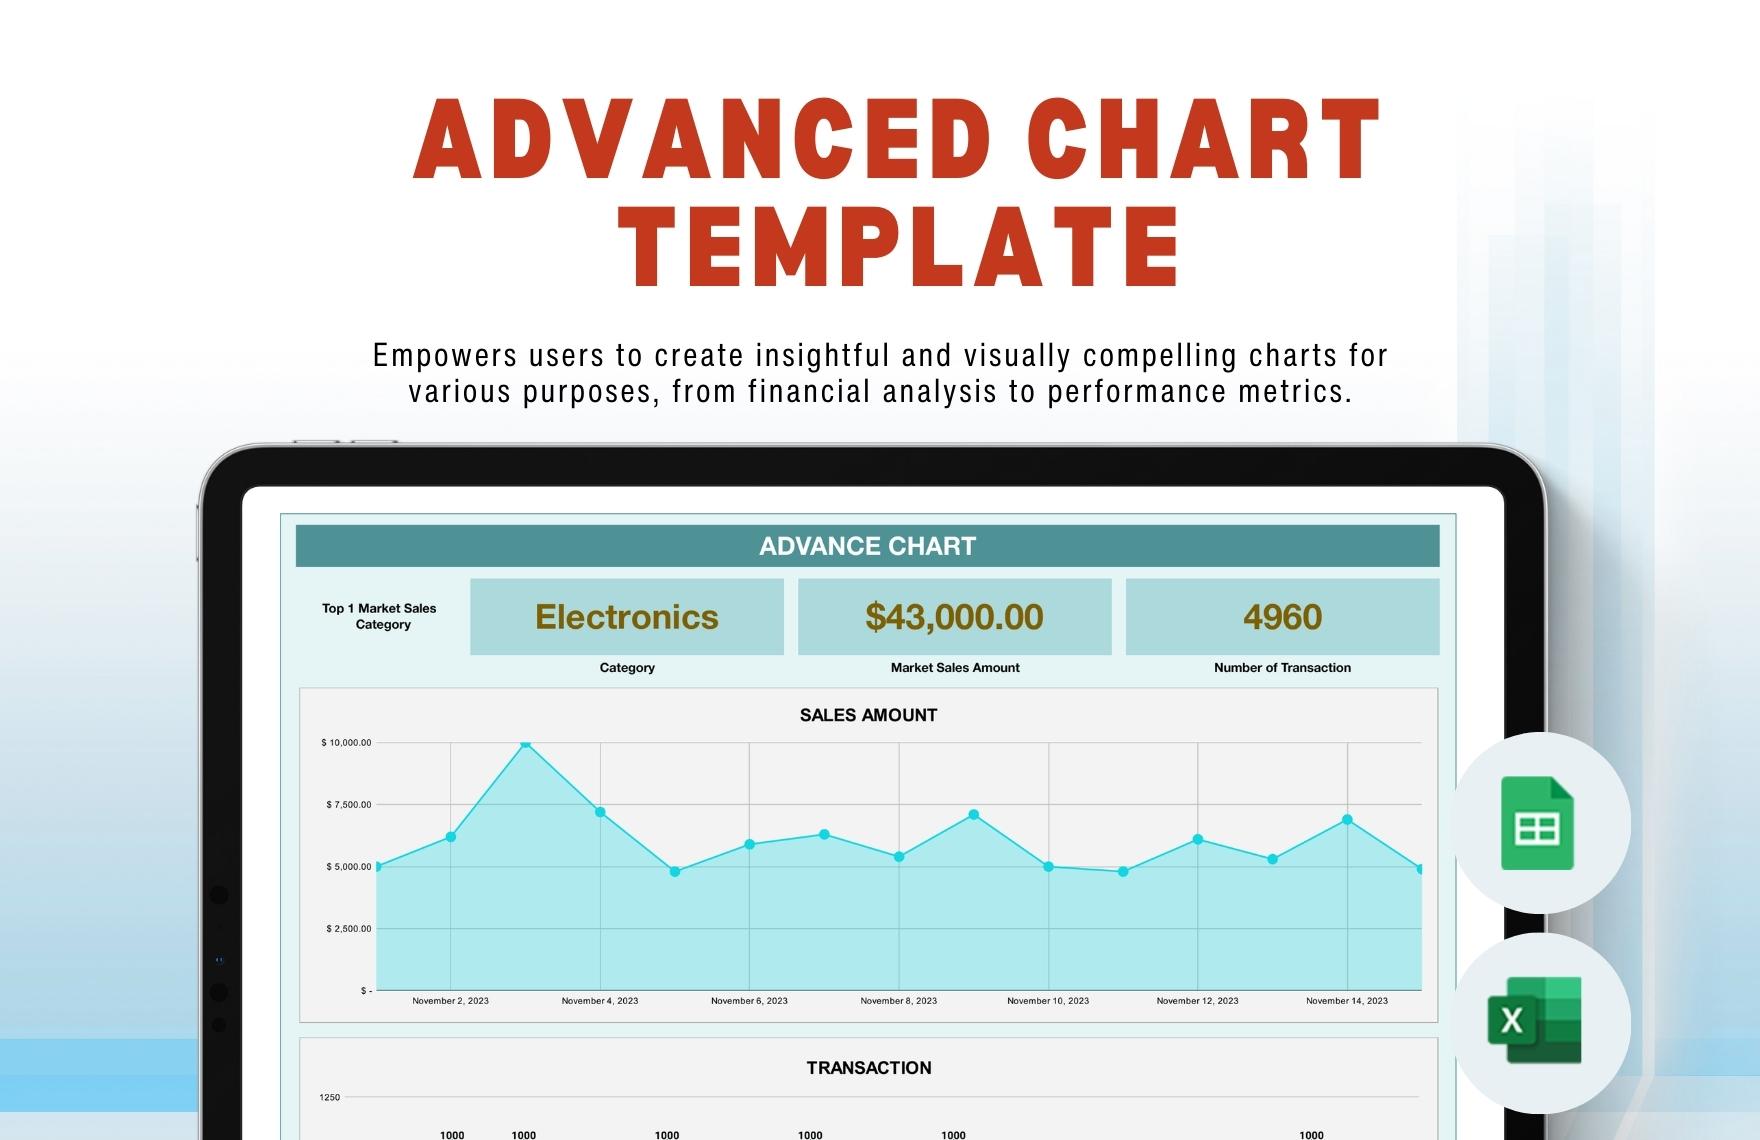
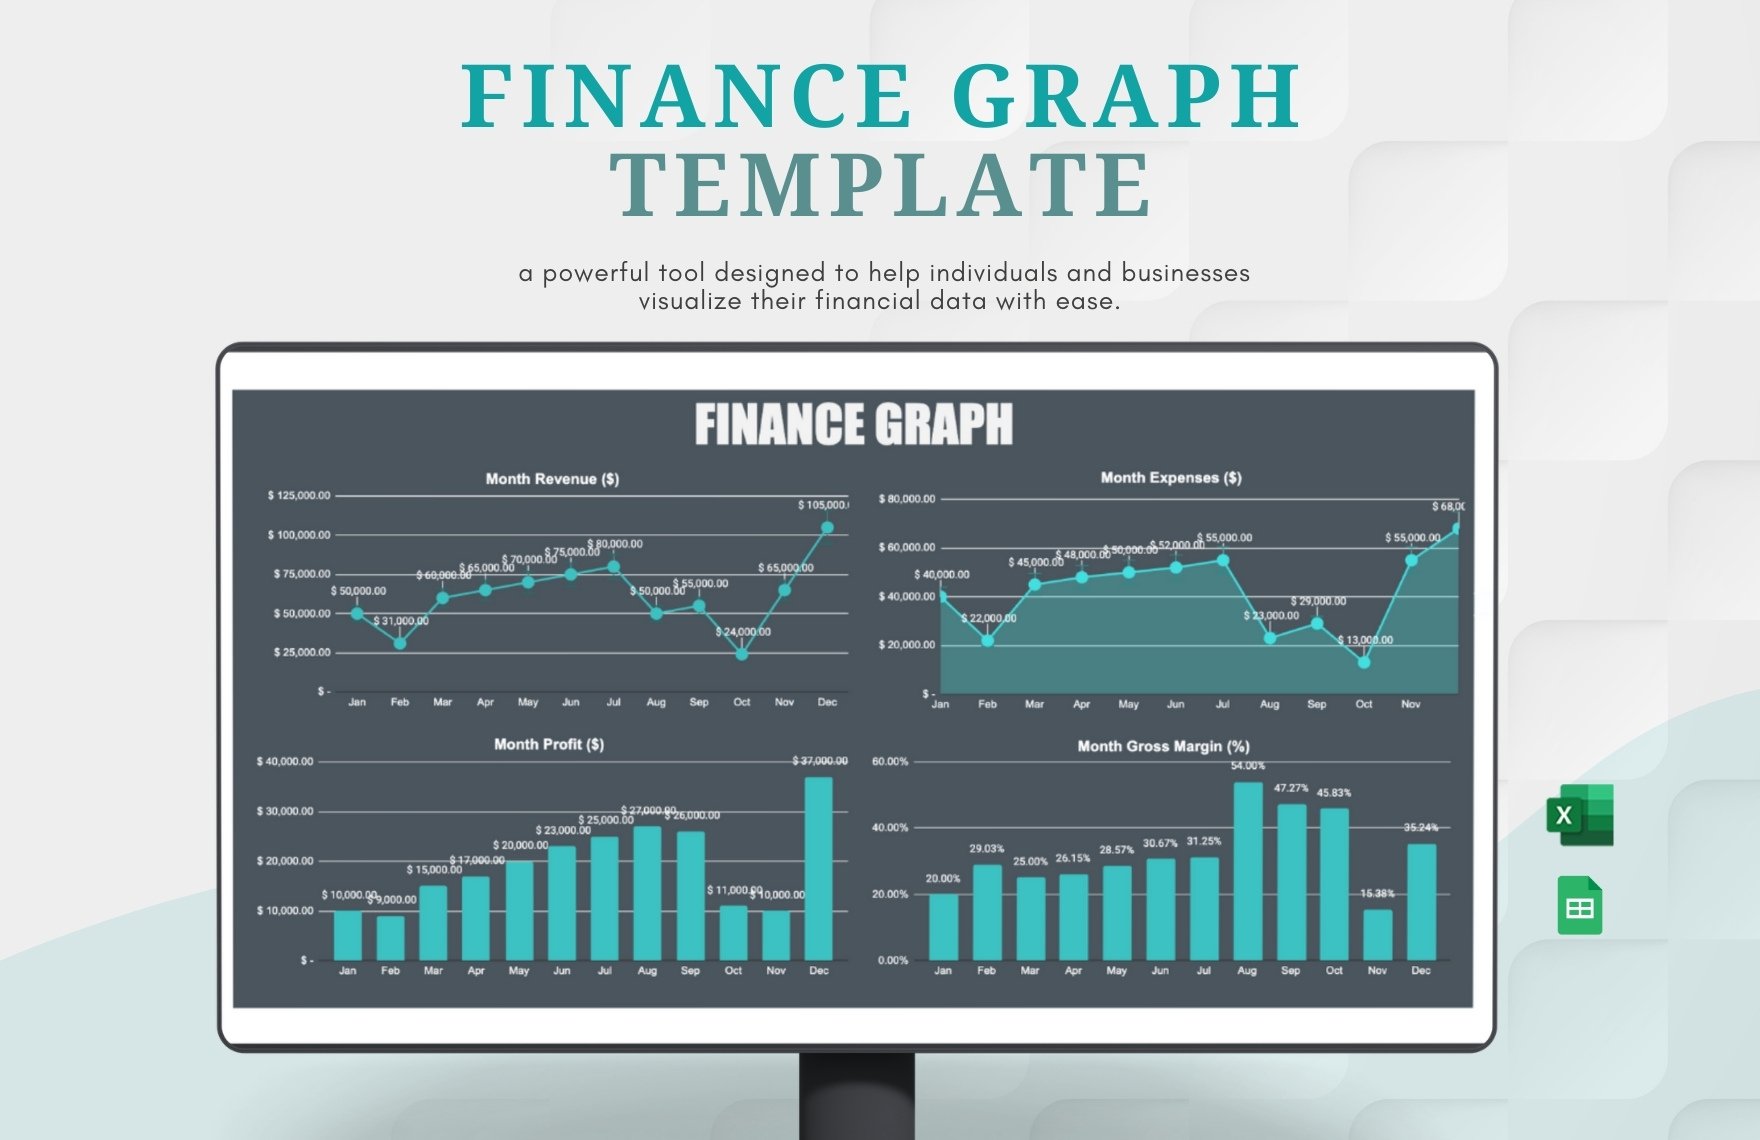
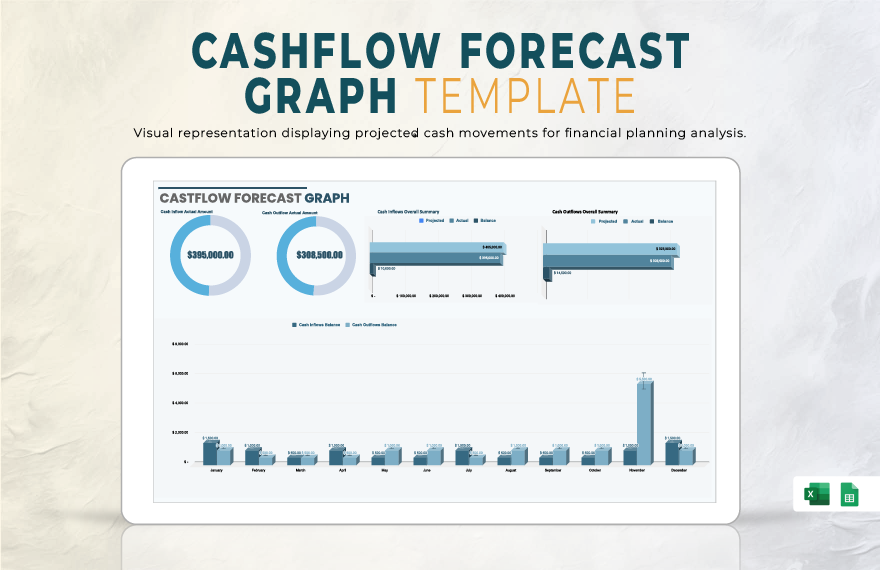
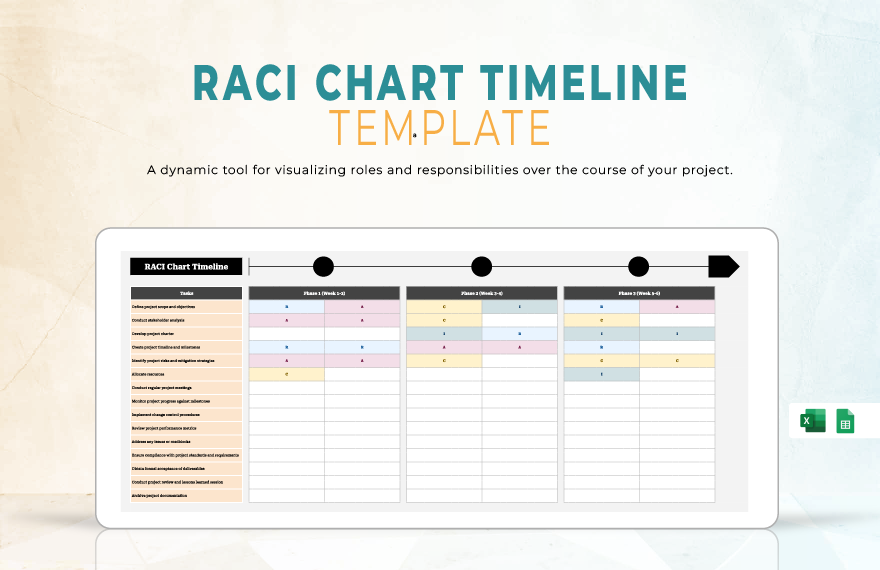
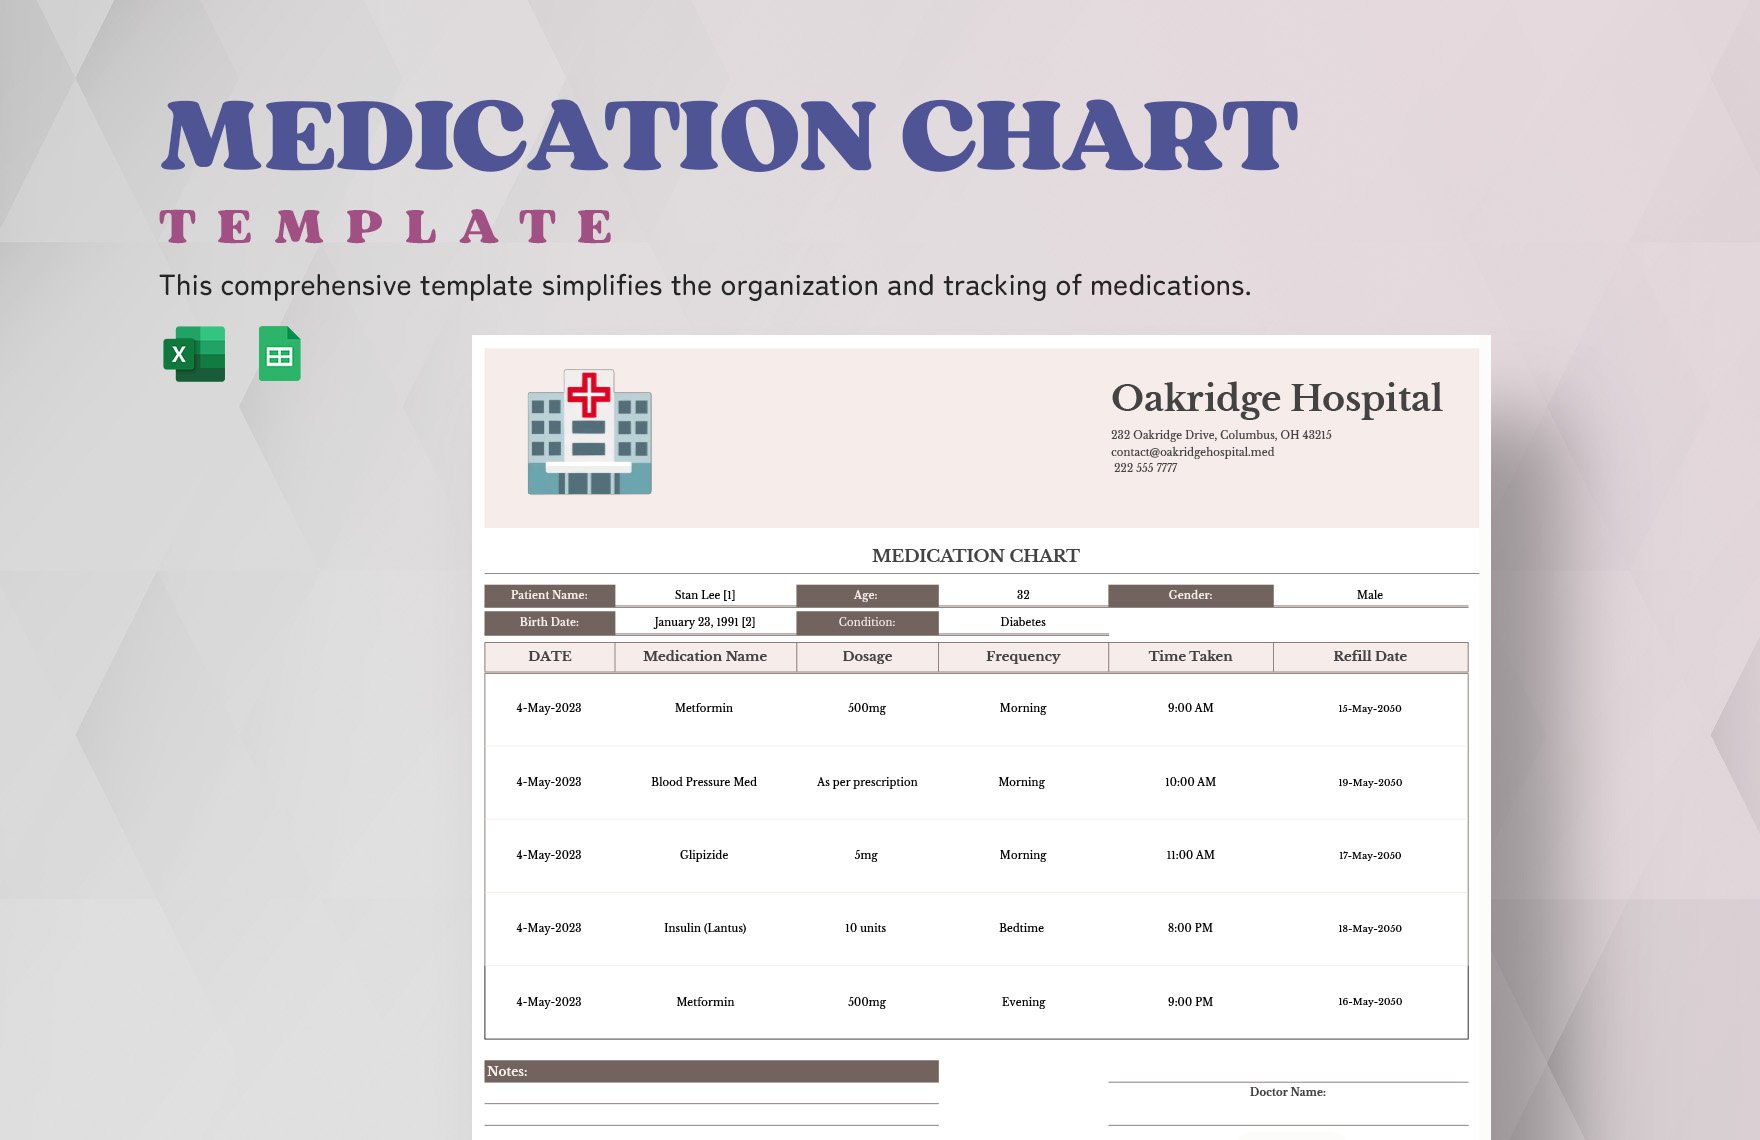
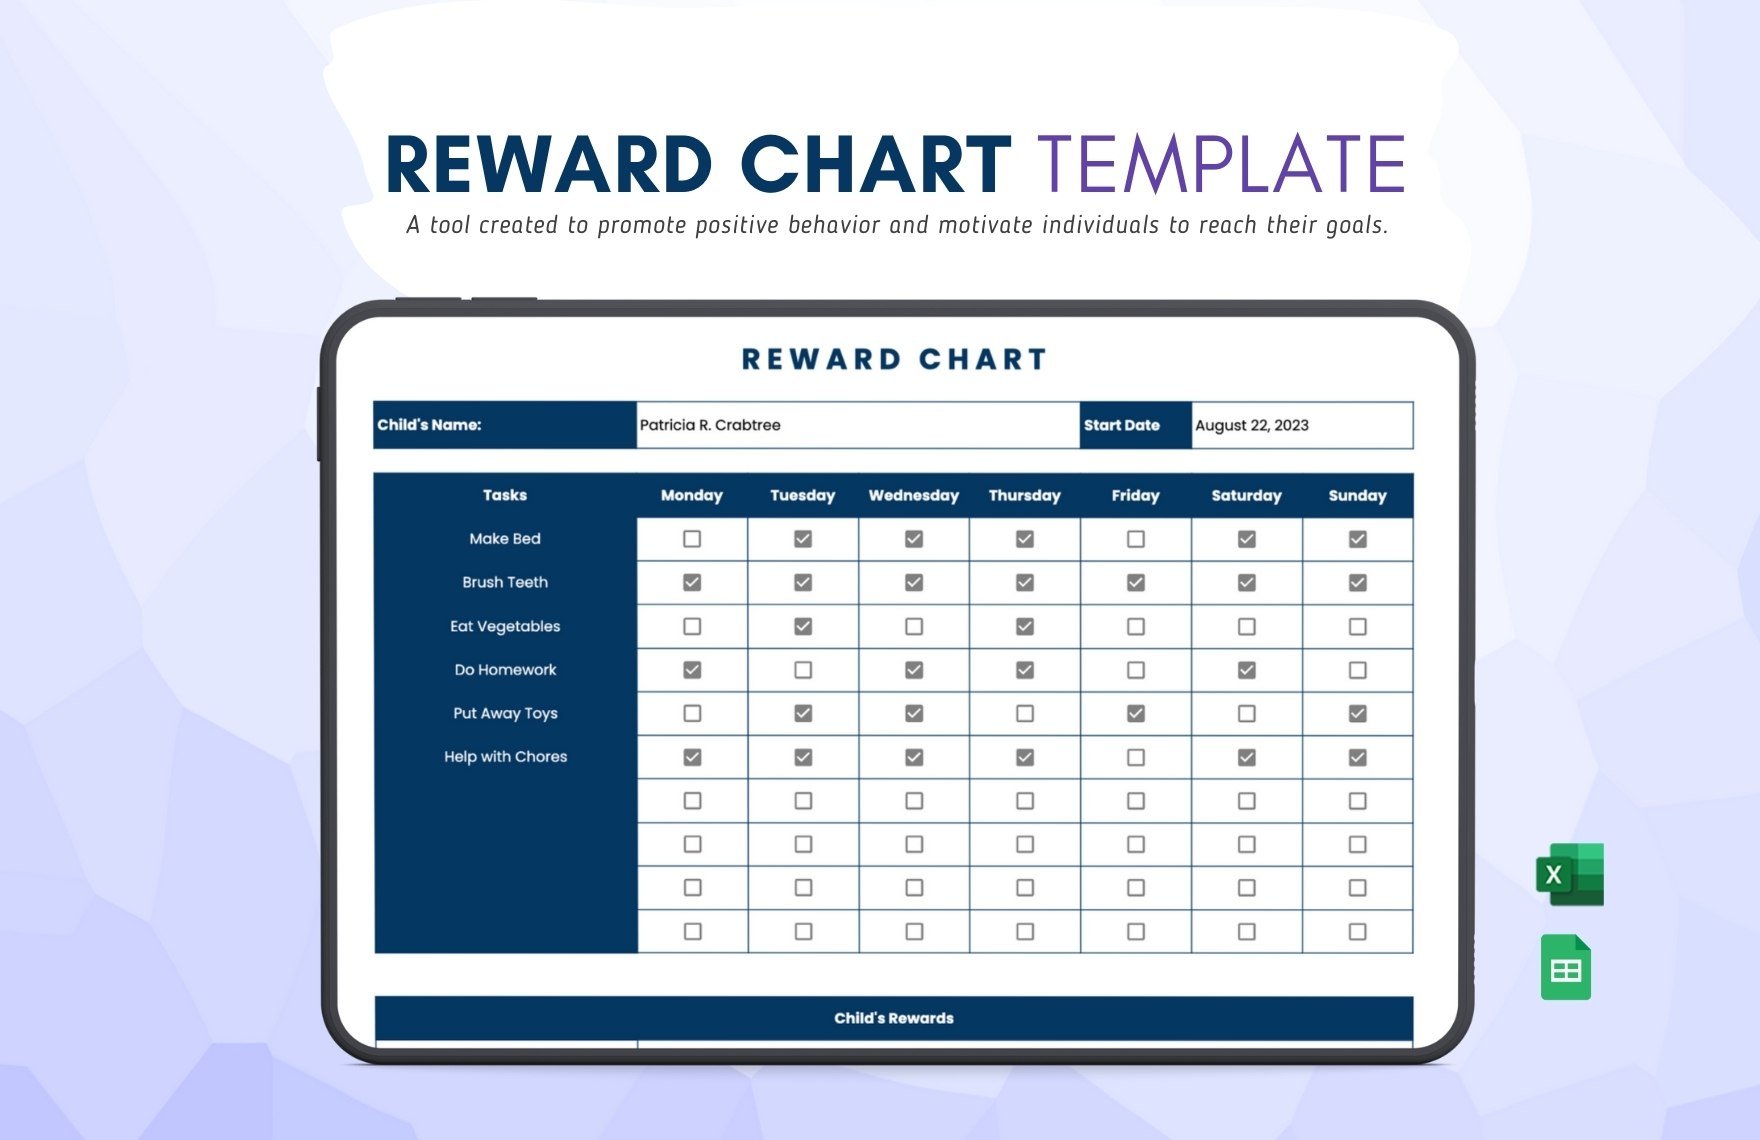
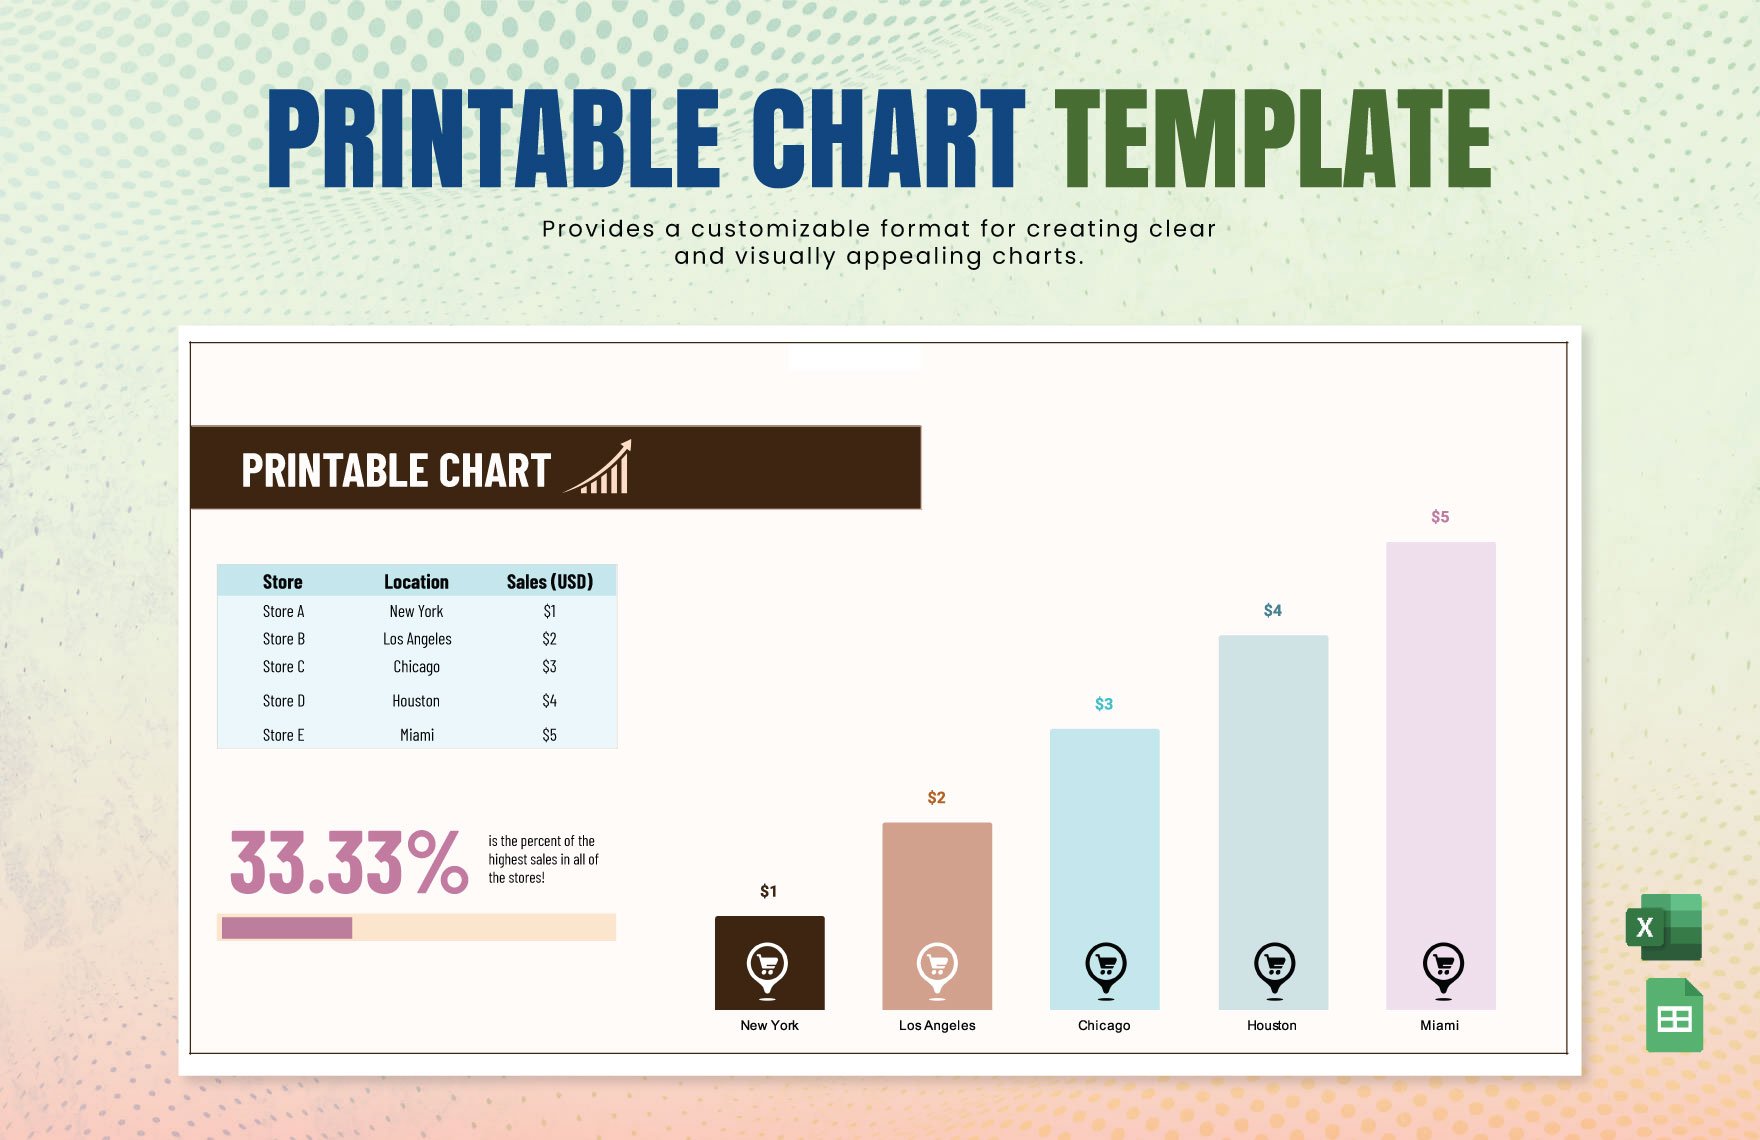
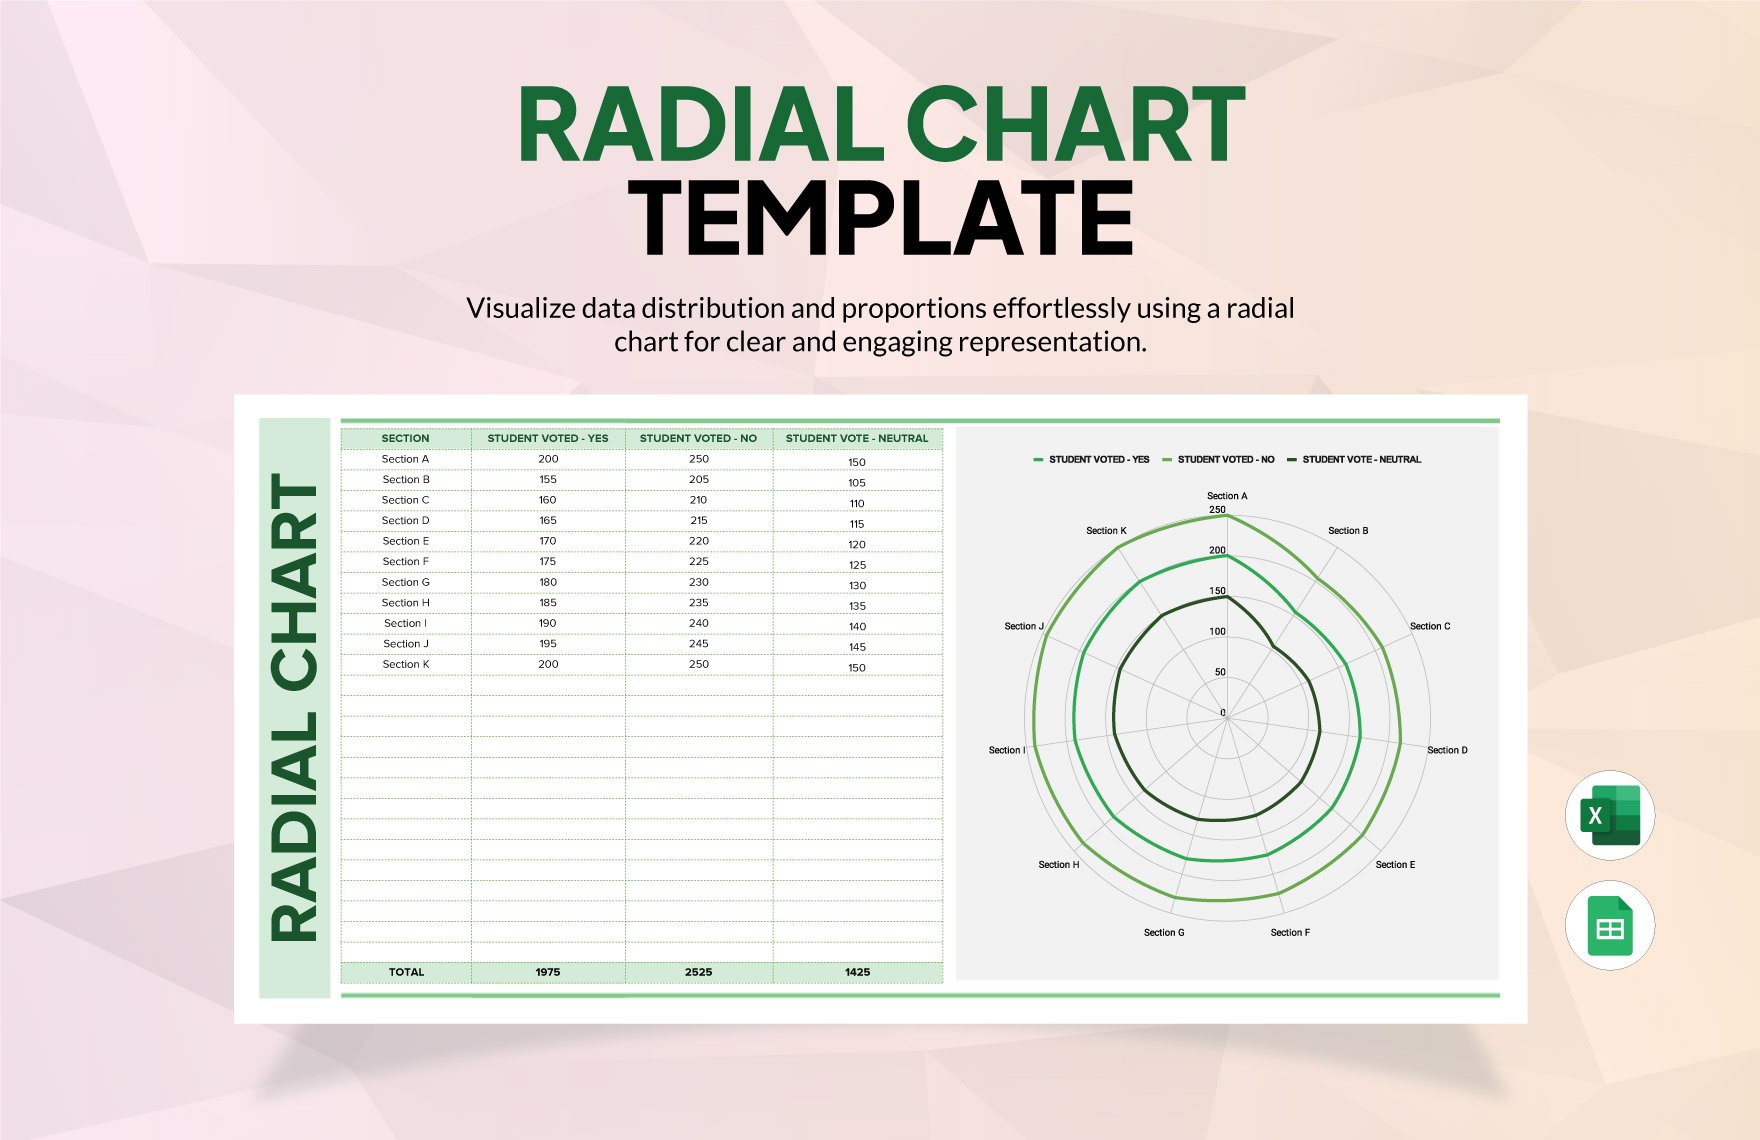
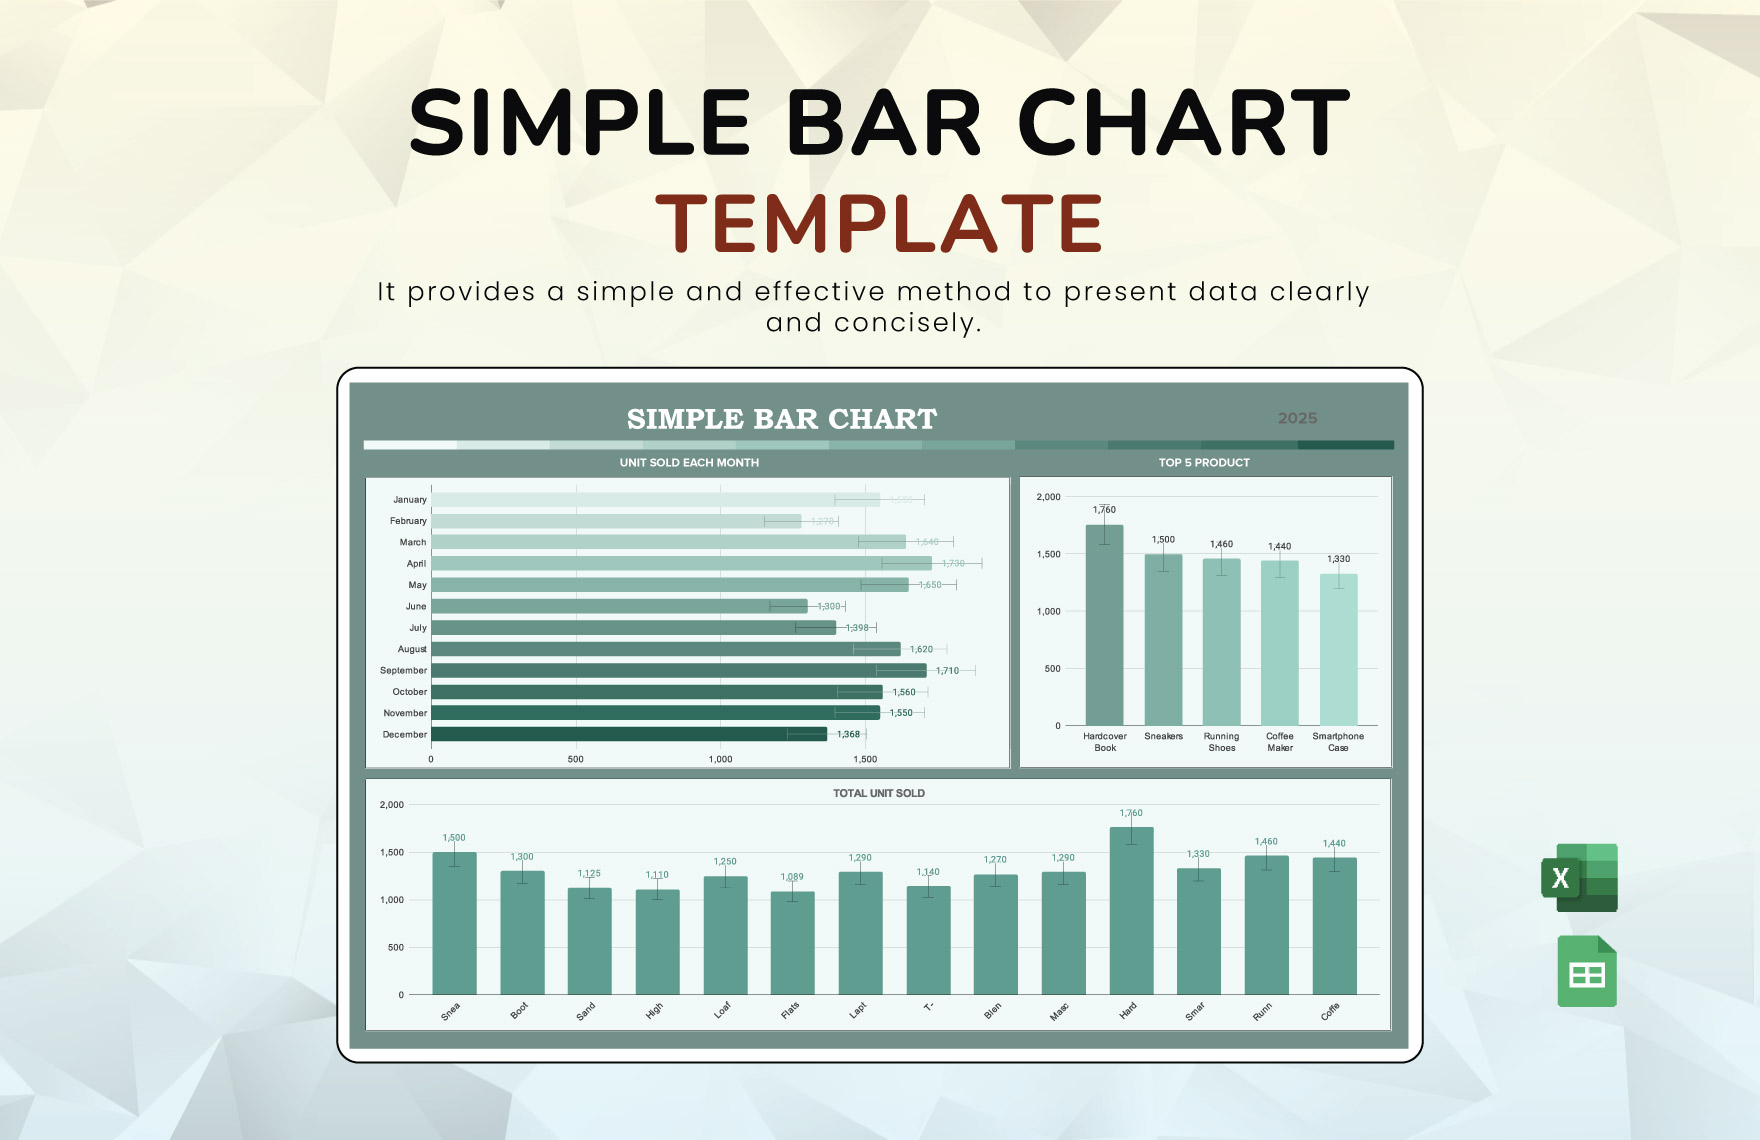
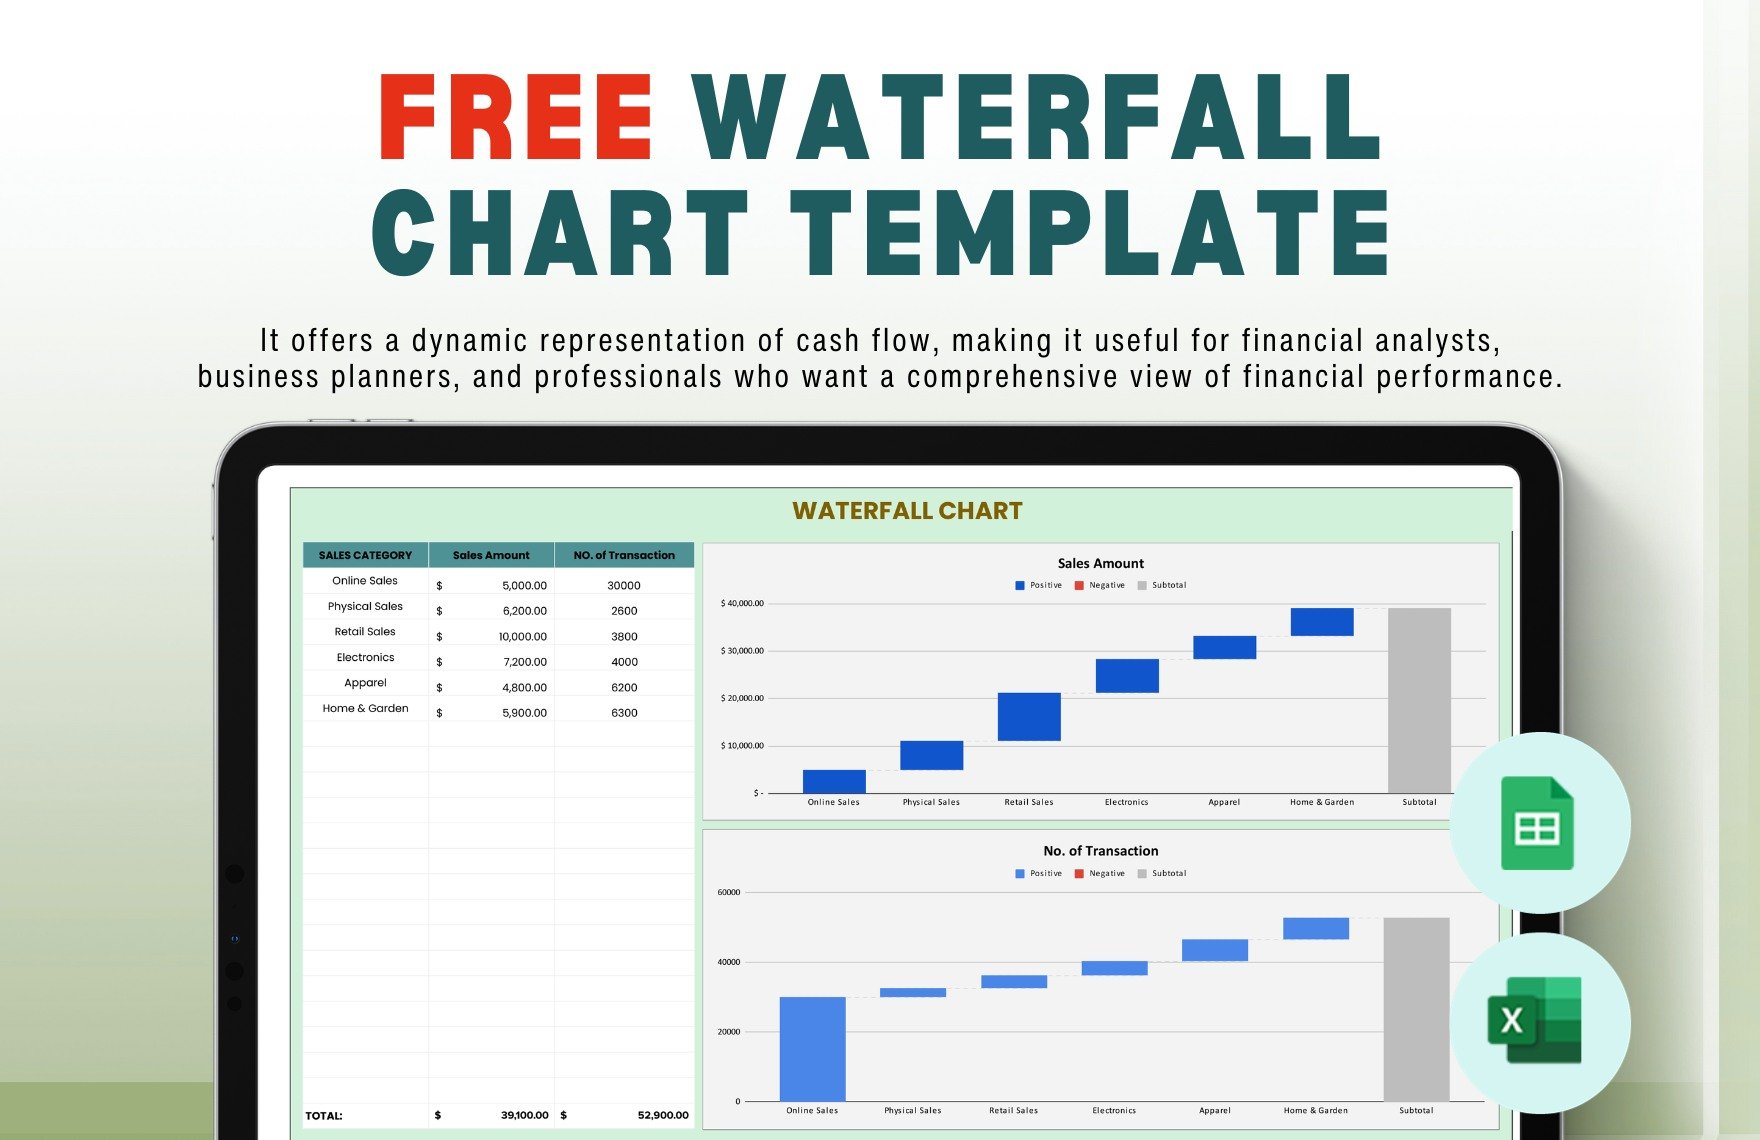
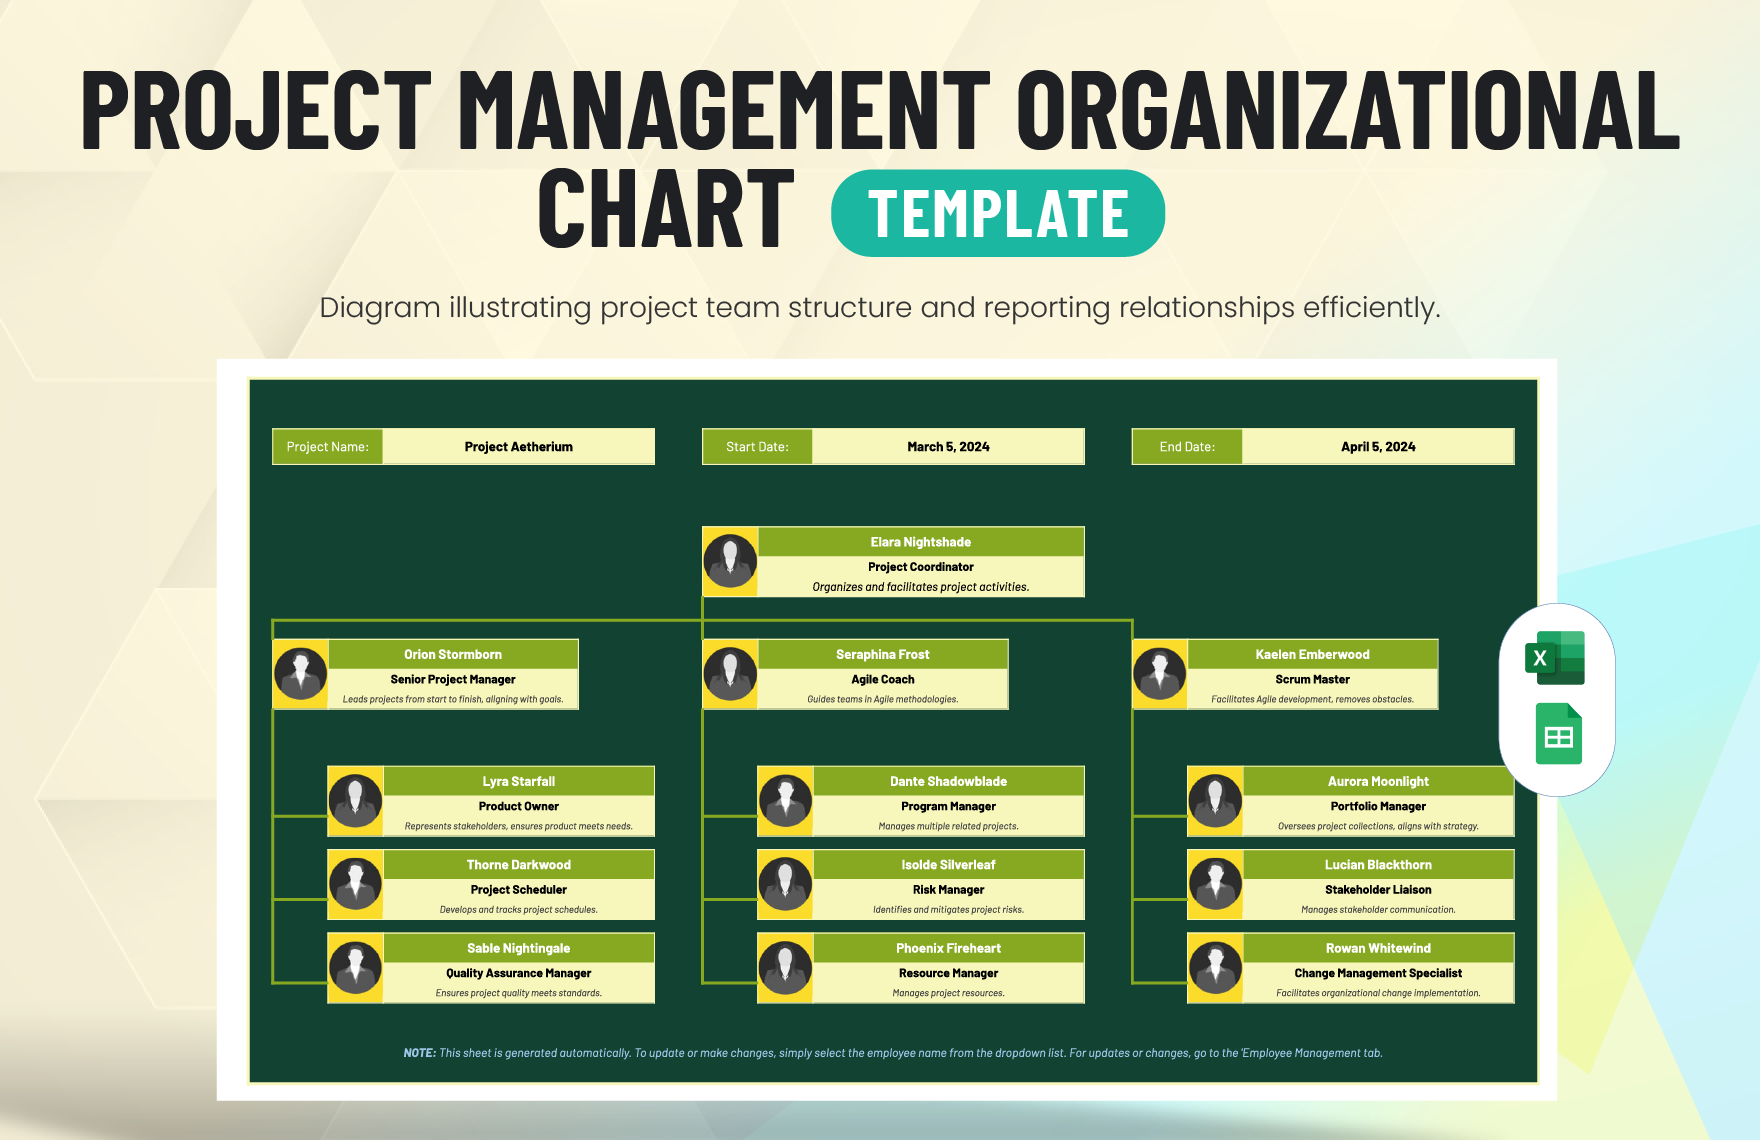
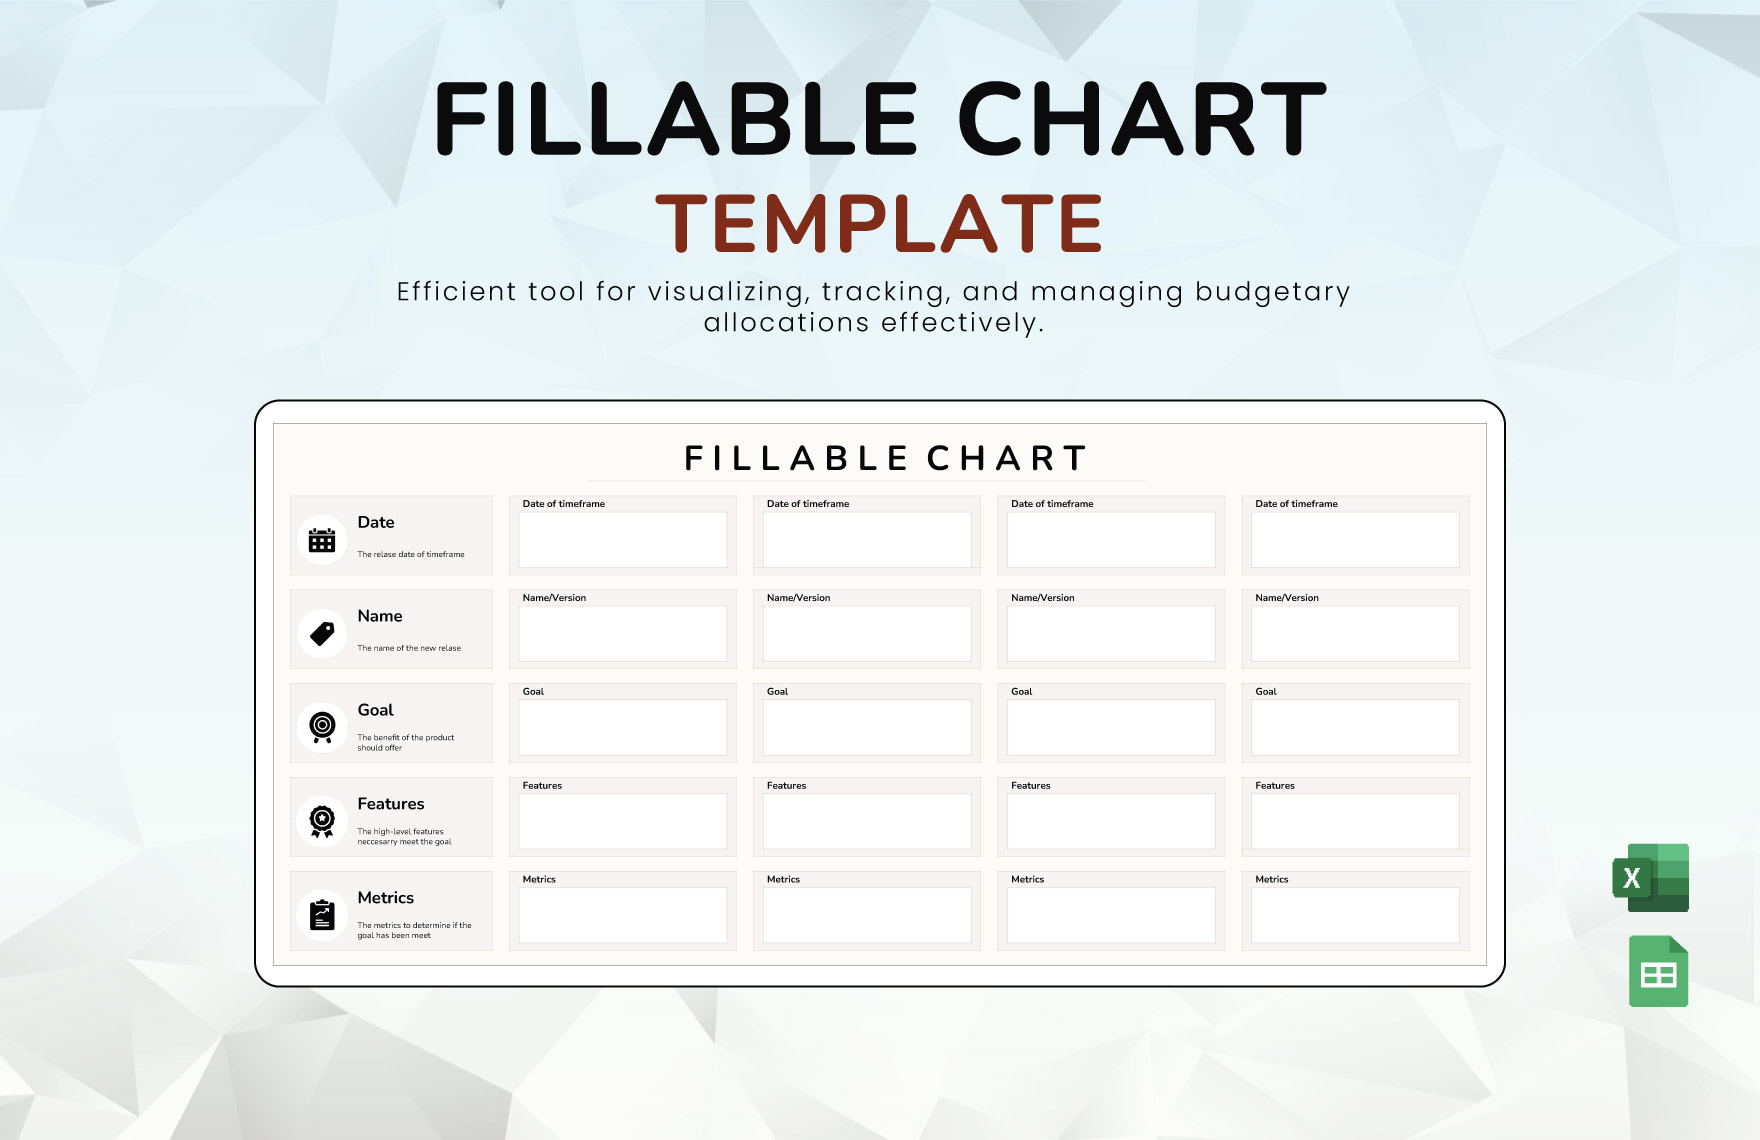
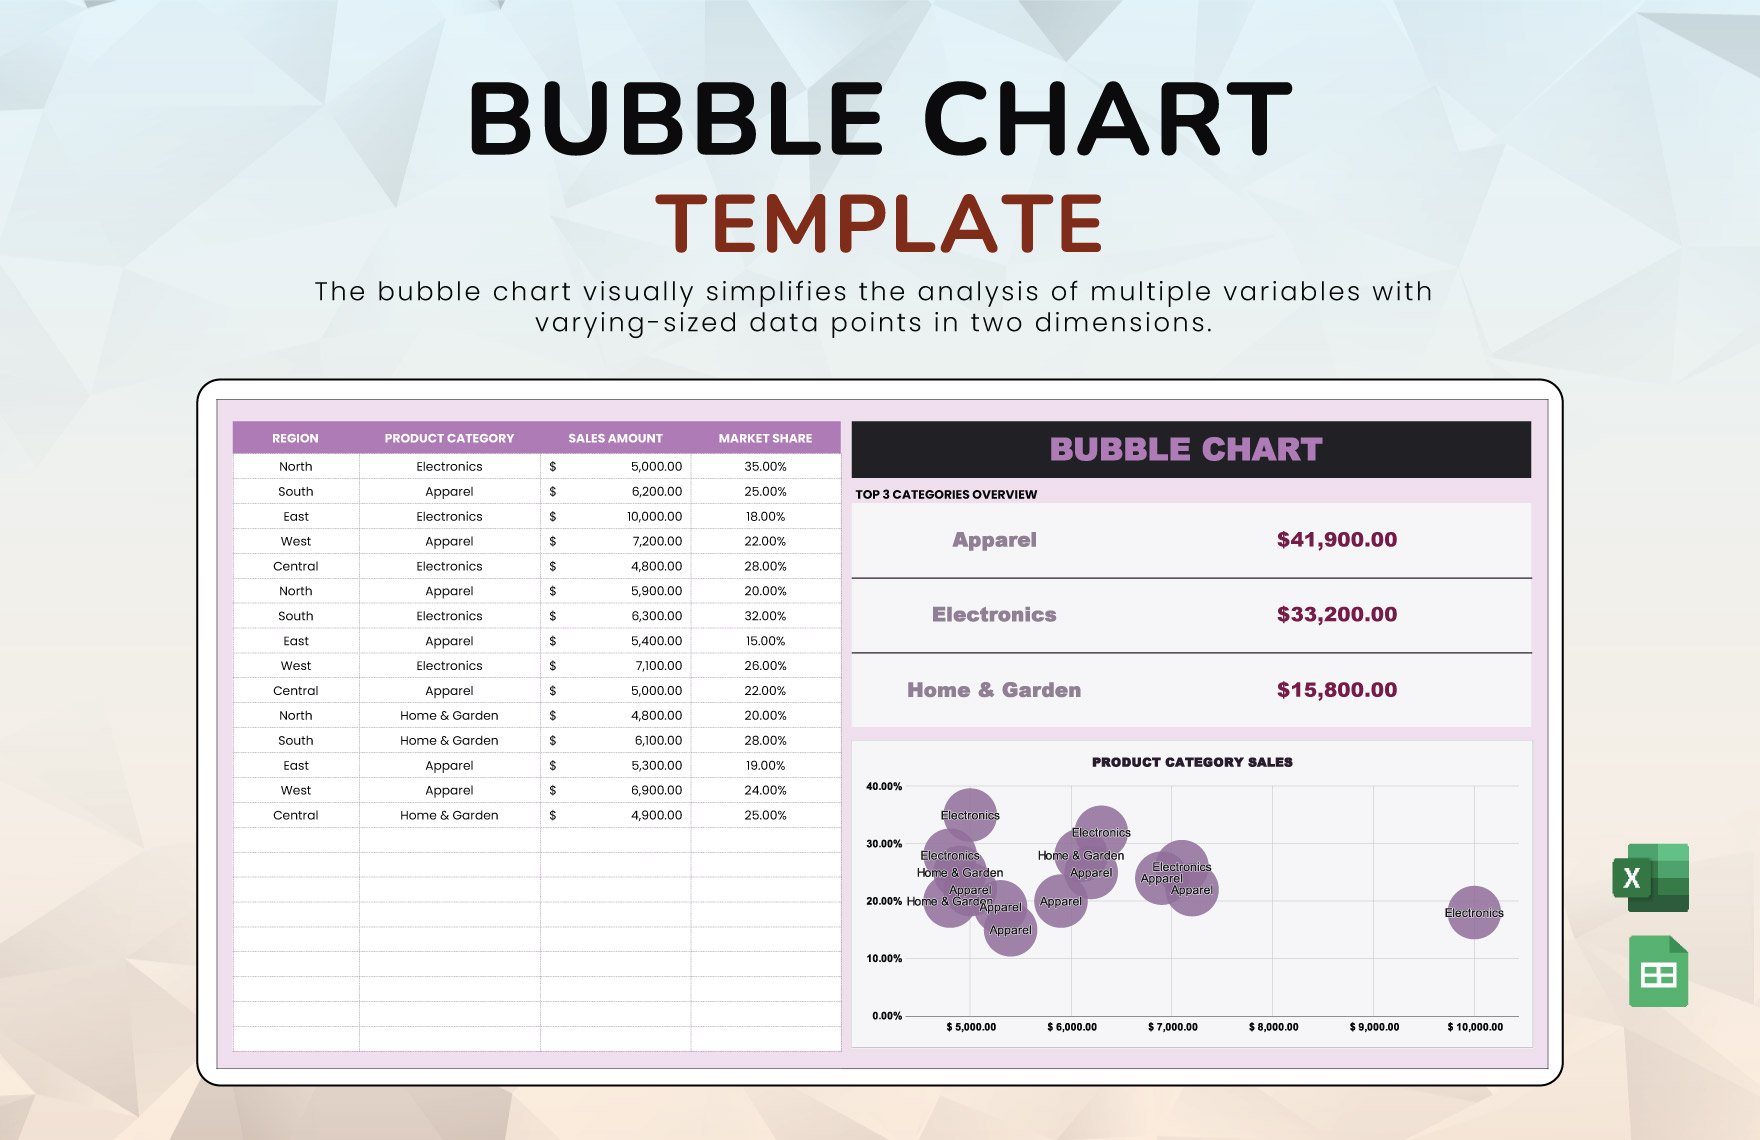
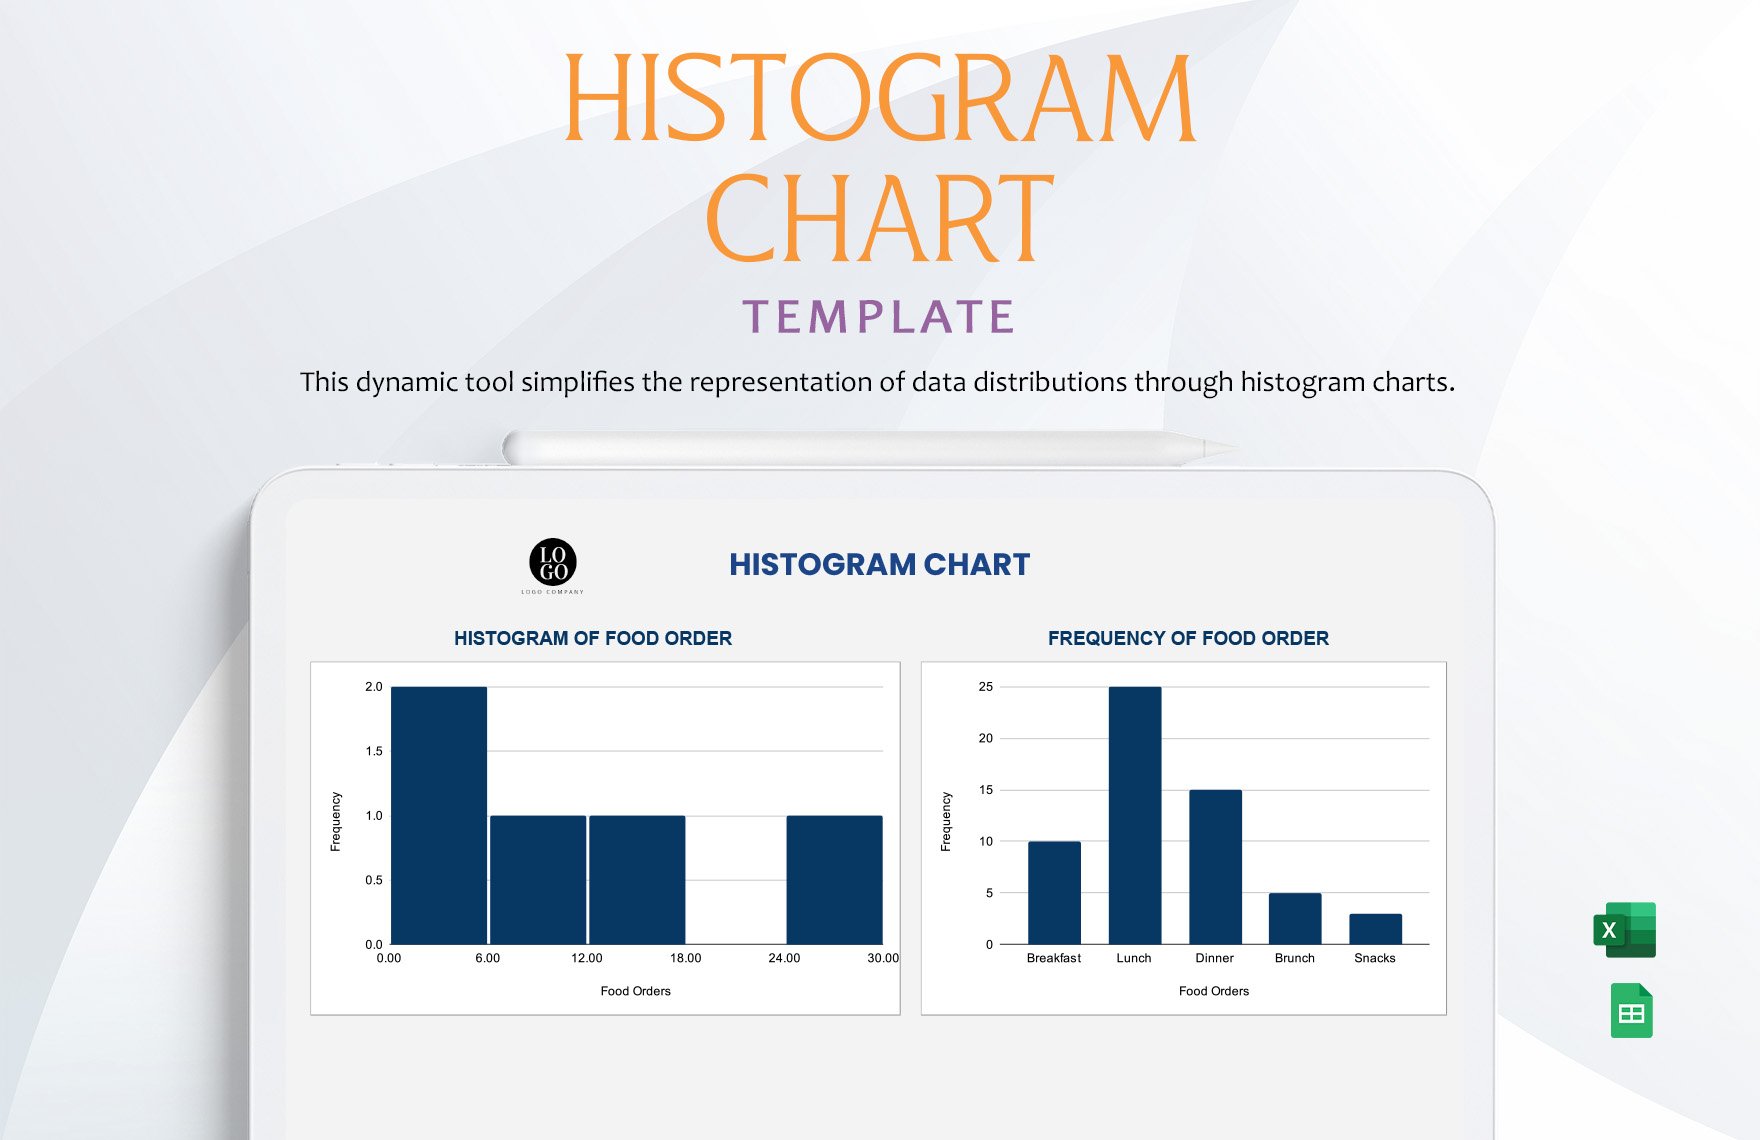
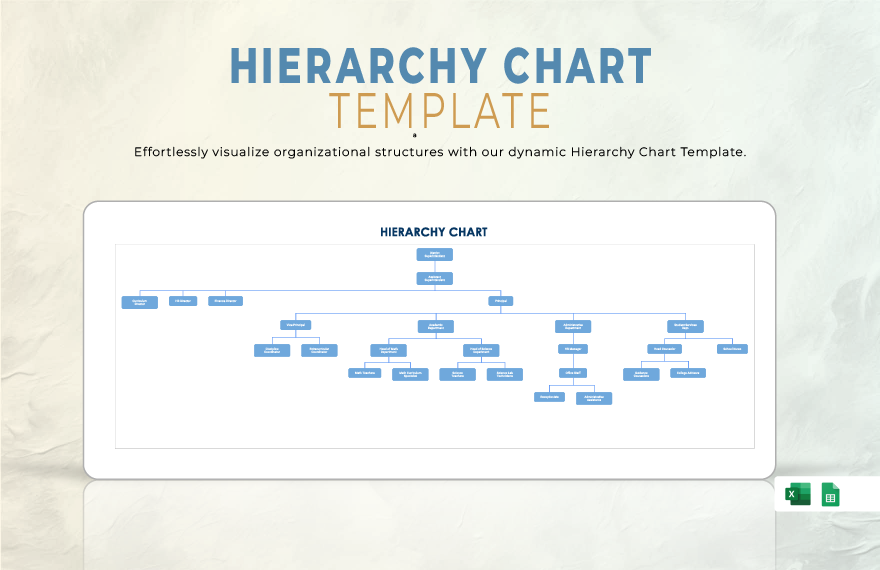
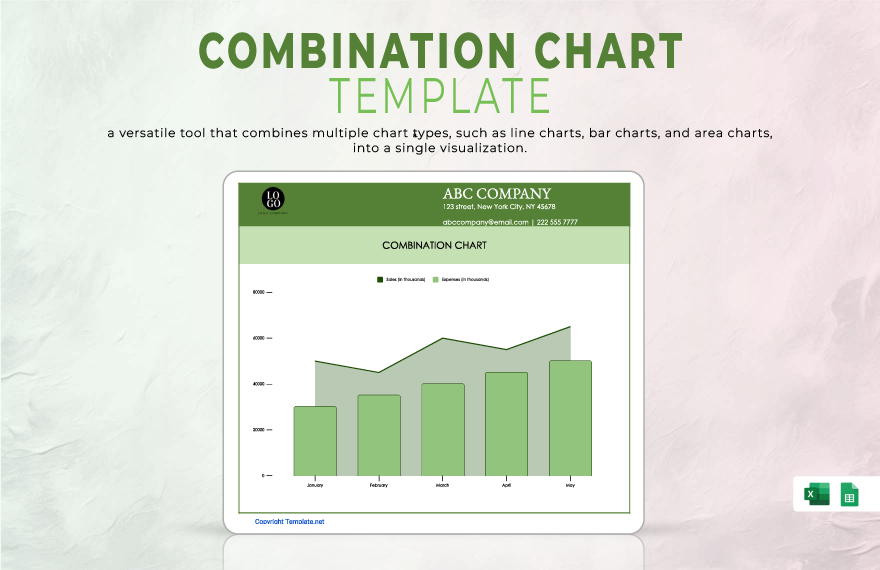
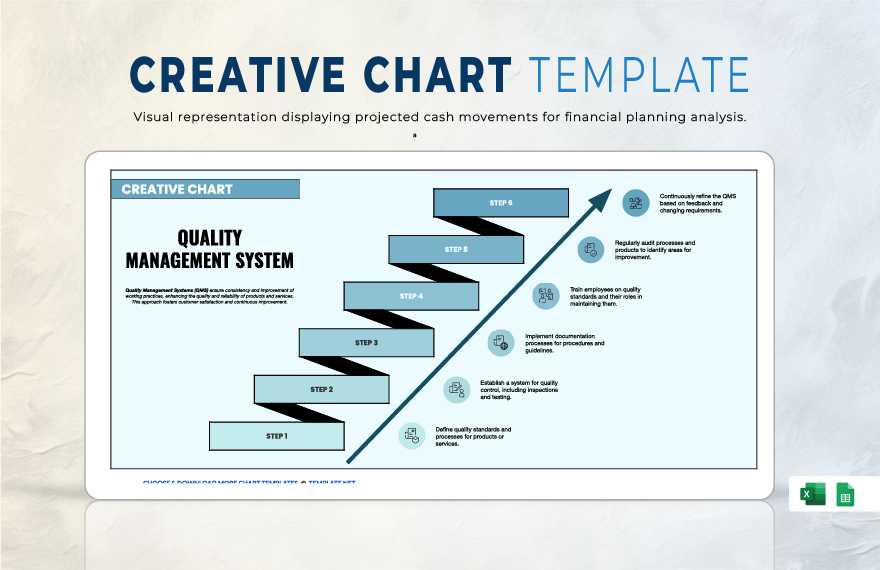
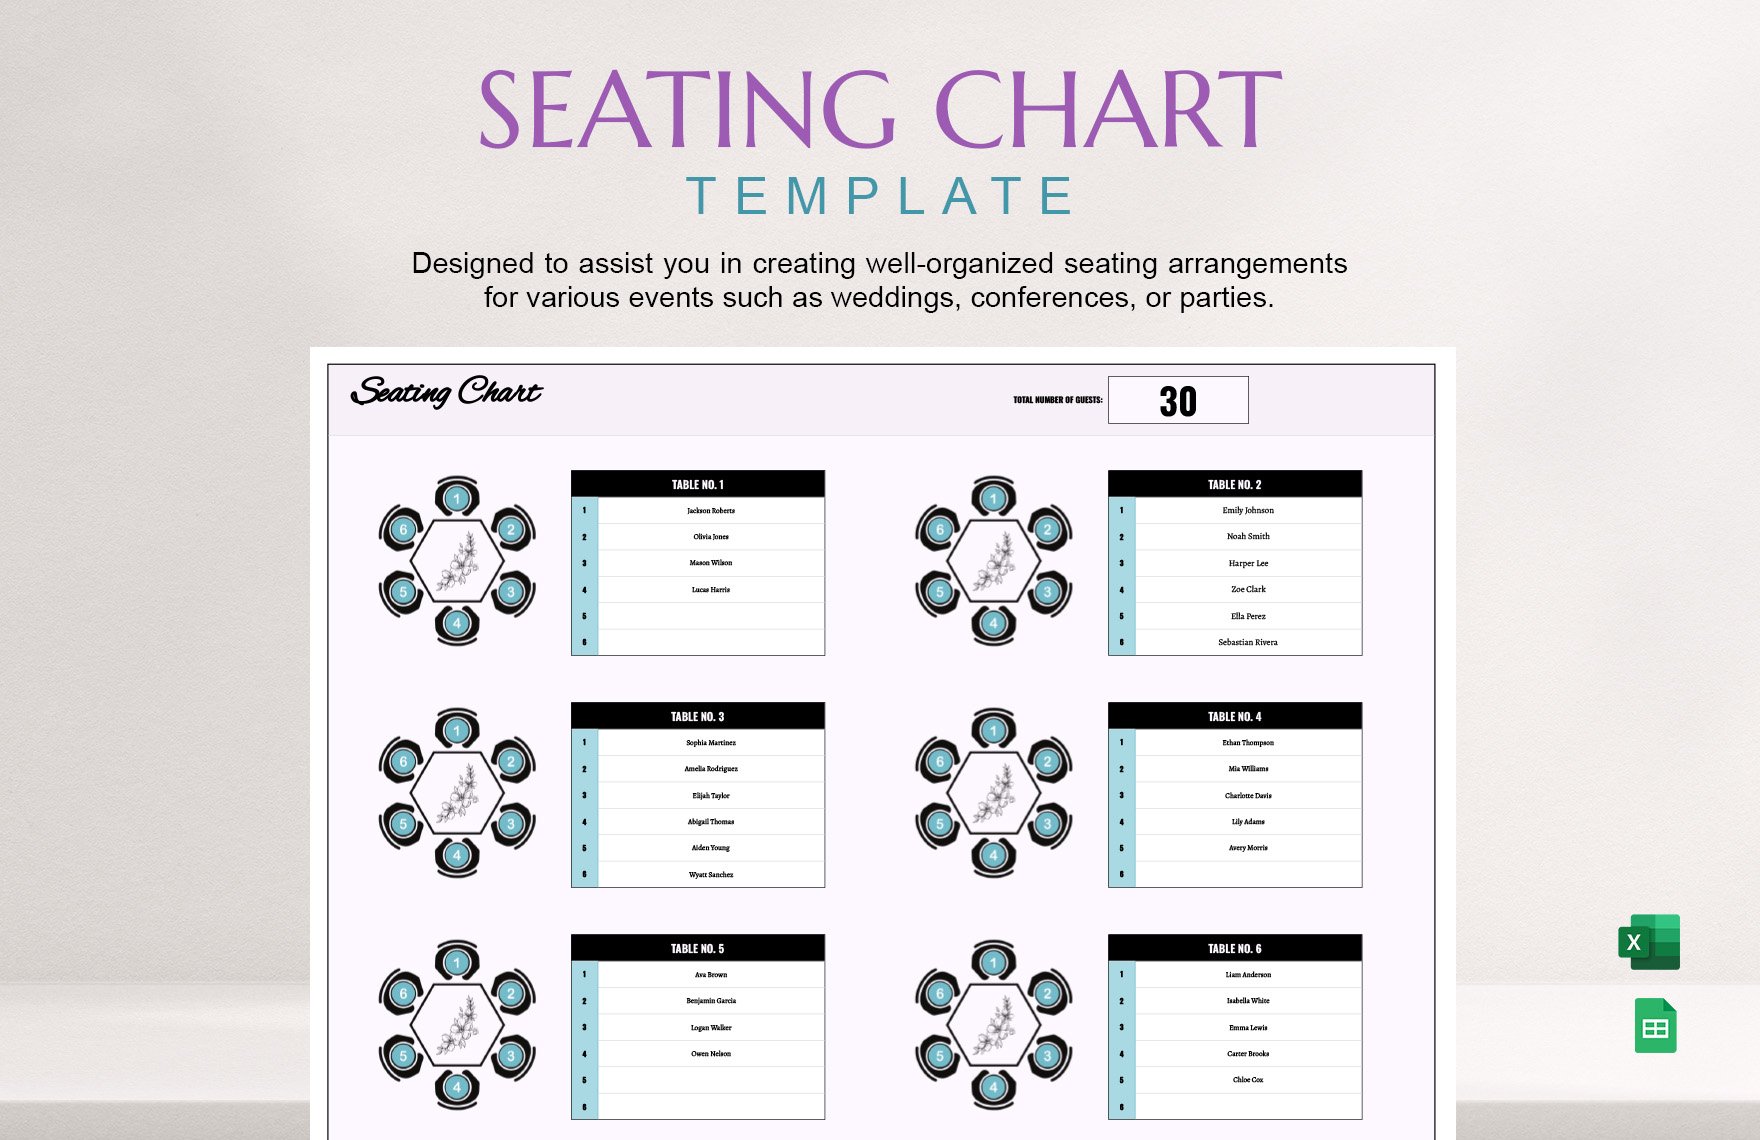
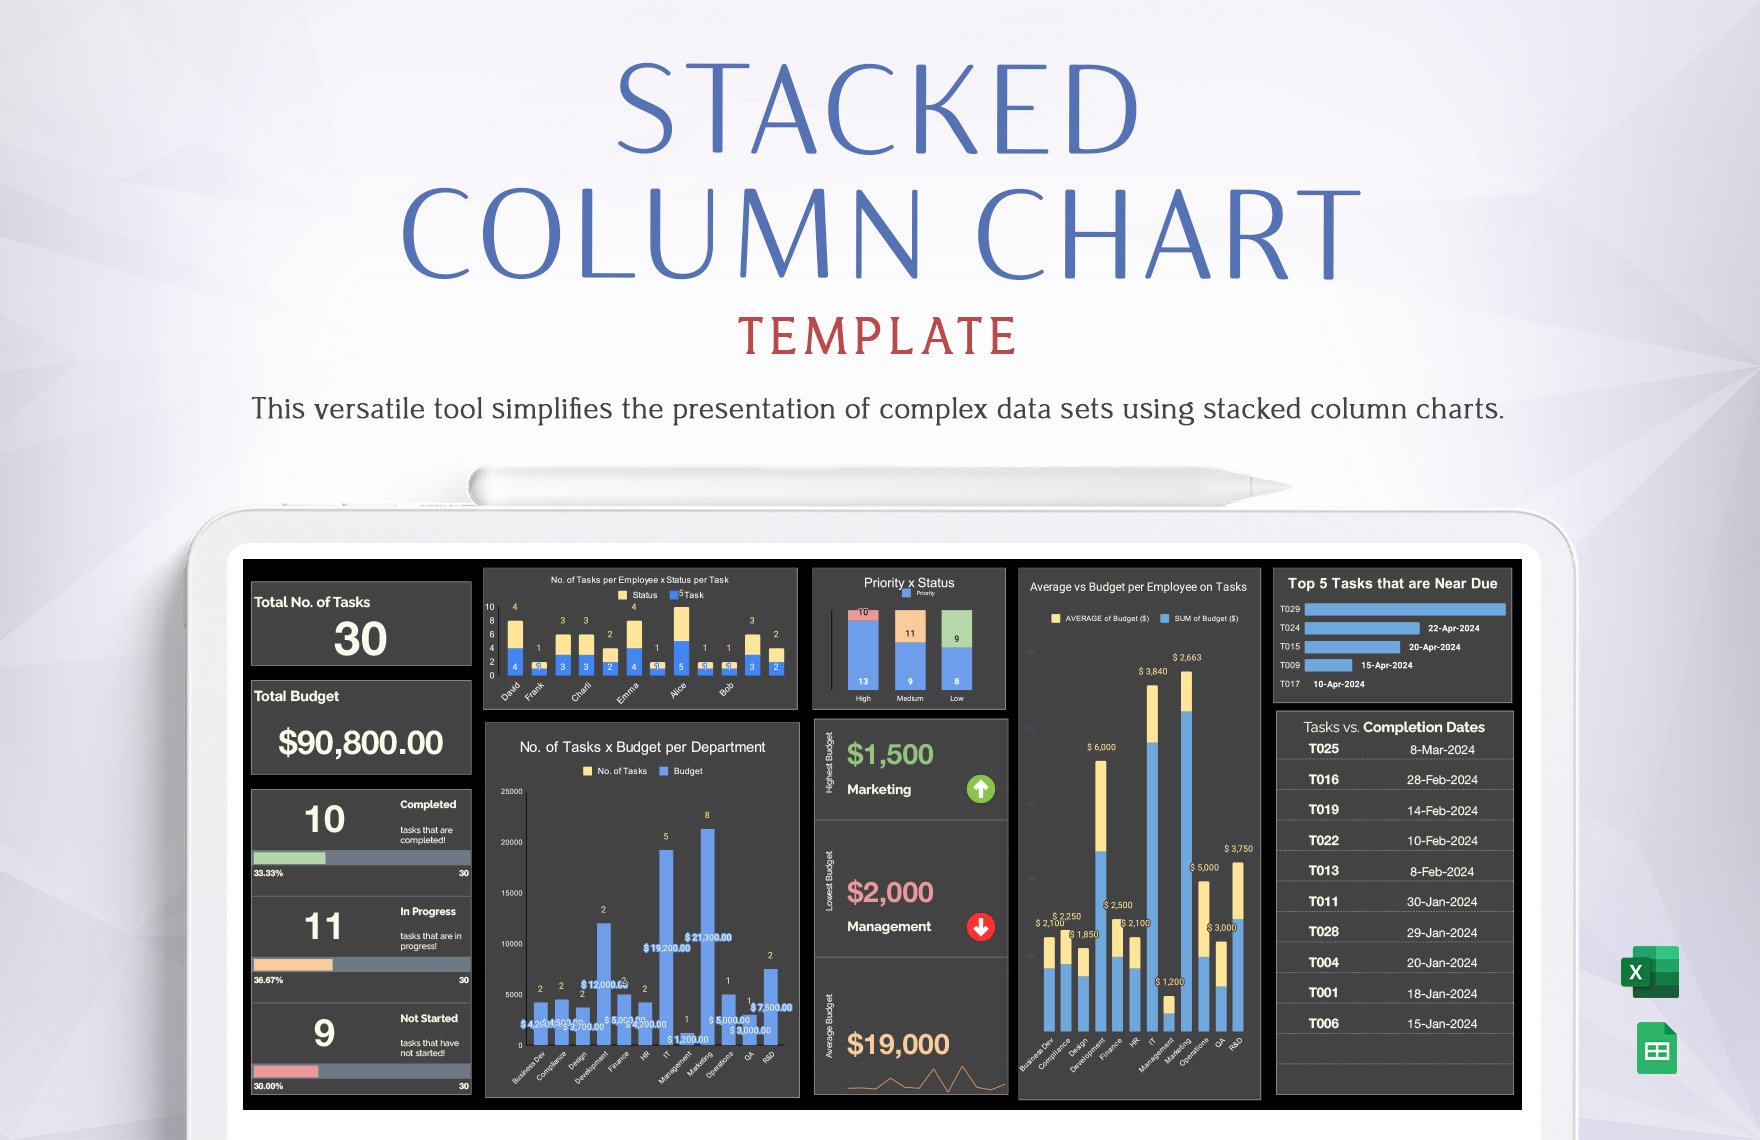
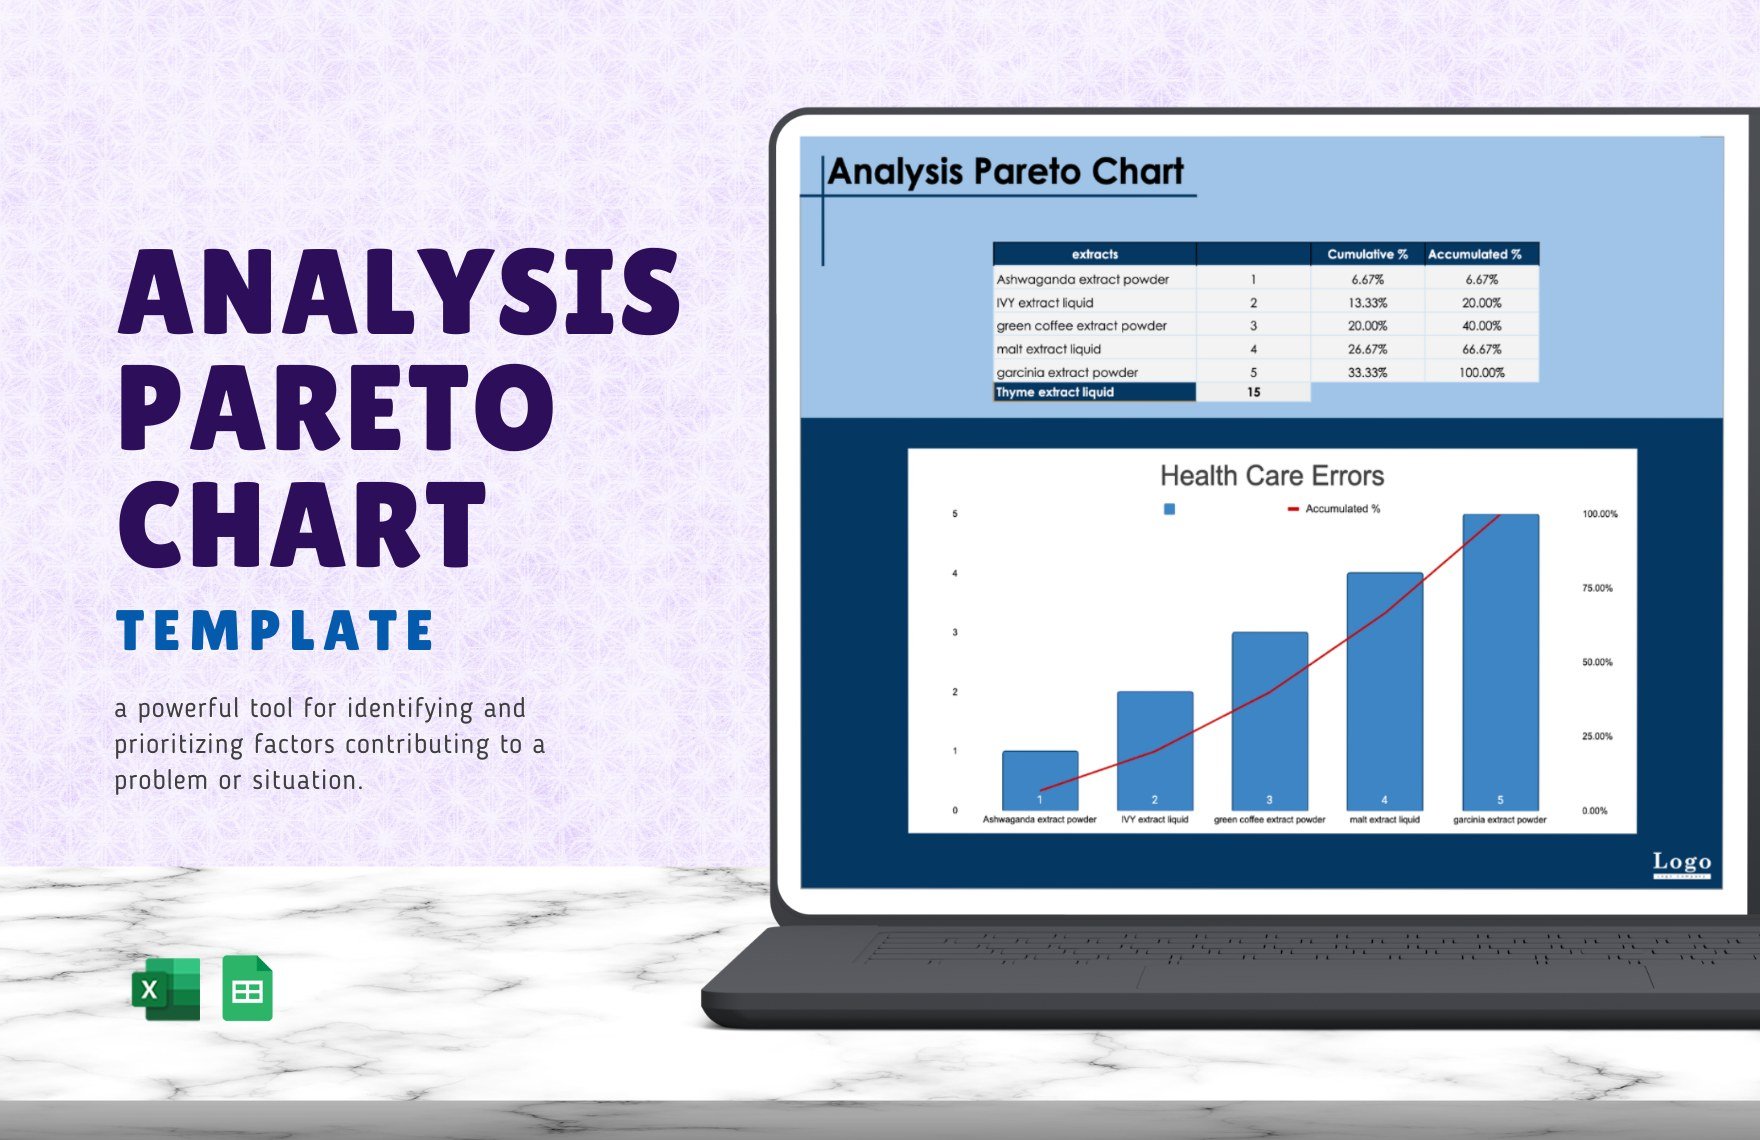
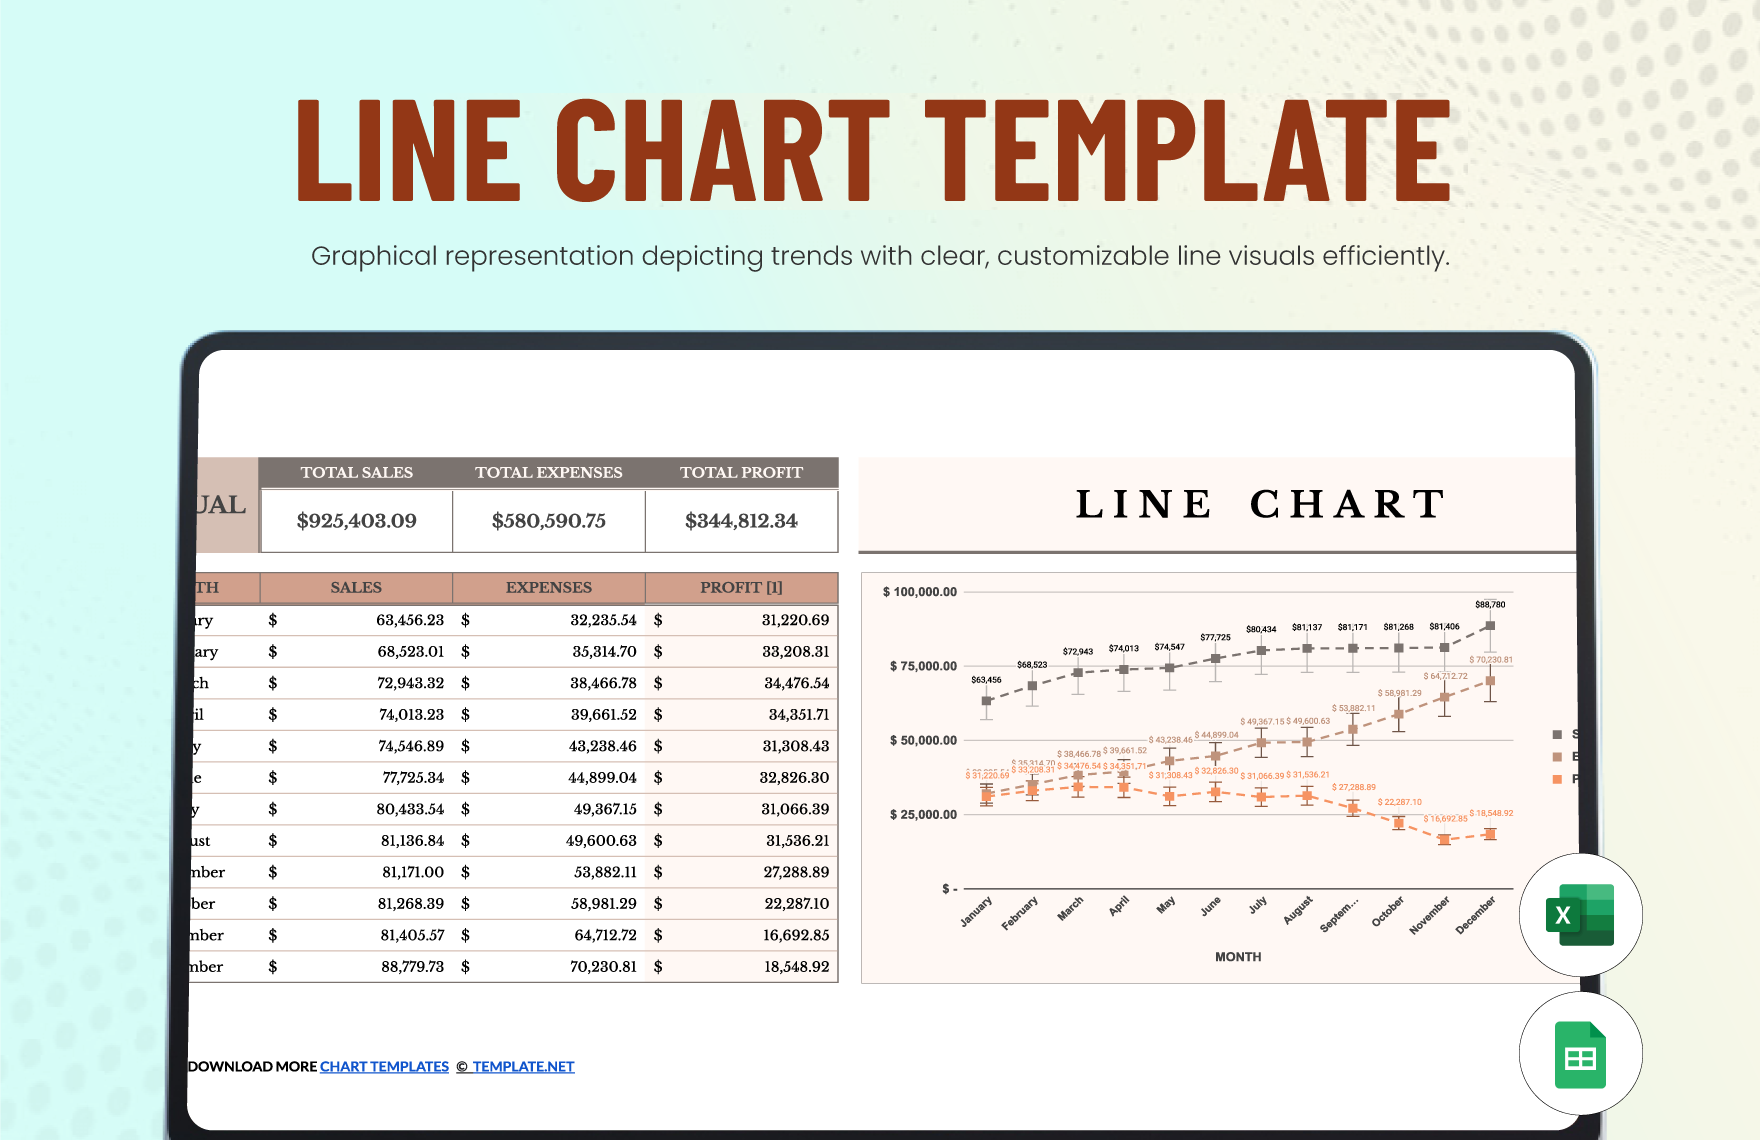
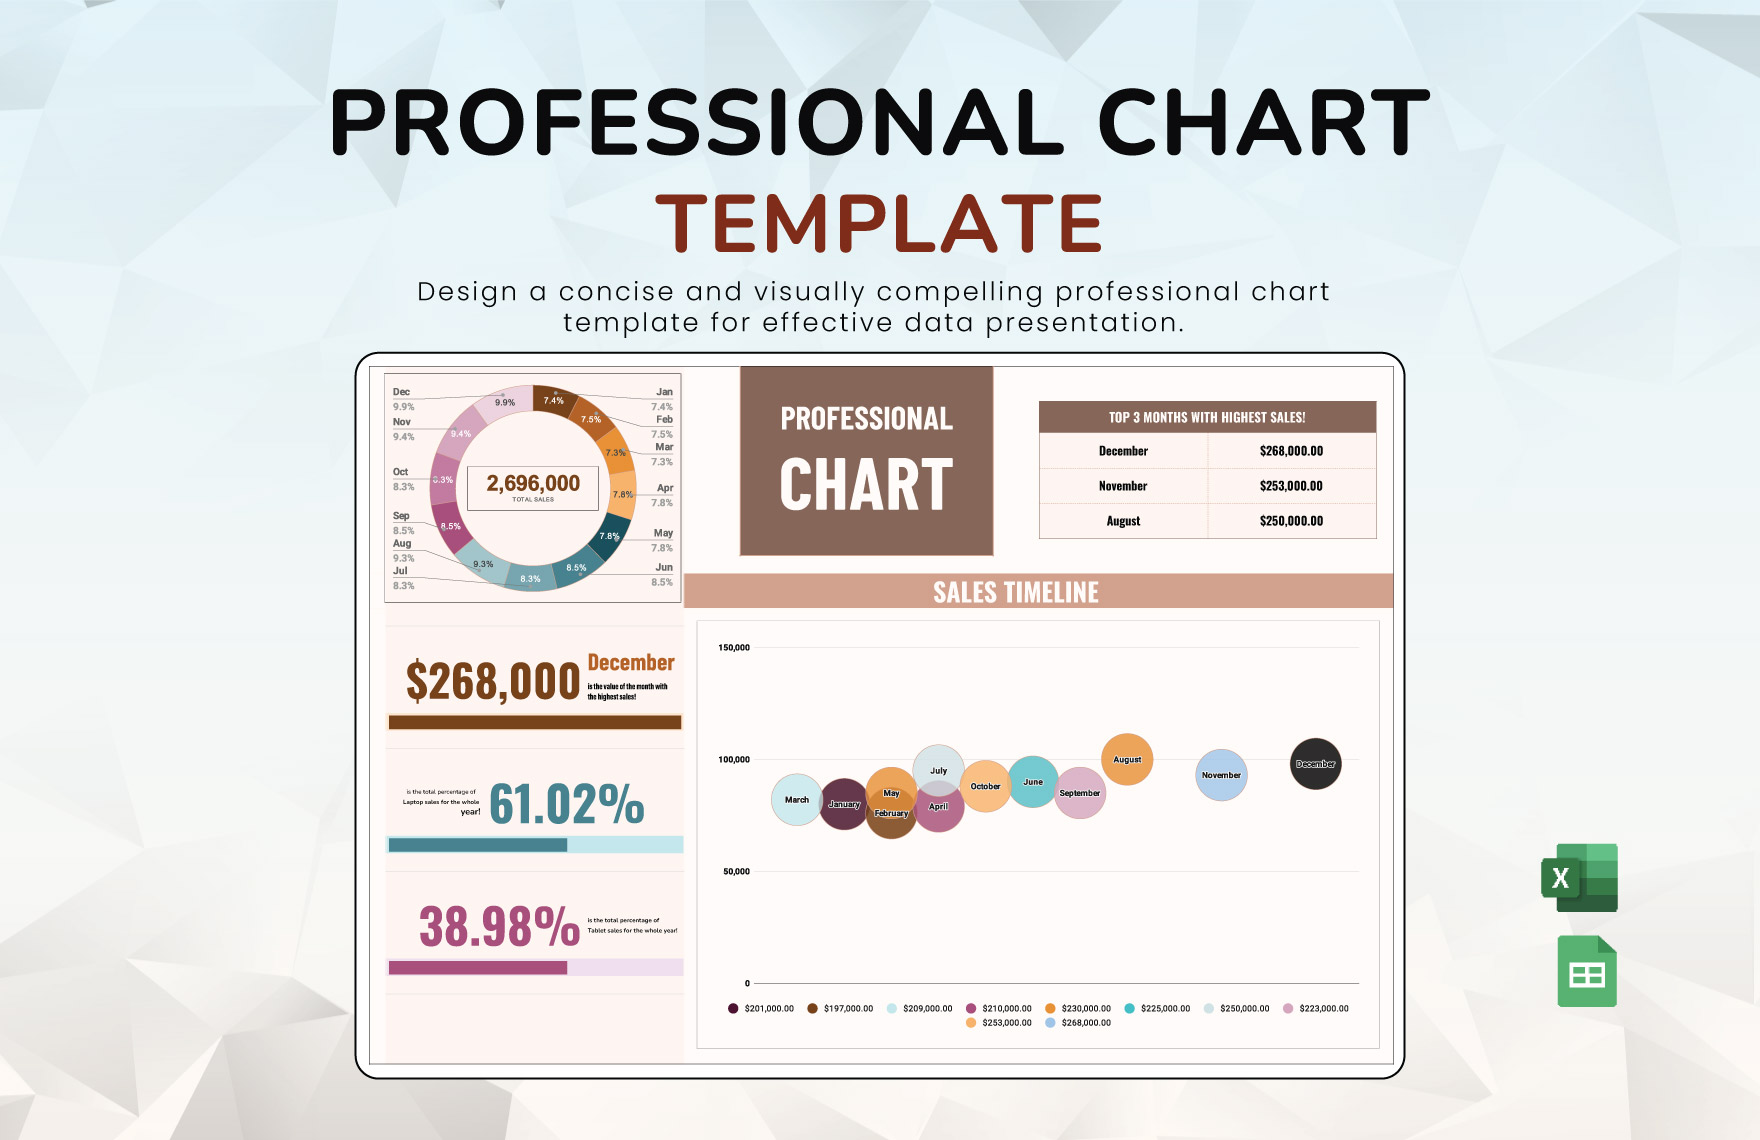
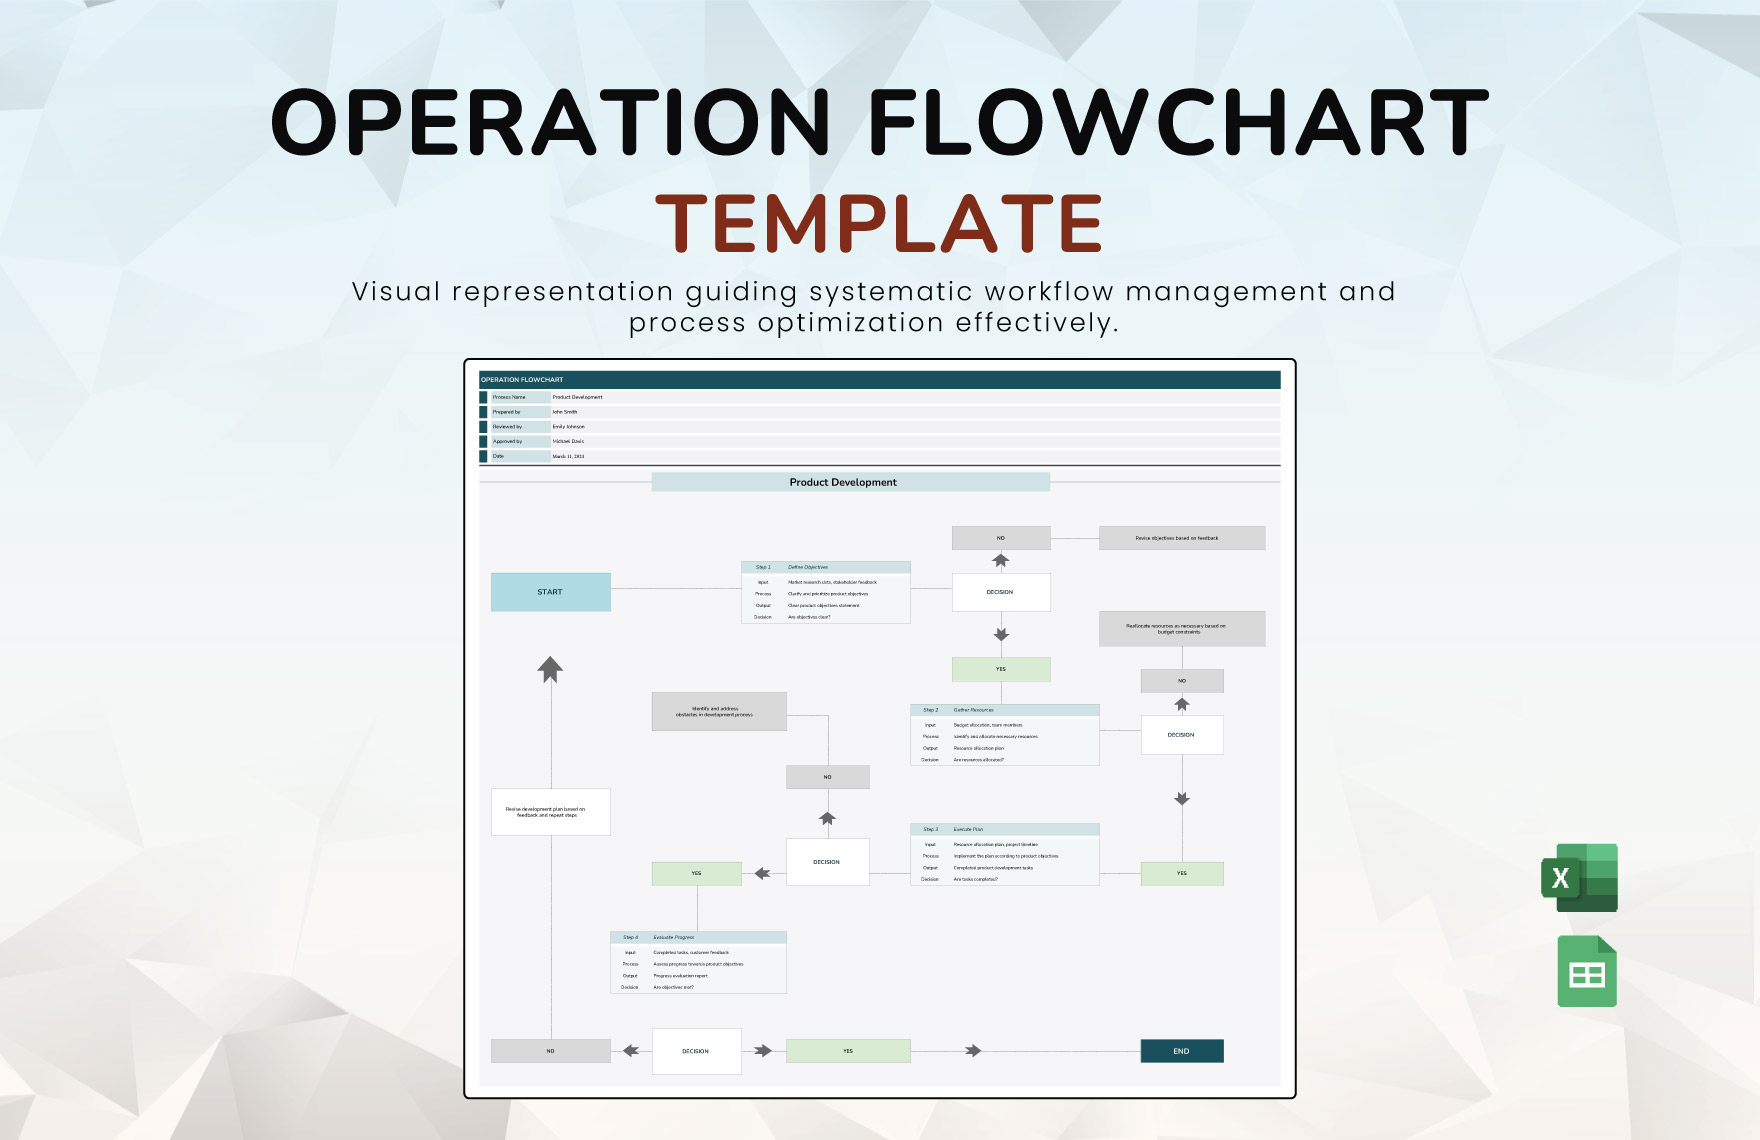
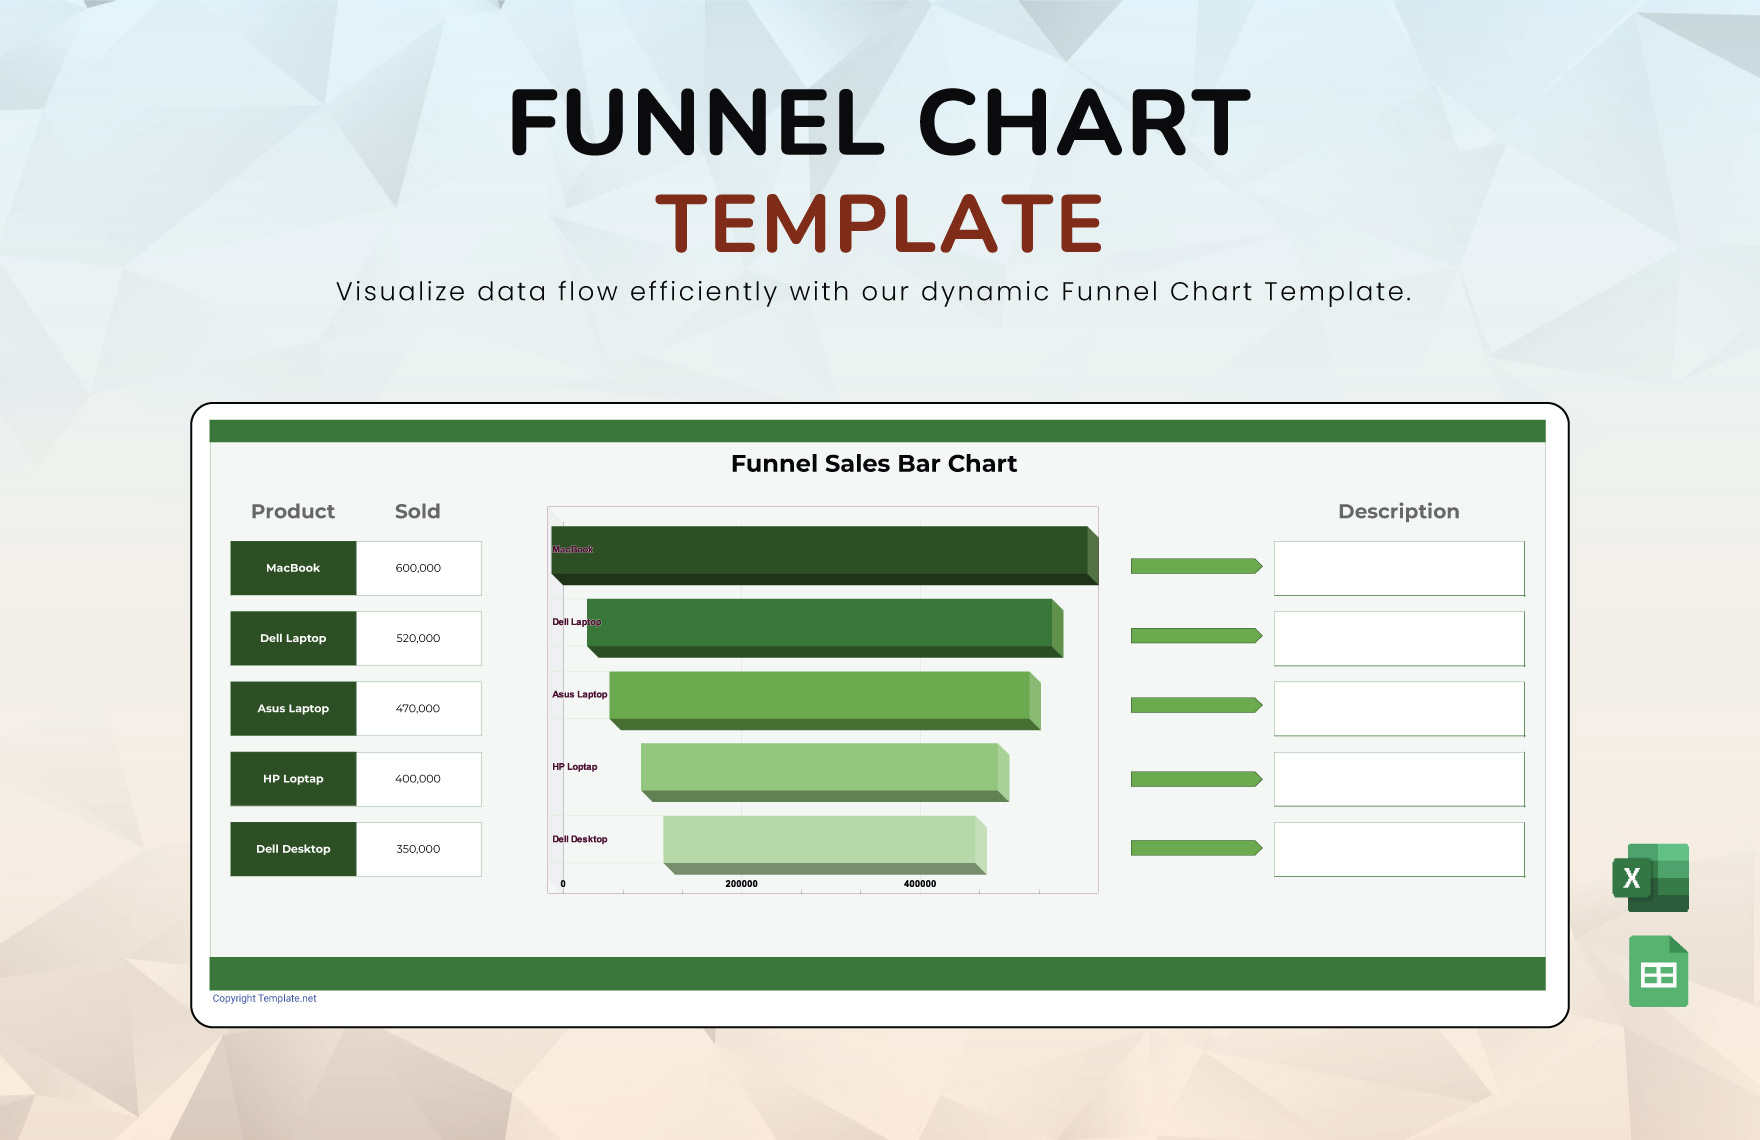
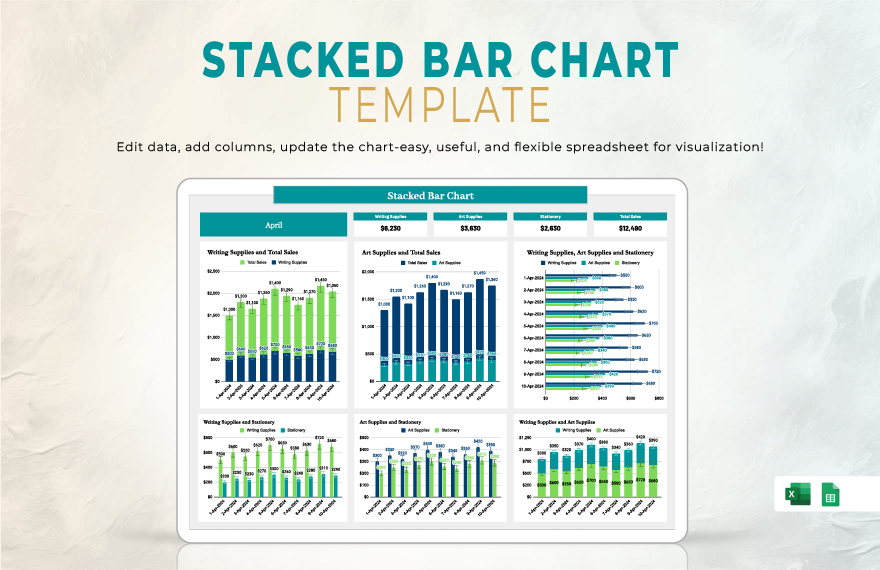
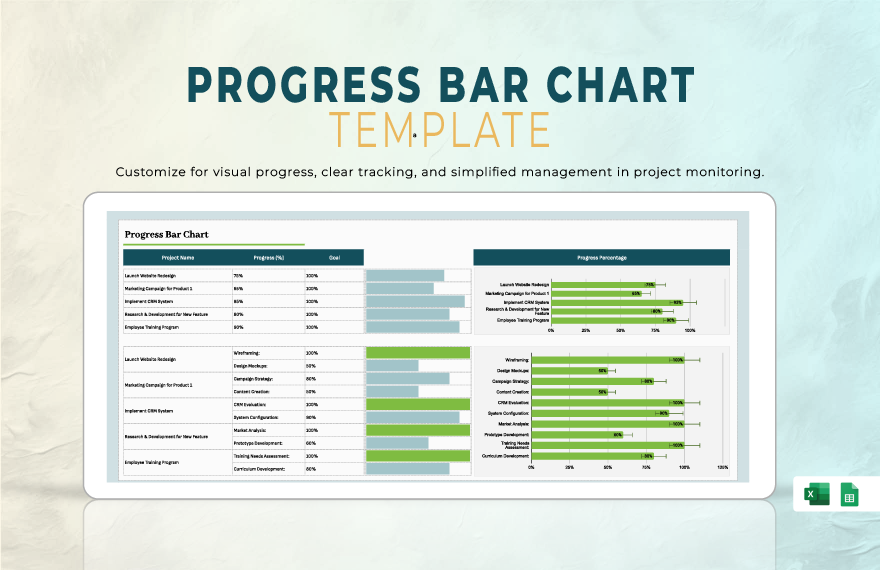
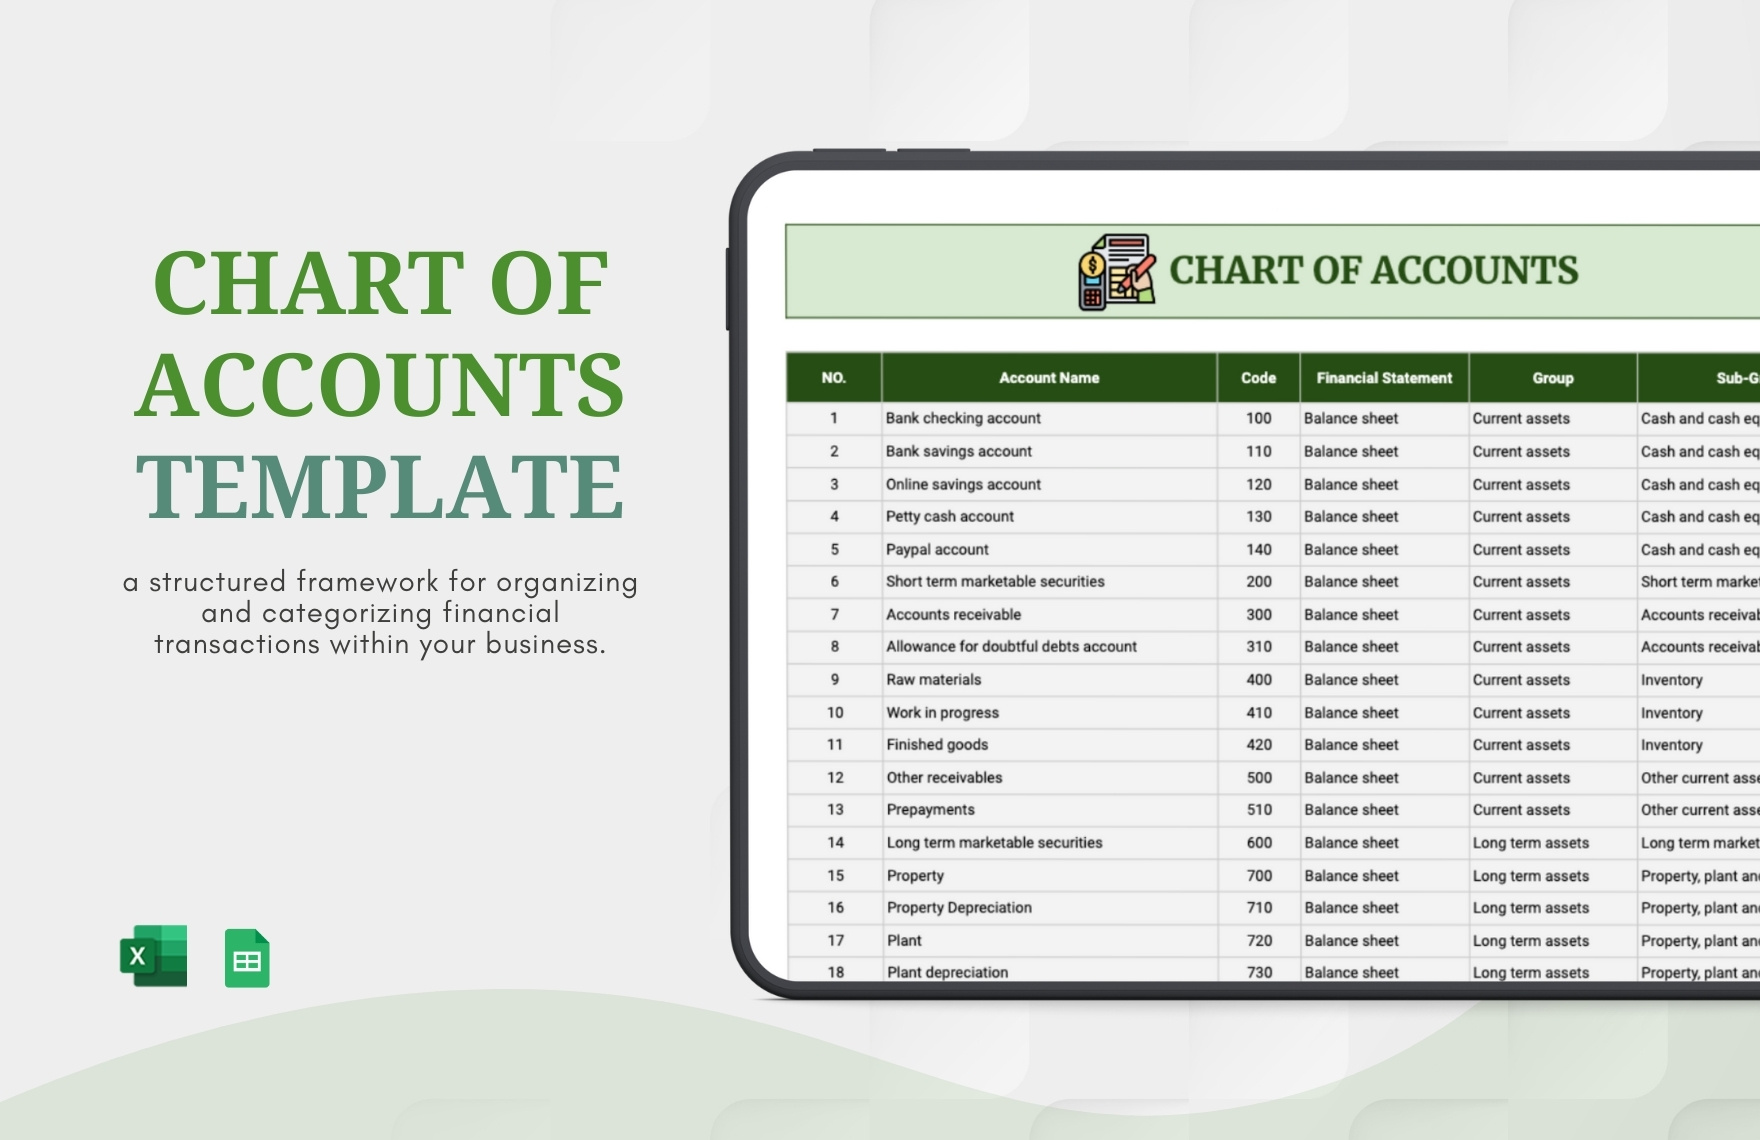
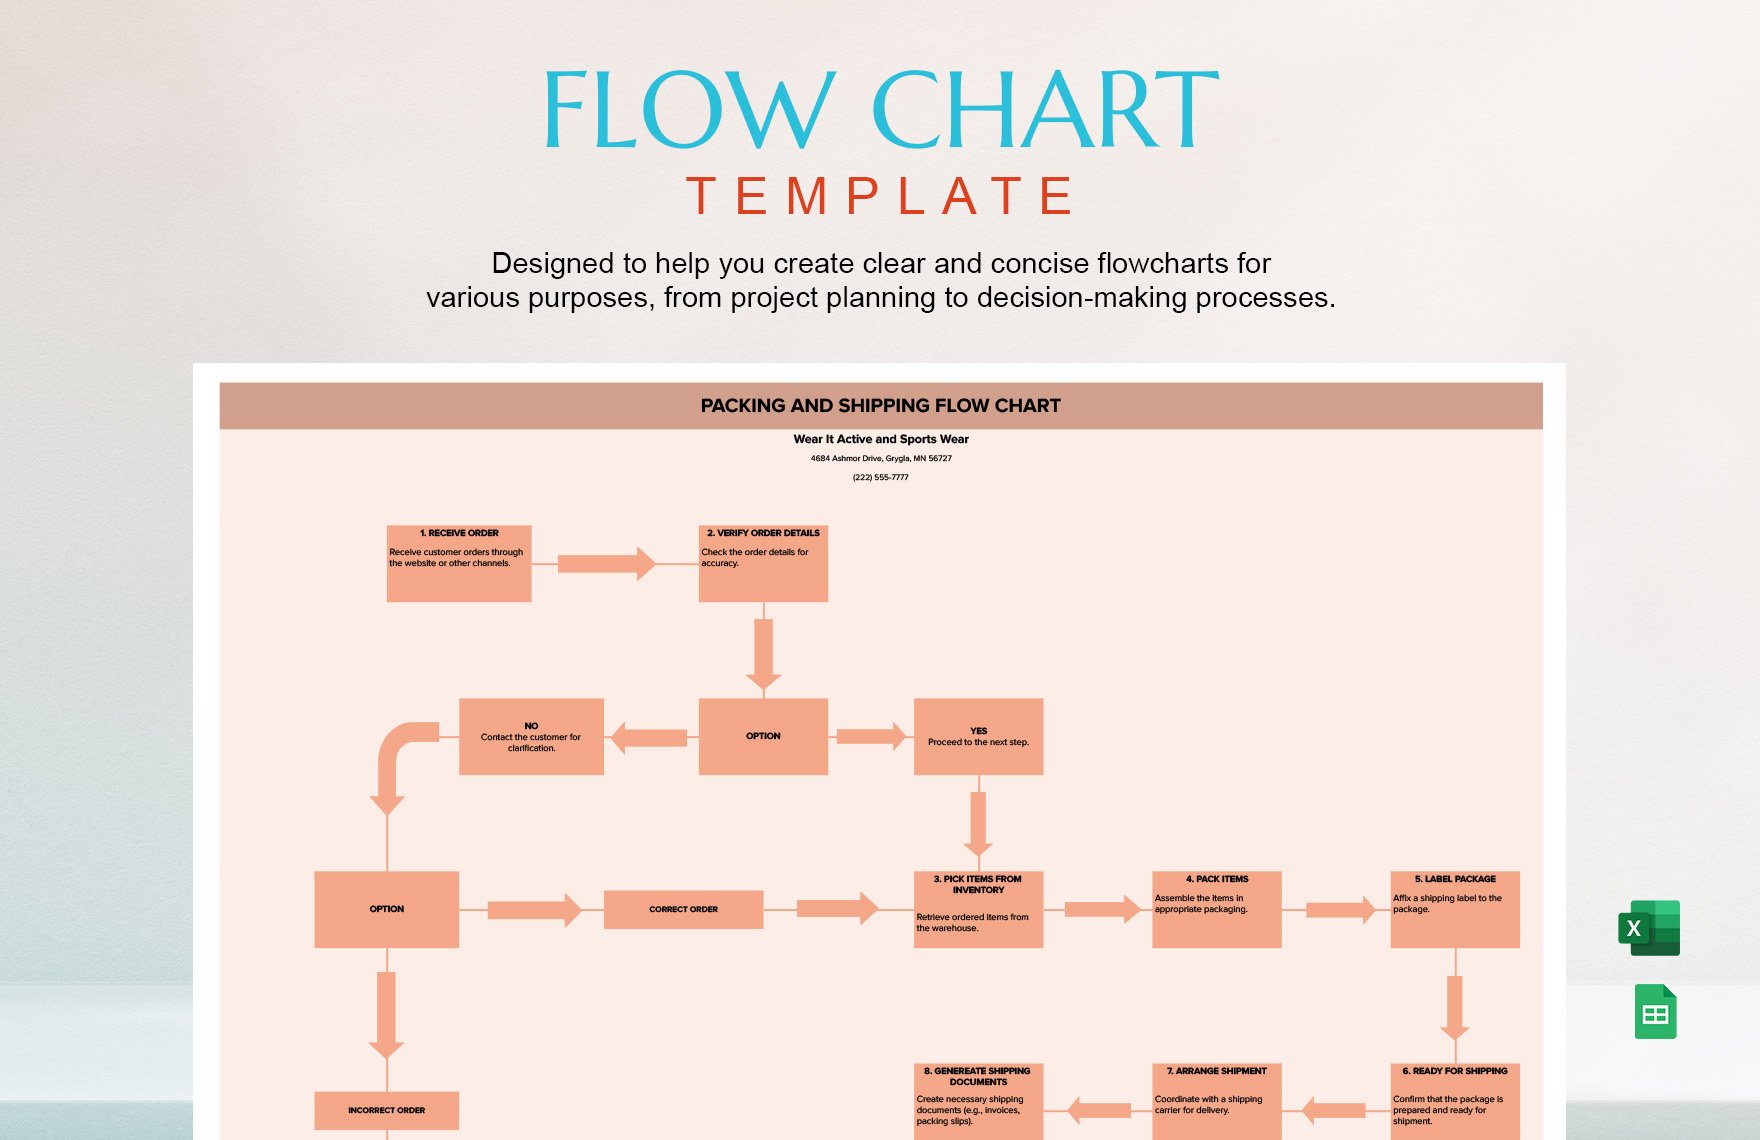
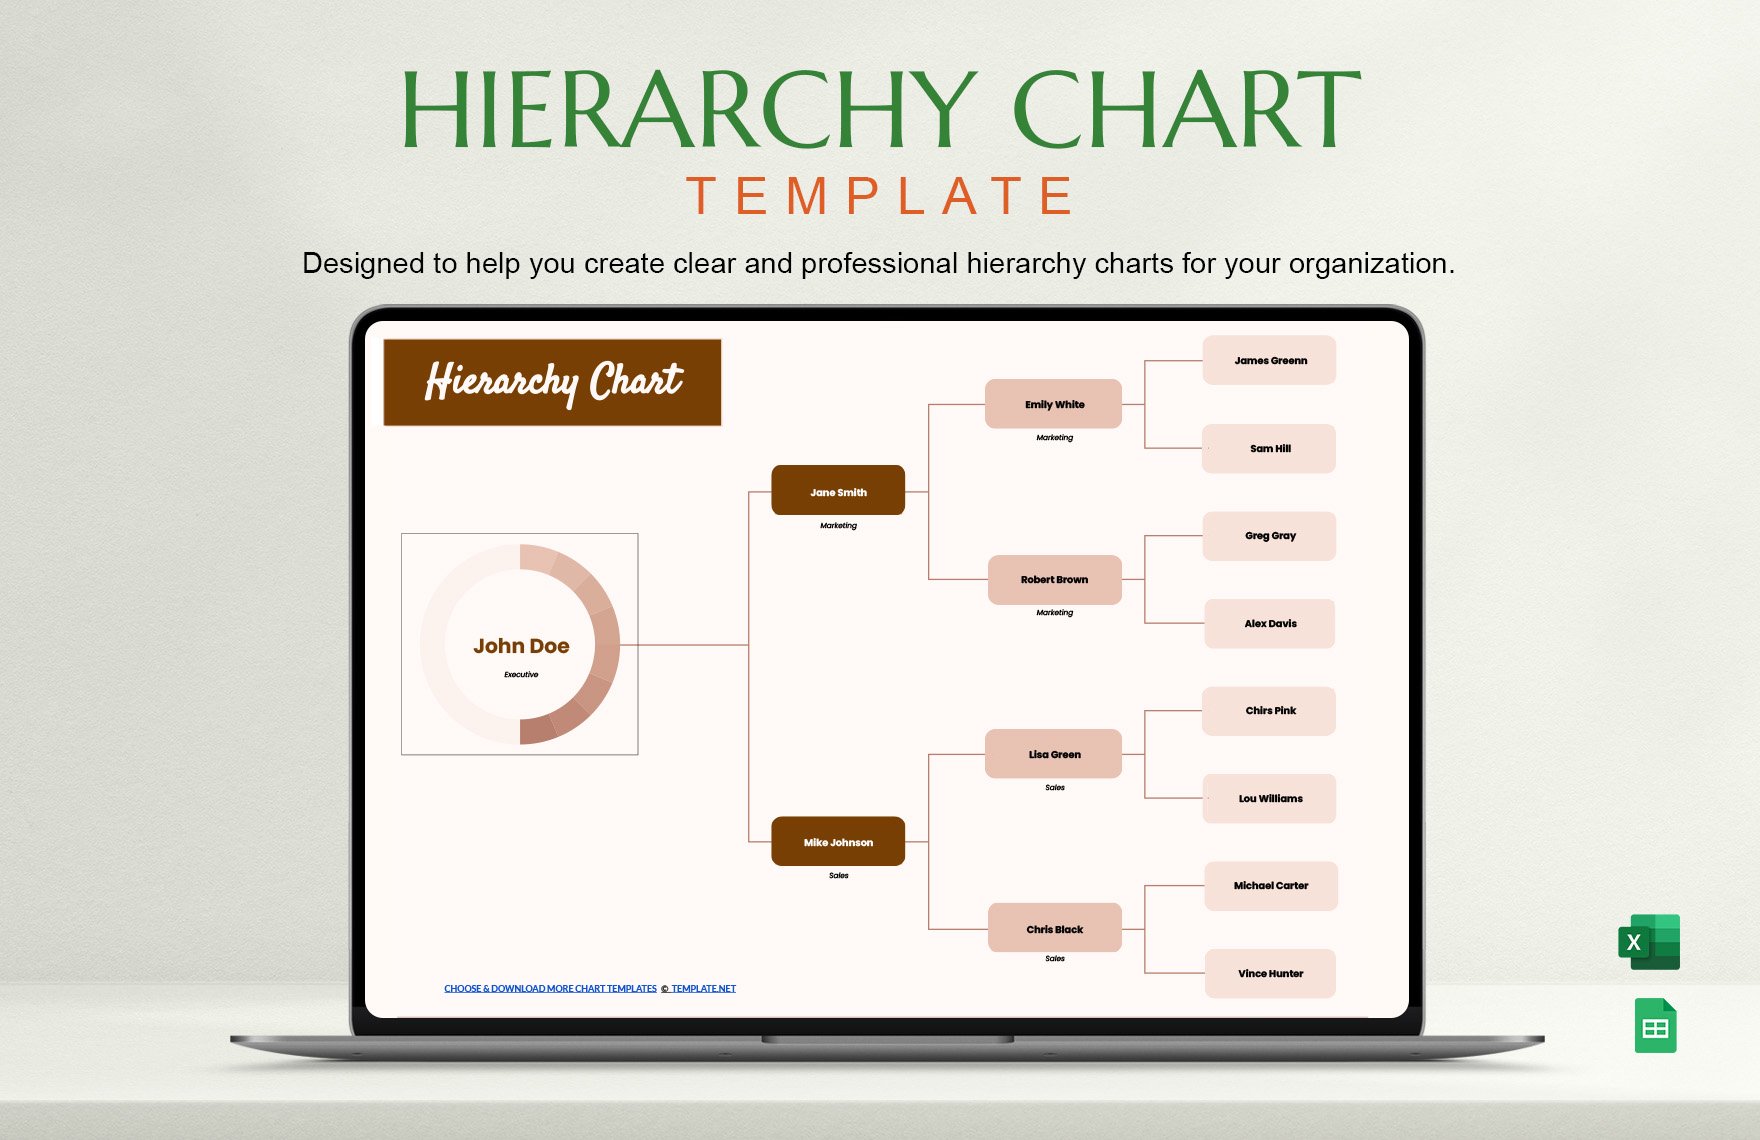
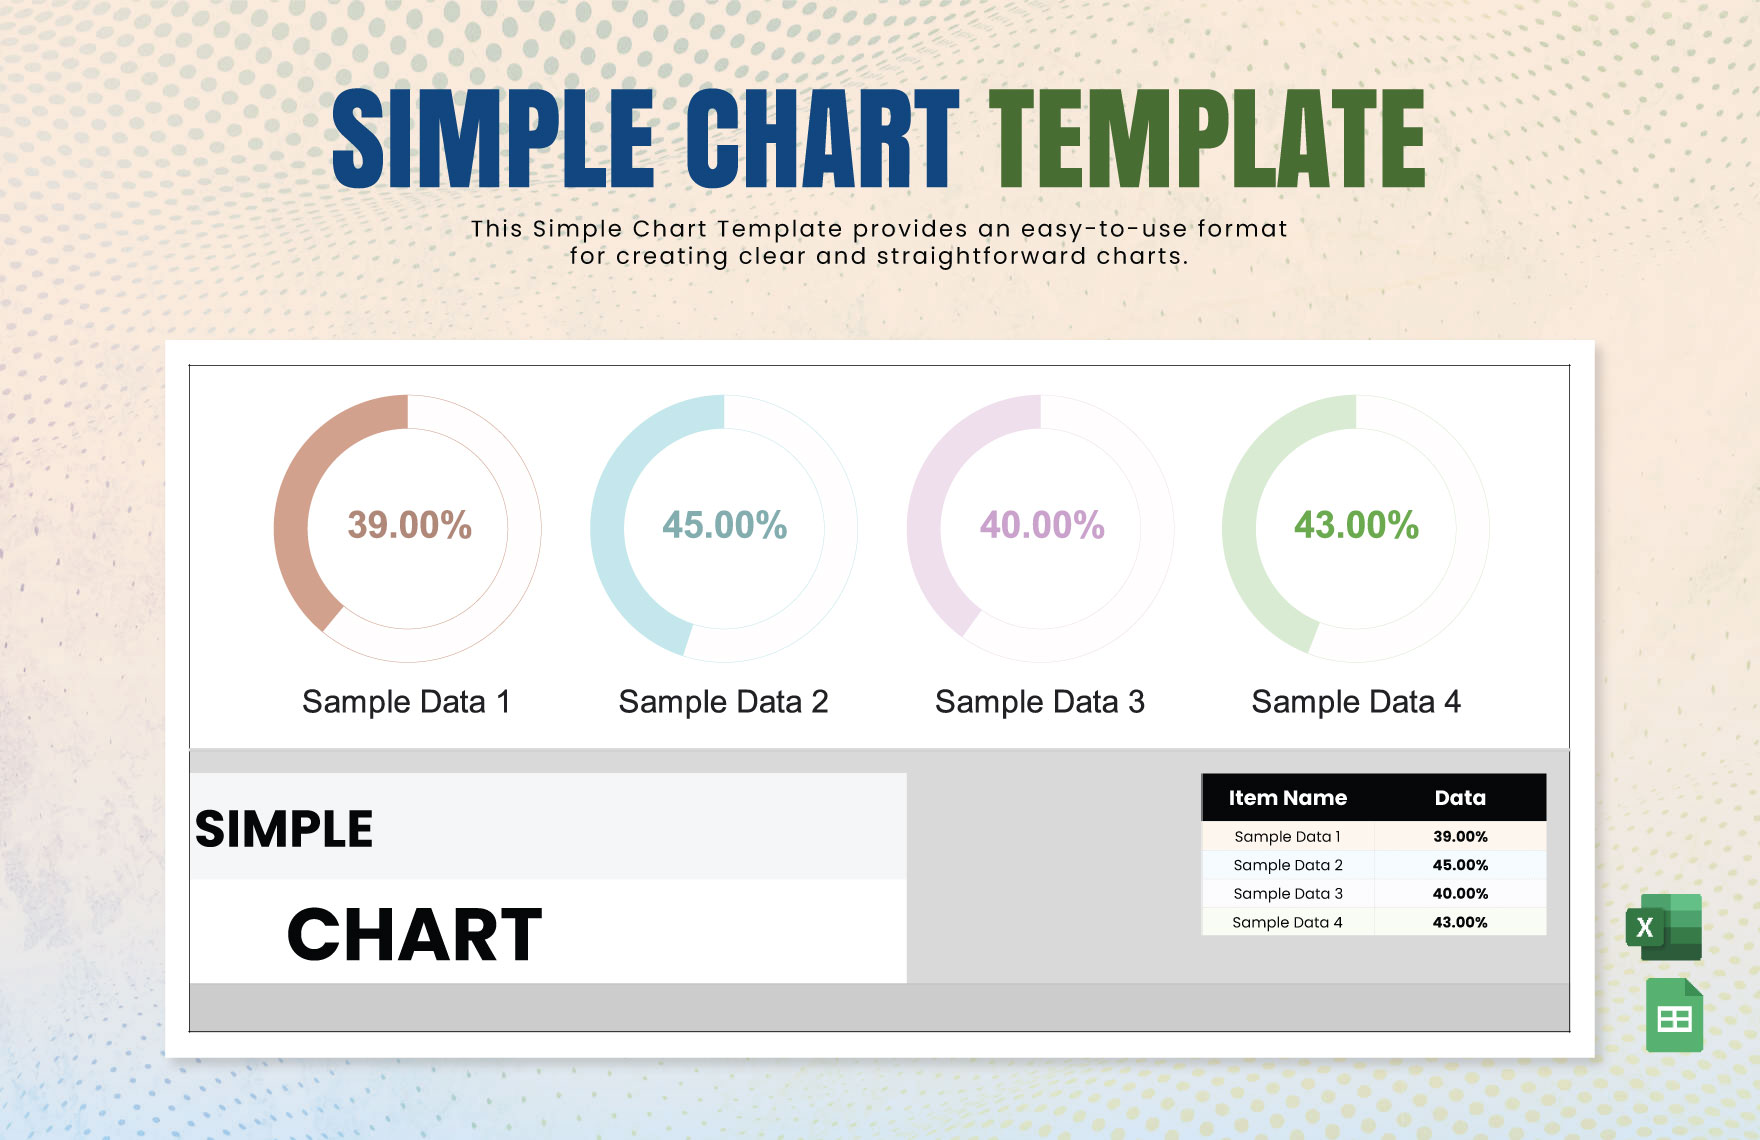
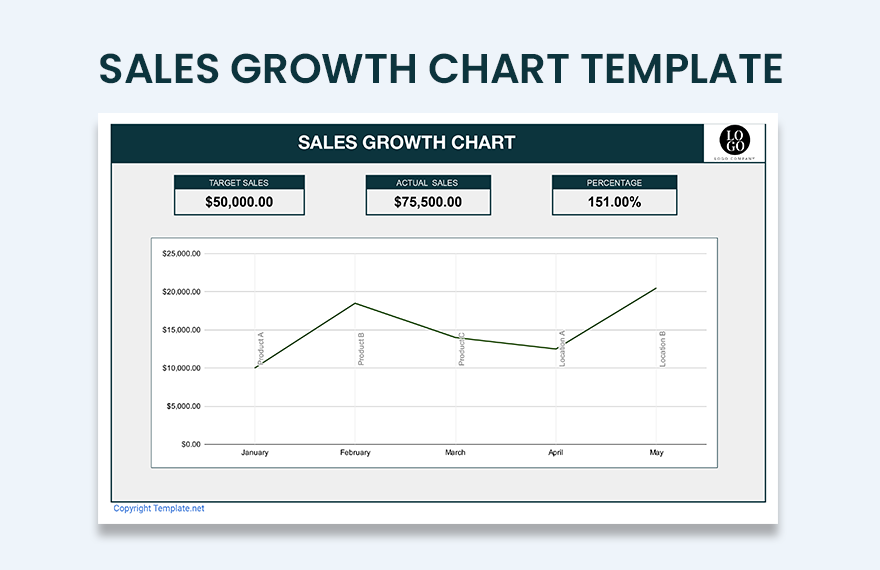
Since we are living in a digital era, charts are important tools to represent data and developing trends in various aspects. To help you with your endeavors, here are our ready-made chart templates that are downloadable and easily customizable in Google Sheets. Get to make professionally designed charts to create a graphical representation of data for analysis or presentations. We have a wide variety of templates including timeline, Gantt, seating, and flow charts. These files are easy to use and fully customizable. They make use of high-quality layout, artwork, images, and graphic files. Available in A4 and US letter sizes. They are also print-ready and are sharable on email and any other online platform.
How To Create A Chart In Google Sheets?
Whether you call it a diagram, an organizational chart, or any chart, your main goal is to present data. For which, the data is a tool to guide the decision-making of an organization. A chart also explains the process flow. For us to help you with your decision, here are a few tips for you to learn how to create a chart using Google Sheets.
1. Identify The Essential Tasks
As mentioned, a chart is also used to guide the organization in its decision-making. Therefore, it's essential to determine what are the things you need to before and after you have achieved something relevant to your goal. In other words, decide on your specific objectives. Remember that there are things you can't achieve if you don't work on the particular requirement for you to make it. Such instances include creating a marketing plan before you reach your highest target sales. Specifying your objectives ensures that you have a clear guide on your path in achieving your main goal.
2. Go Beyond Figures
For you to create the most useful chart in Google Sheets, don't just put figures on your sample chart. You should also include a brief explanation for that figure. For faster comprehension, a pie or bar graph should also have at least 3 to 5 texts. Although symbols help in presenting your data, brief texts also help a lot. Remember that some people would prefer to read your interpretation of the figures you've given.
3. Utilize Our Very Own Templates
We encourage you to use our very own well-designed basic chart templates that are readily available on Google Sheets. As you know, templates are substantially helpful because you won't need to work from scratch. The process of using our templates in Google Sheets is simple. As soon as you opened Google Sheets, click the "Template Gallery" and choose the chart template you like. Then, A copy of the template will show up.
4. Use Thicker Borders
Especially when you're creating a Gantt chart, this is primarily useful for you. Especially when you want to separate your data, use thicker borders. If possible, use a two-layer border. Not just in monitoring your health status, but also in tracking the growth of your business. When you use thicker borders, your details are also clearly separated from each other.
5. Complete The Task Using Google Sheets
As soon as you have chosen a template in Google Sheets, you may already customize it. Google Sheets work similarly to MS Excel. All you have to do is to select a group of cells where you will put the data. Then, go to the "Insert" menu and select the "Chart" button. Afterward, go to chart types and begin customization. All these can are possible using Googe Sheets. Well, with our well-designed chart templates available, you can conveniently complete your task in no time.


