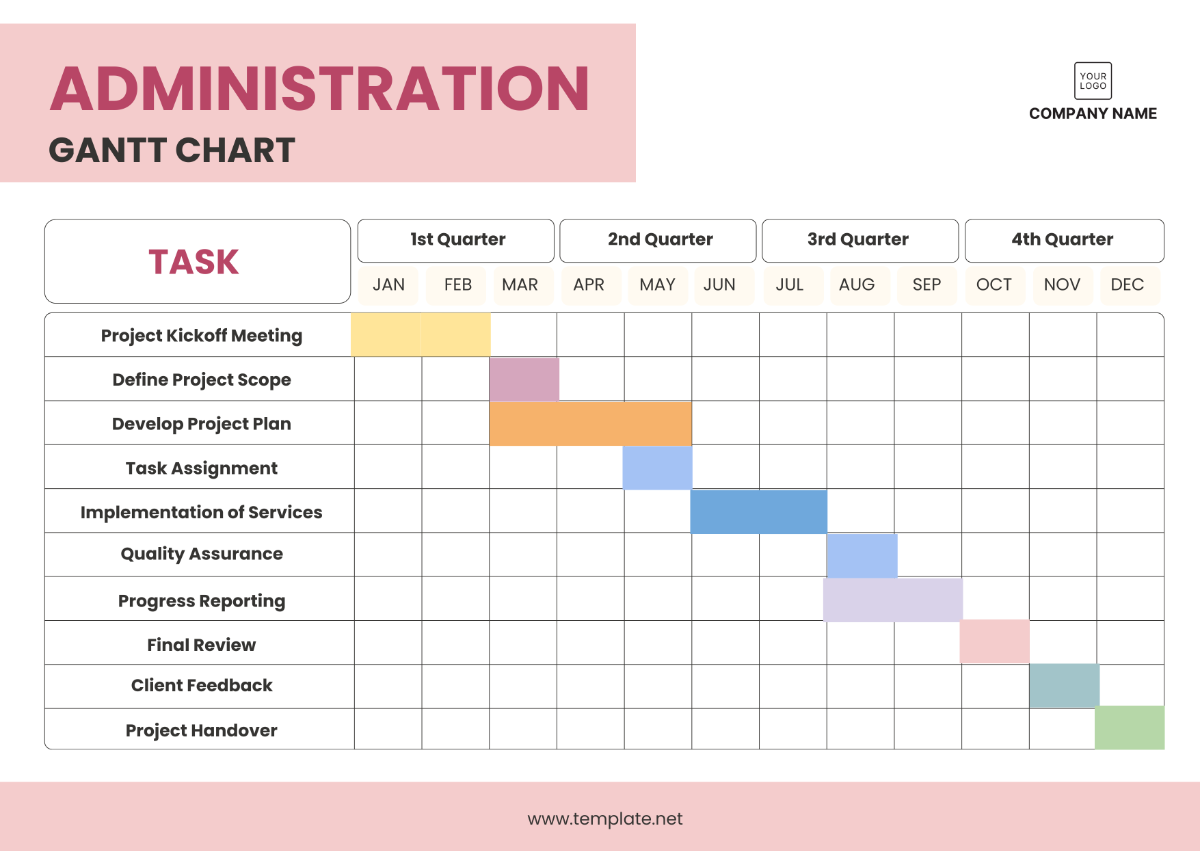
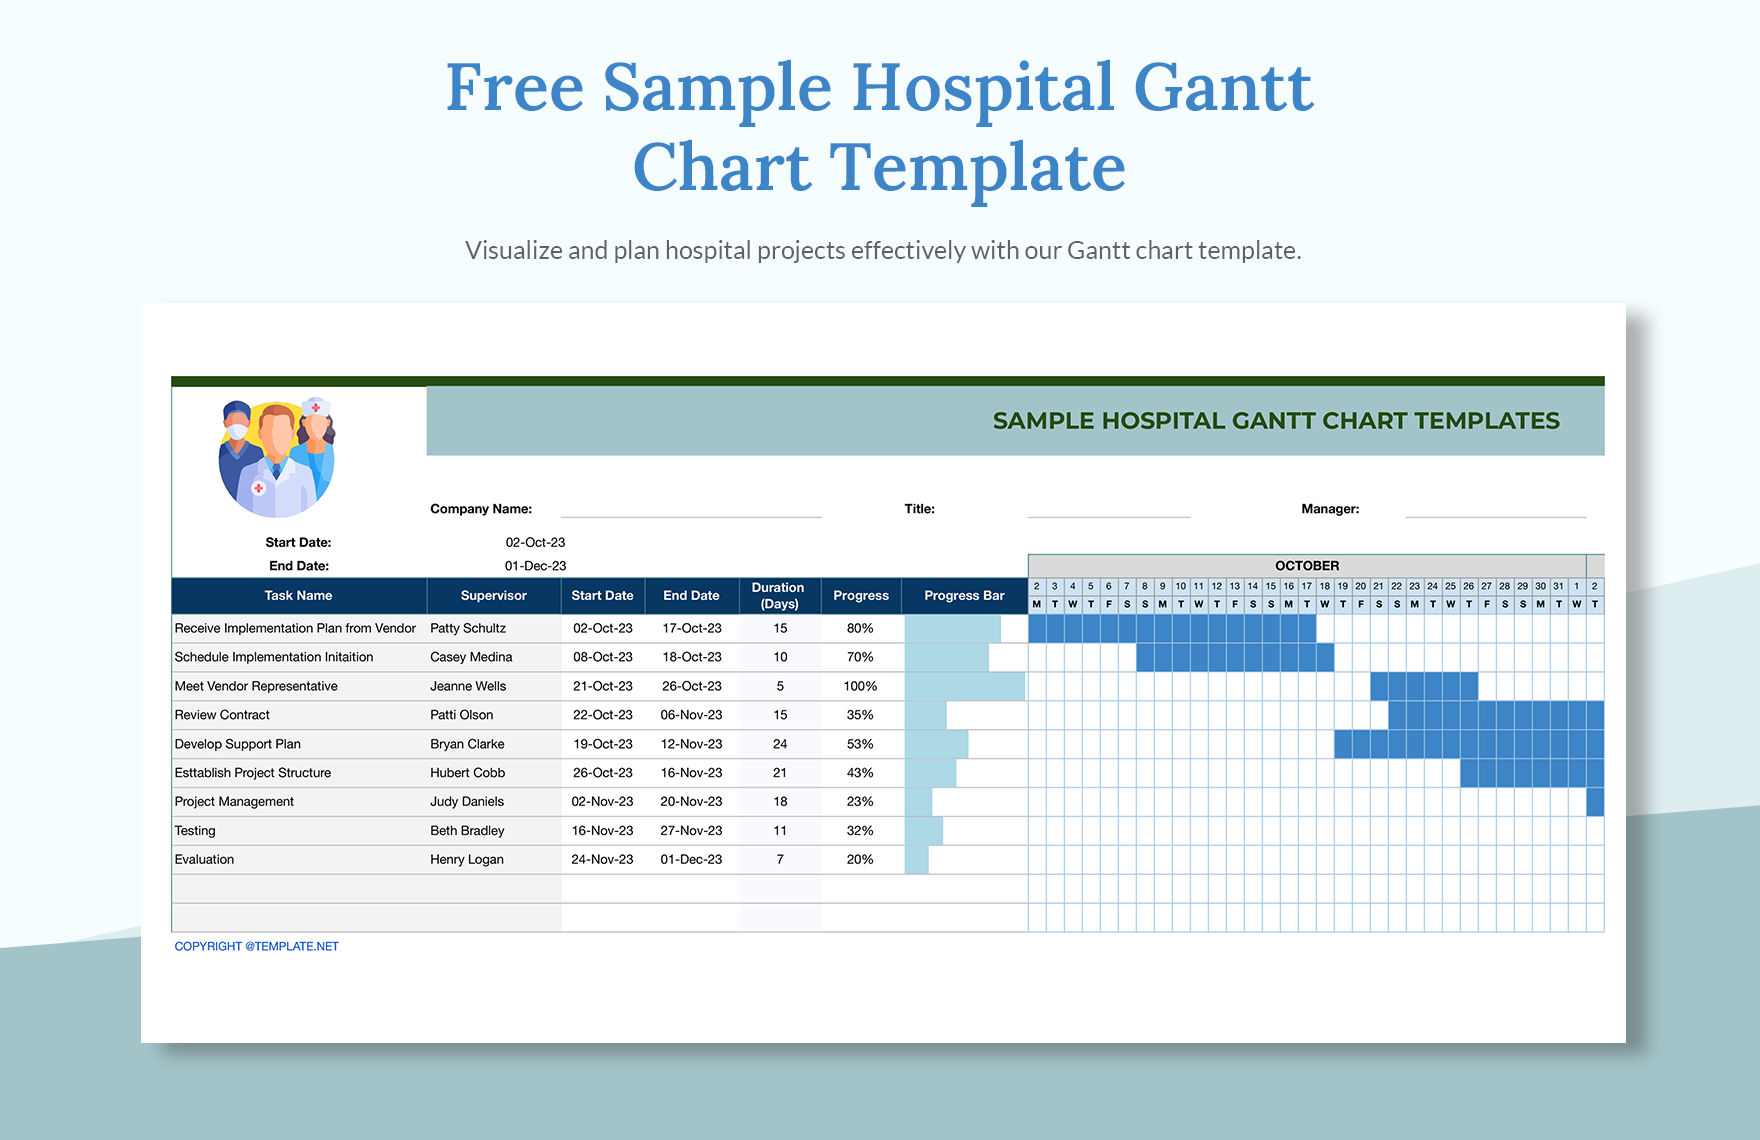
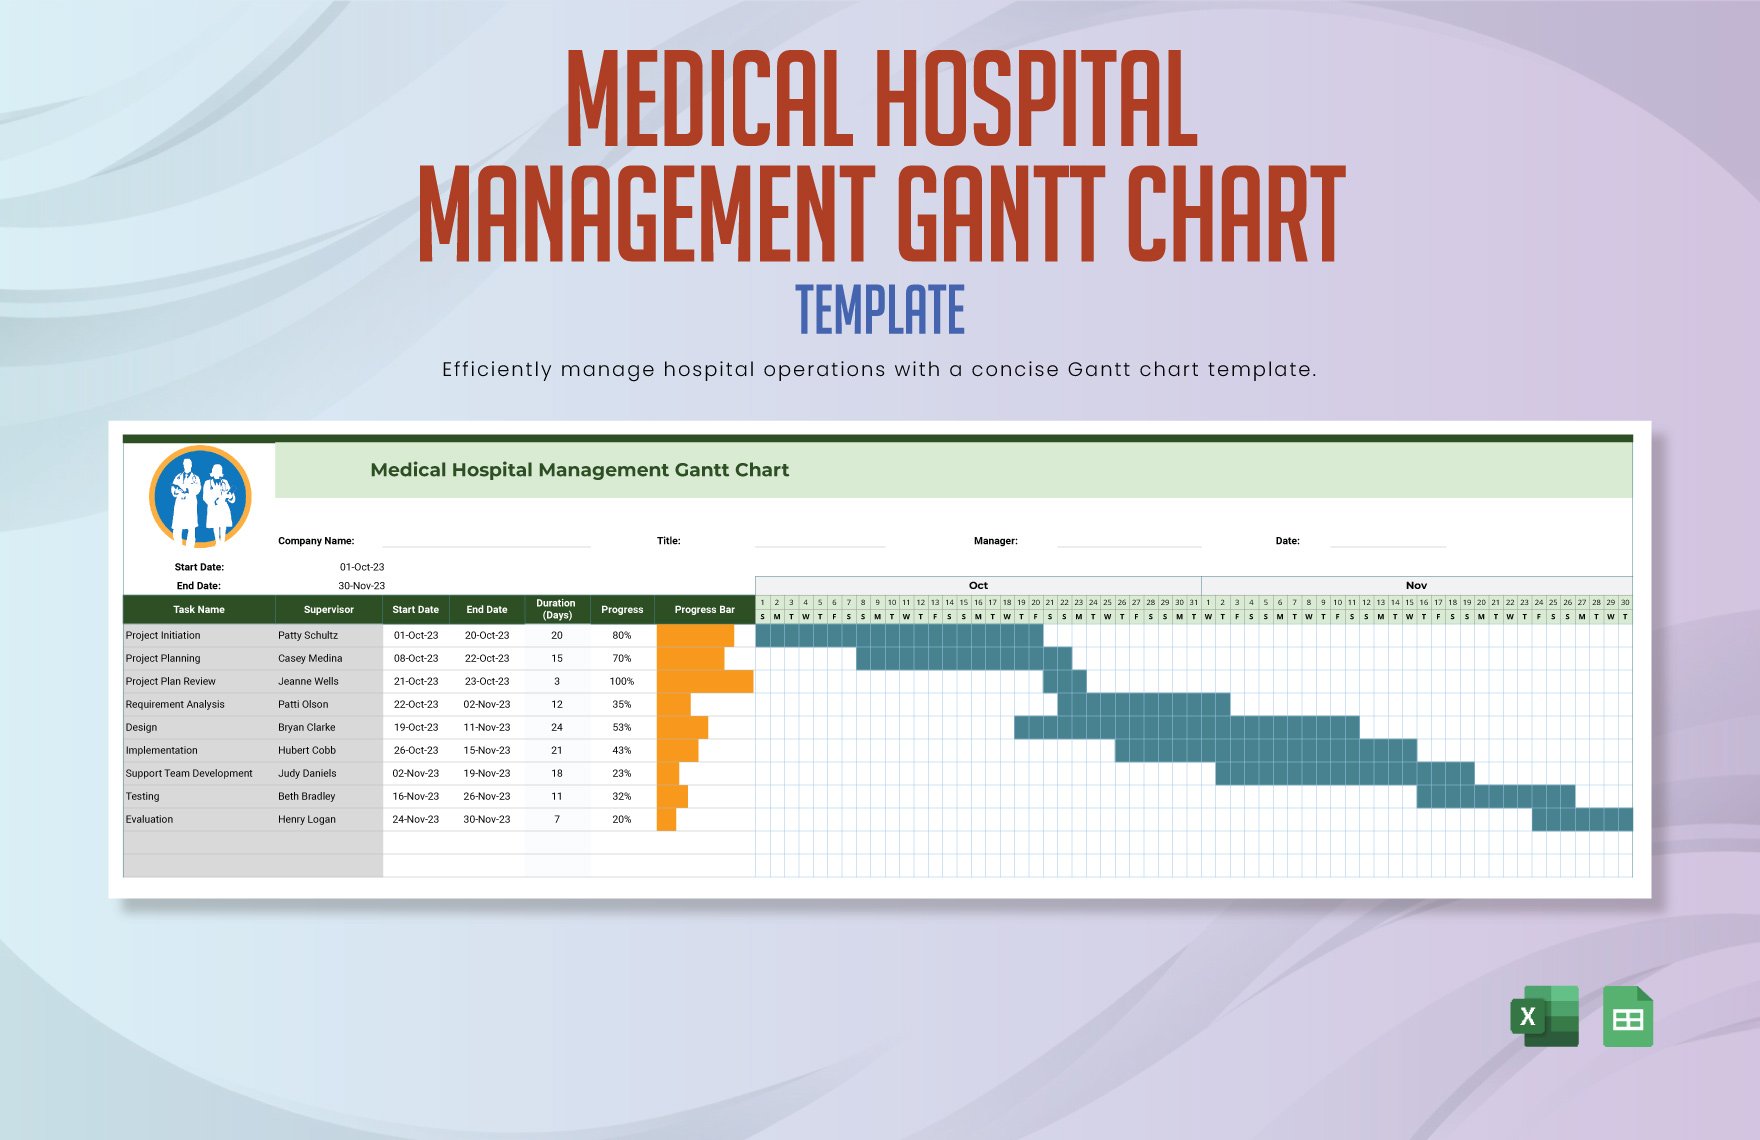
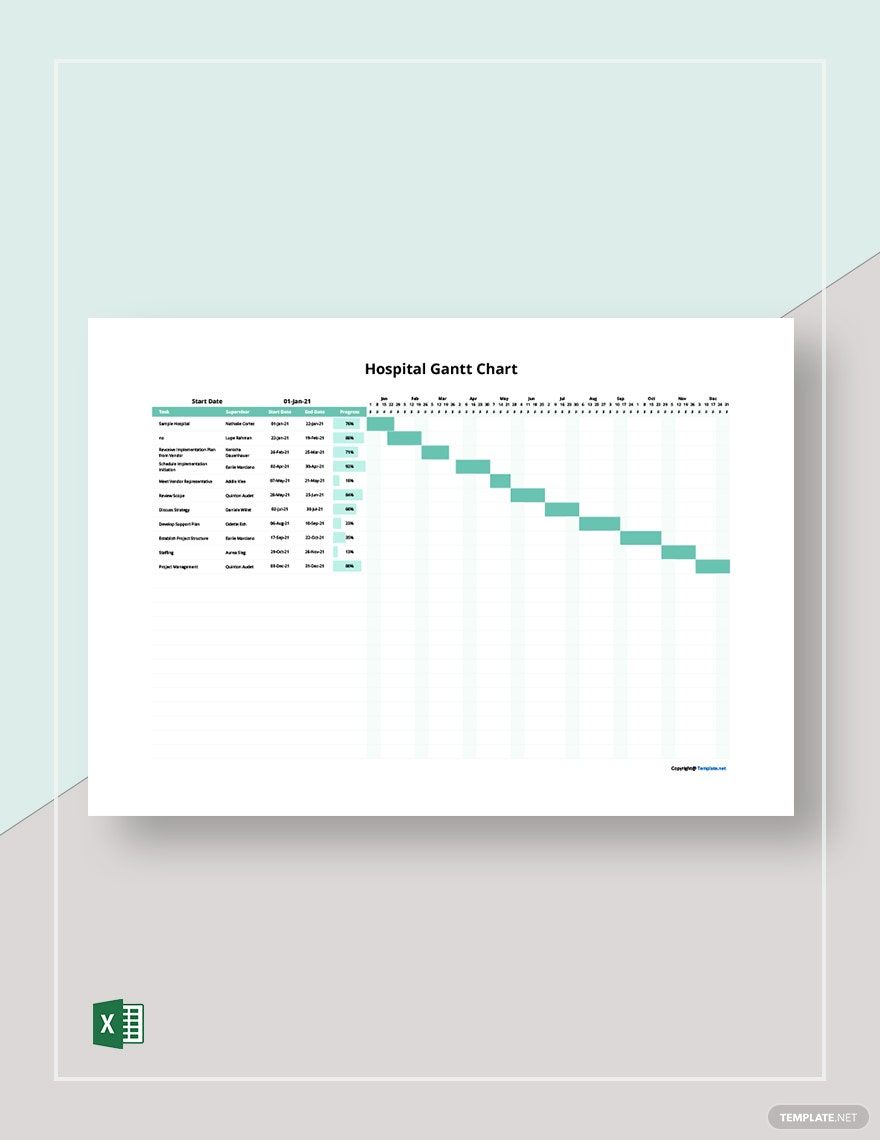
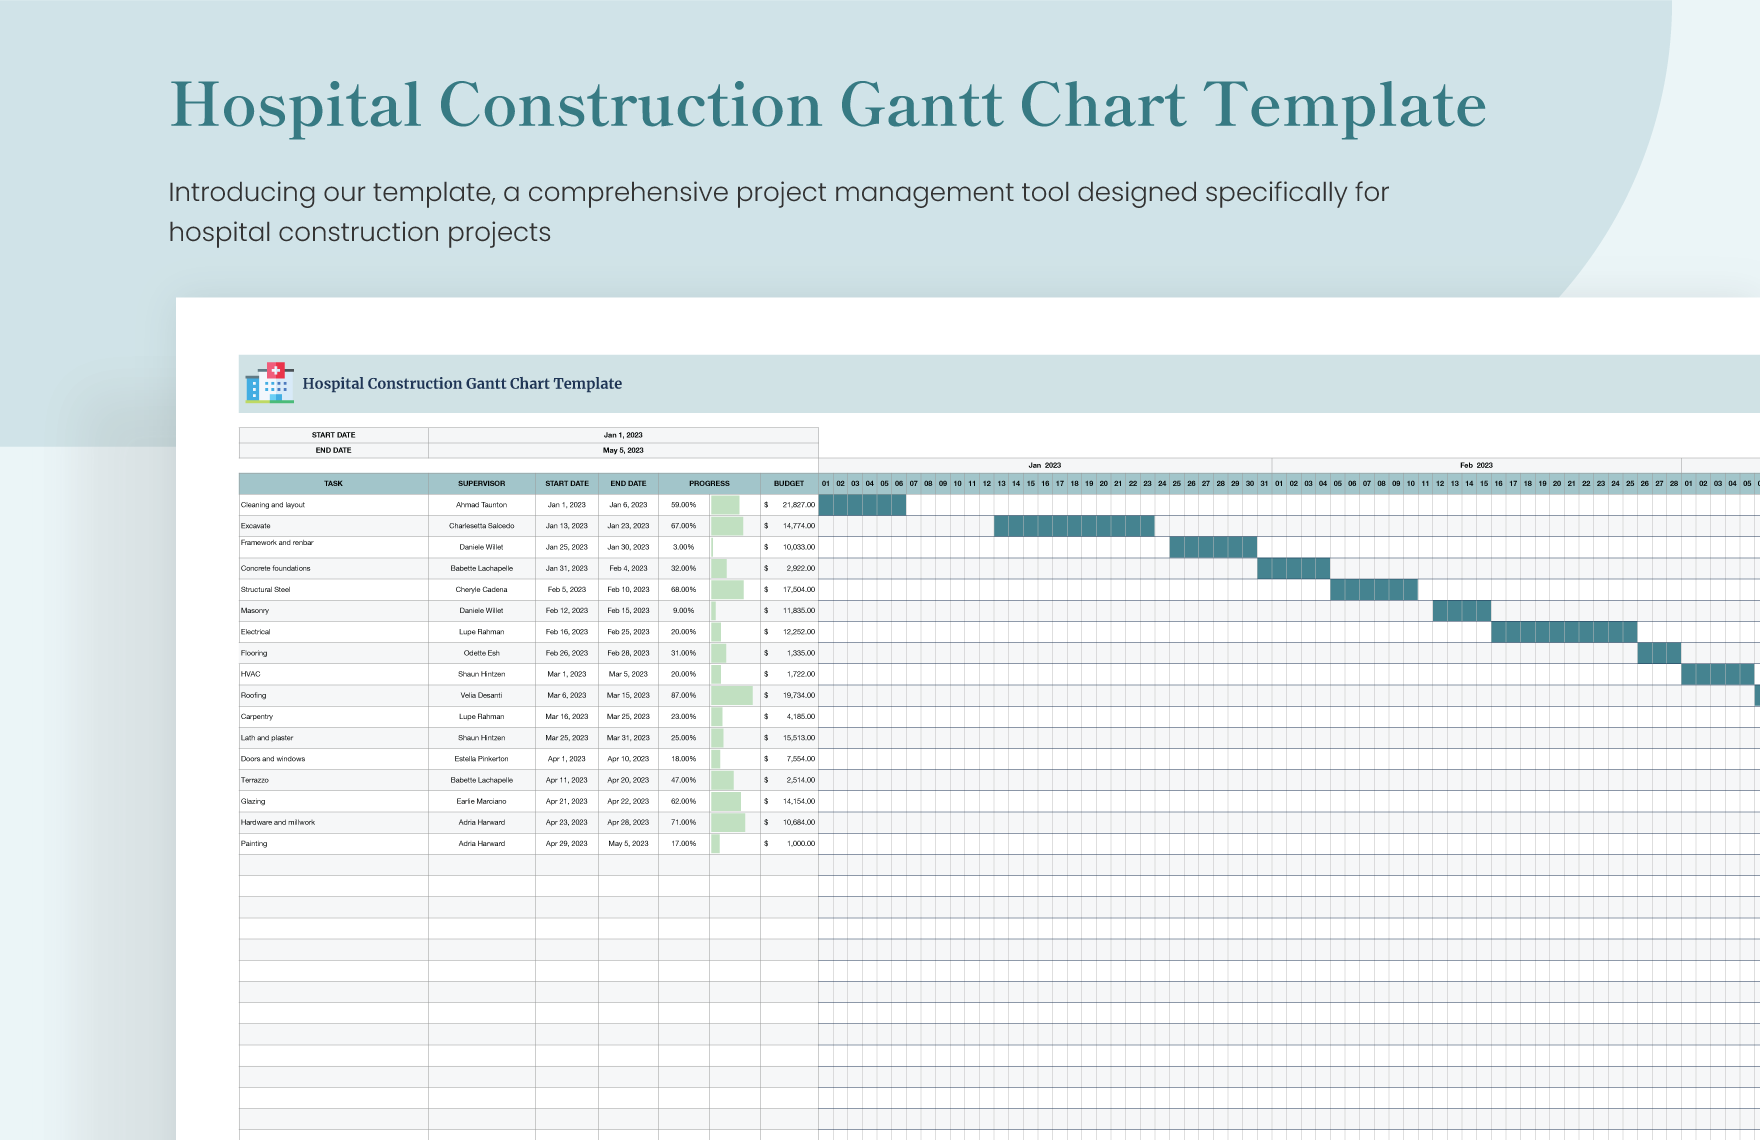
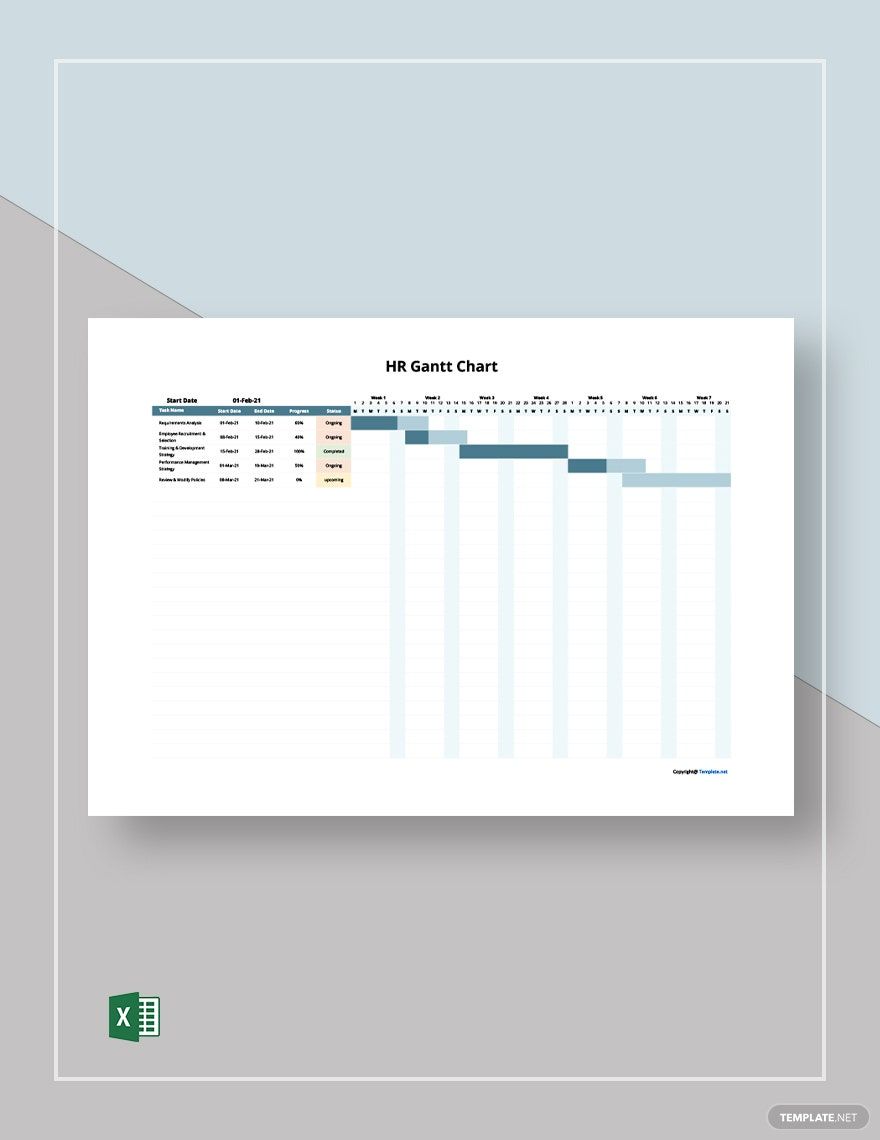
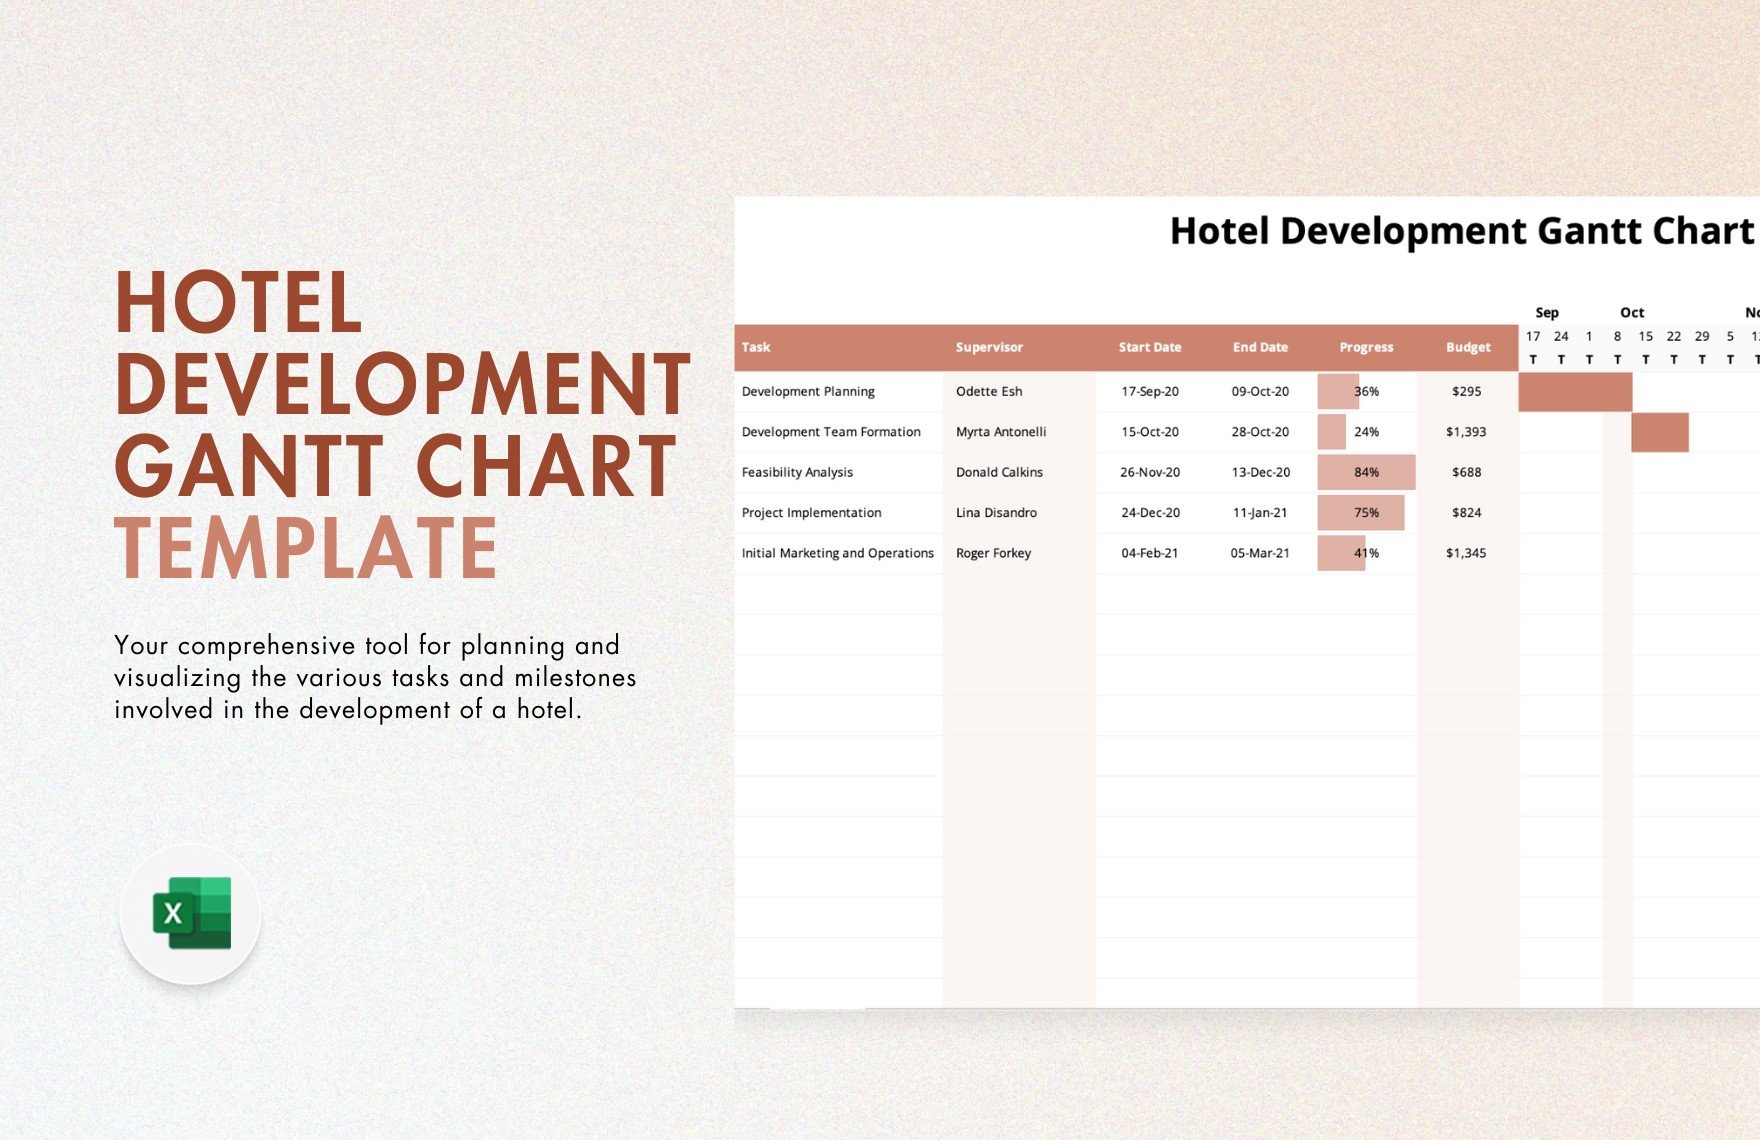
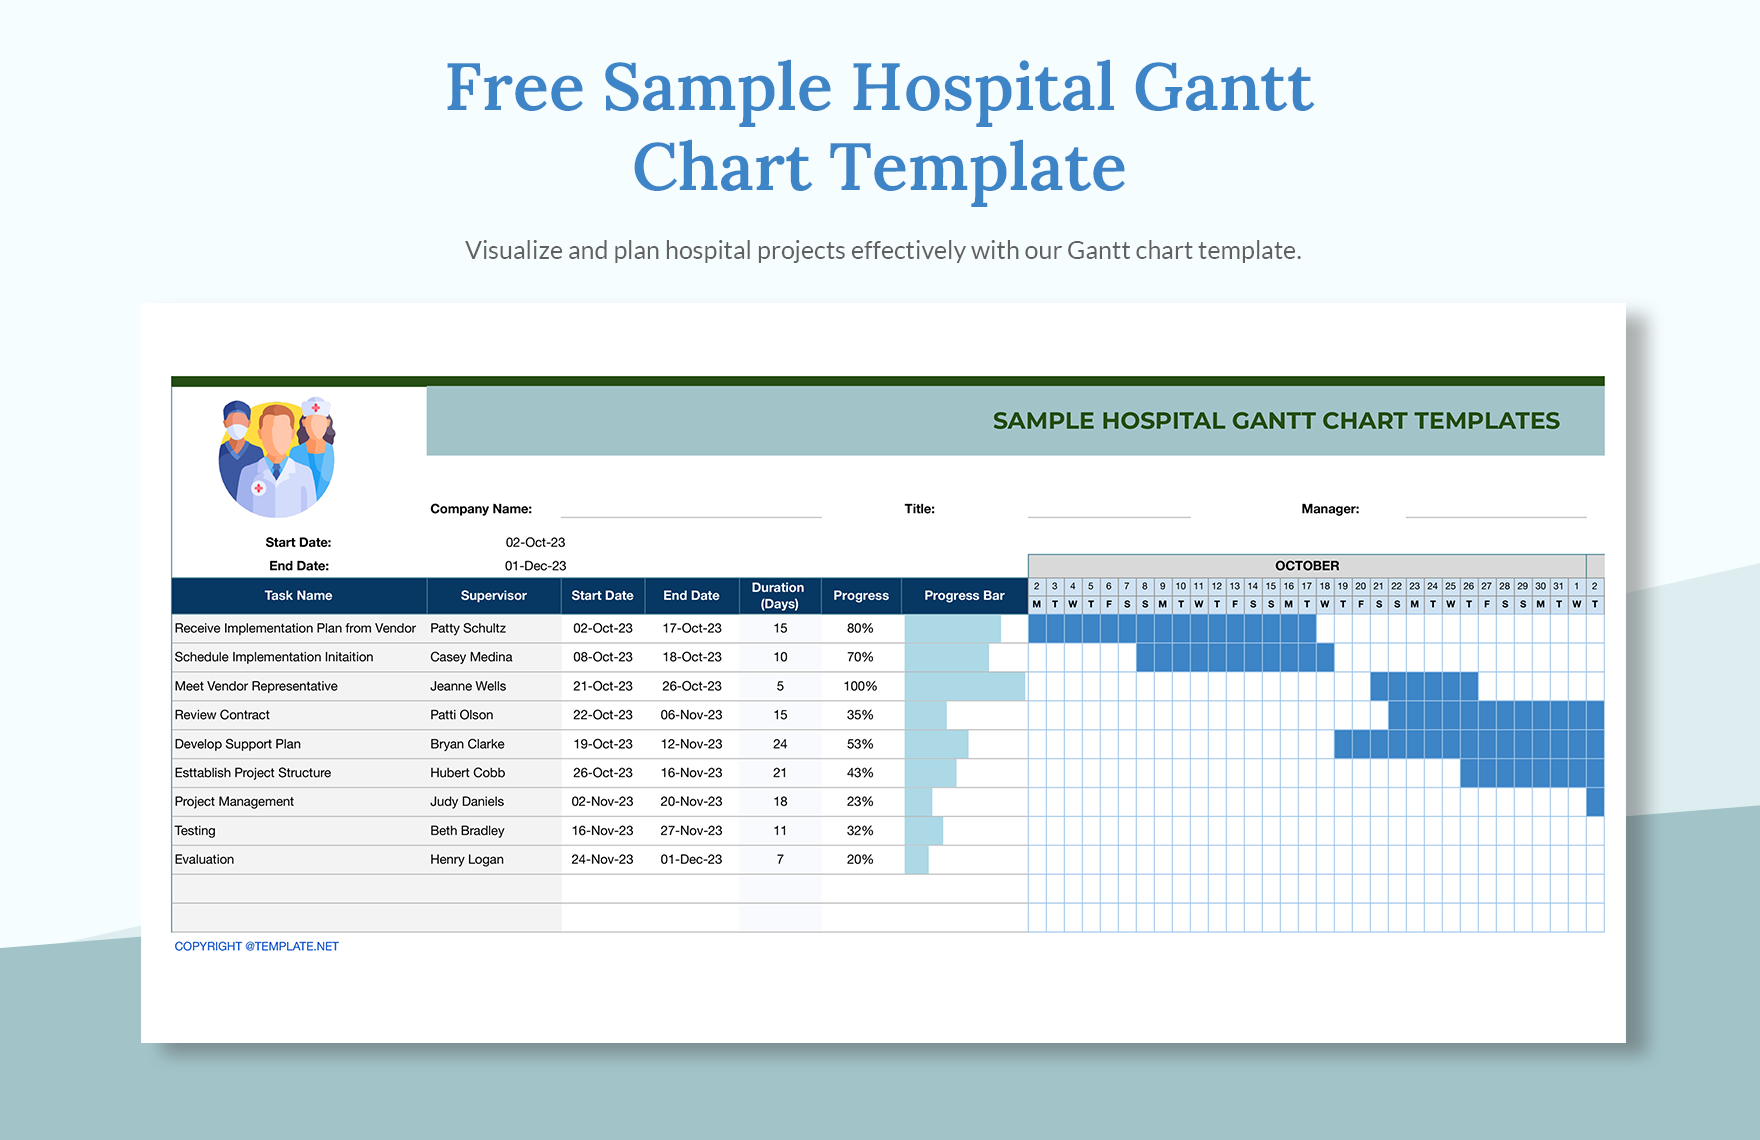
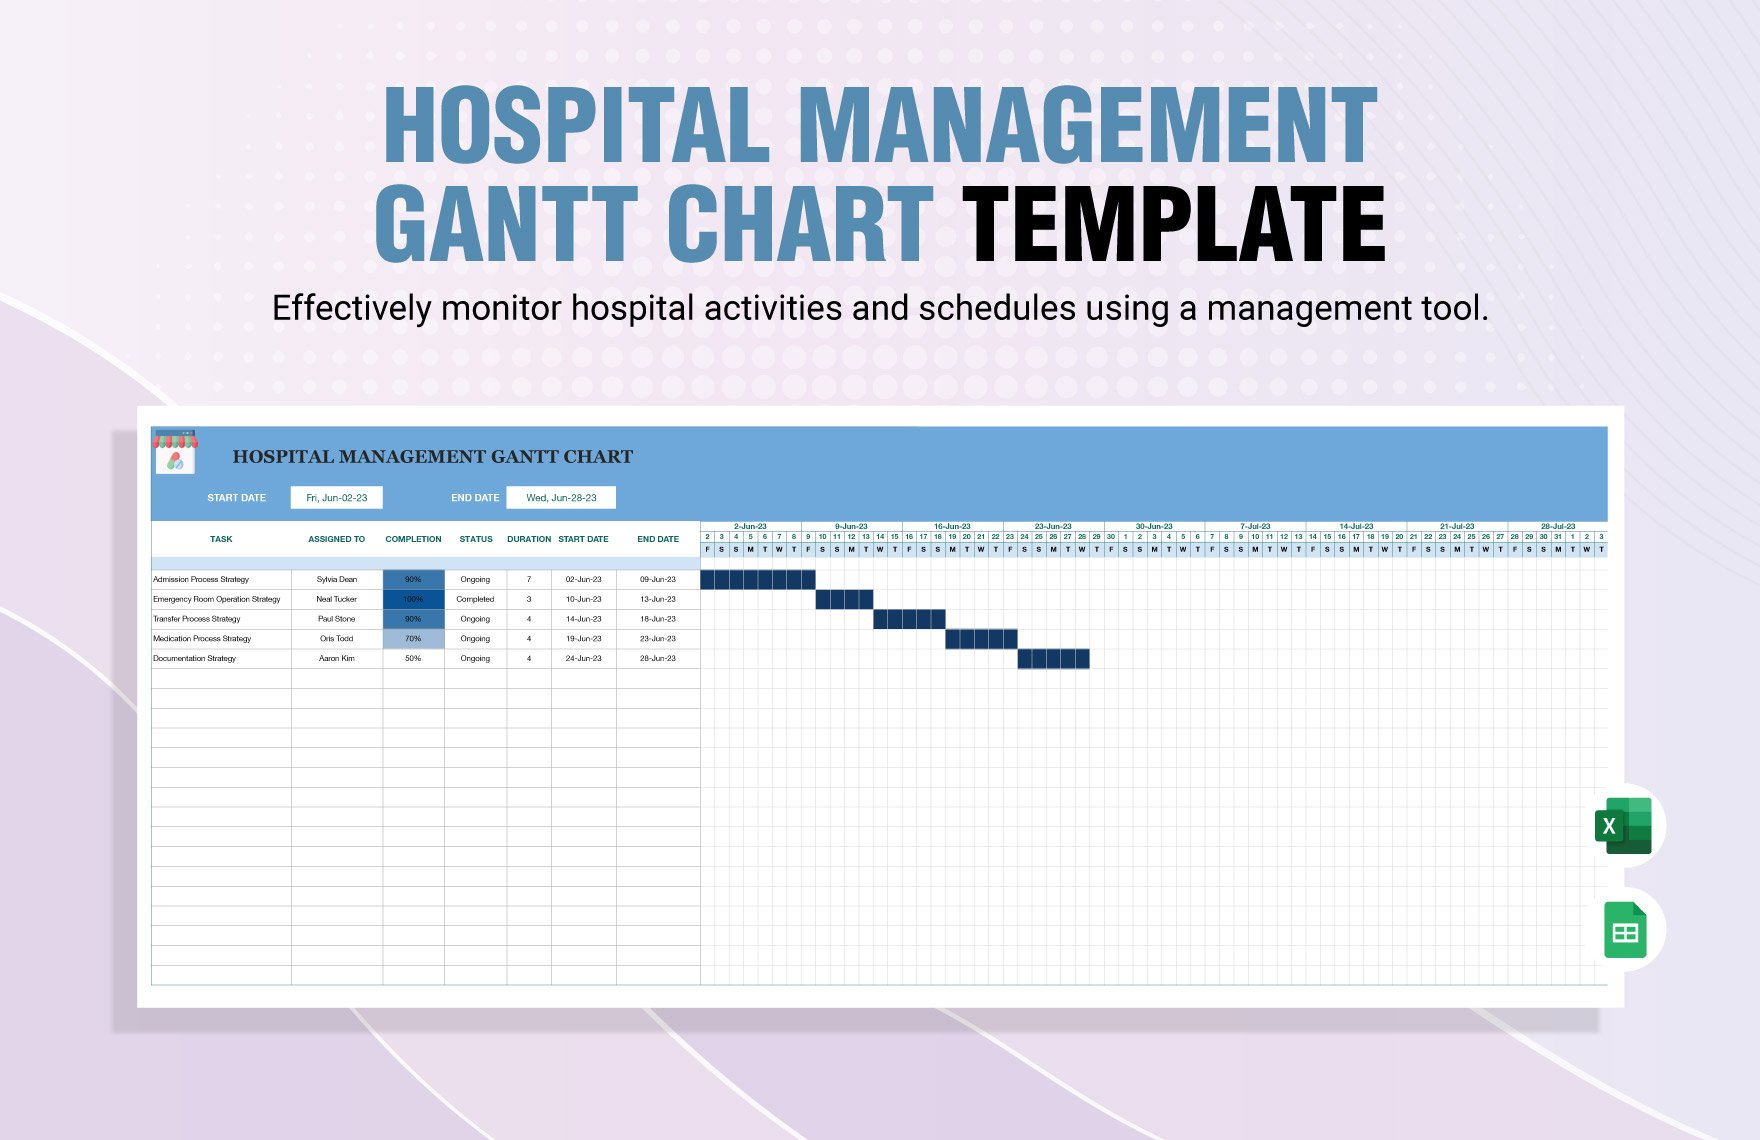
Hospitals (and other healthcare facilities) play a vital role in all societies, looking after everyone’s wellbeing through modern medical practices. However, for them to achieve this, proper management and scheduling are absolutely necessary. If your own hospital operations need improvement, then remedy the issue with our professional Hospital Gantt Chart Templates! Keep track of pharmacy orders, patient treatments, and more with our professional content; available in both A4 and US letter sizes. So, don’t delay any further and download our samples today--create a hospital timeline diagram with our easily editable Gantt chart templates!
What Is a Hospital Gantt Chart?
Hospitals require effective management so that they run smoothly, and a hospital Gantt chart is a useful tool for achieving that. As stated by the Association for Project Management, using a Gantt chart makes it so that even complex projects and tasks are simplified into a more manageable state.
How to Make a Hospital Gantt Chart
From conducting a recruitment training plan to monitoring supply delivery dates, a Gantt chart is helpful for all kinds of hospital matters. However, if you’re not sure how to create this timeline diagram, then just check out our simple steps down below!
1. Prepare a Data Table for Your Hospital Gantt Chart
In a Gantt chart, there are two main segments that make it up--one of which is the data table. So, for your hospital diagram to work, start off by setting up a grid table in your preferred processing software.
For your data table’s cells, prepare 3 columns. These are for categorizing lists of information, which are used in measuring your various timelines. Each column is for one of the following categories: task names, task start dates, expected completion dates. Label these however you like later on!
As for the rows, the number depends on how many tasks or timelines need listing. For example, if a piece of medical equipment has 5 parts in its maintenance procedure, then your data table needs 5 rows.
2. Your Hospital Gantt Chart’s Bar Table
The other half of your hospital Gantt chart is the bar table (or the bar sub-chart). This is where timelines and progression are actually gauged.
Next to your data table (on the right), prepare a separate set of rows and columns. The bar chart’s number of rows is similarly determined as in your data table. And, like in the data table, the rows are for listing down each task or timeline.
Meanwhile, take the overall timeframe for completing all timelines and use the total days to determine how many columns the bar table needs. For instance, if the timeframe is 18 days in total, then set up 18 columns in the table.
3. Labeling Categories and Inputting Data in Your Hospital Gantt Chart
After setting up the bodies for both tables, enter your data and information into the chart.
In the data table, add your desired category labels just above each column before writing down your data into their respective categories.
For the bar table, take the dates in your overall timeframe and use those for labeling each column. Going back to our example of 18 days, if the first day is on August 4, then the first column should be named as such (while doing the same for the subsequent columns). And, if you align the two grid tables appropriately, then there’s no need to label the bar chart’s rows since your data table already does that for you!
4. Using Your Hospital Gantt Chart
Now that you have the tables, data, and labels prepared, your hospital Gantt chart is ready for use! To use the chart, choose a color first. Then, in your data table, take the data for your start dates and use it for coloring the matching cells in your bar table. Fill in more successive cells for each passing day until all timelines are complete, keeping an eye on the expected completion dates to see if each one can be fulfilled in time.
Finally, if you need editable Gantt chart samples for your medical planning and management, then do consider our Hospital Gantt Chart Templates!