Are you trying to organize ideas for your special day? Or maybe, trying to do a well-organized headcount to secure your guests? Either way, it is important to have material that can save time and provide convenience. But don’t worry, we’ve got you covered. Our 100% customizable Chart Templates are editable in Adobe InDesign with files that are available in 24x36 inches in CYMK color with 300 DPI resolution. You can play with designs and text with our beautifully designed and high-quality templates. So, what are you waiting for? You can start creating a fully organized plan by downloading our templates now!
How to Create a Chart in InDesign
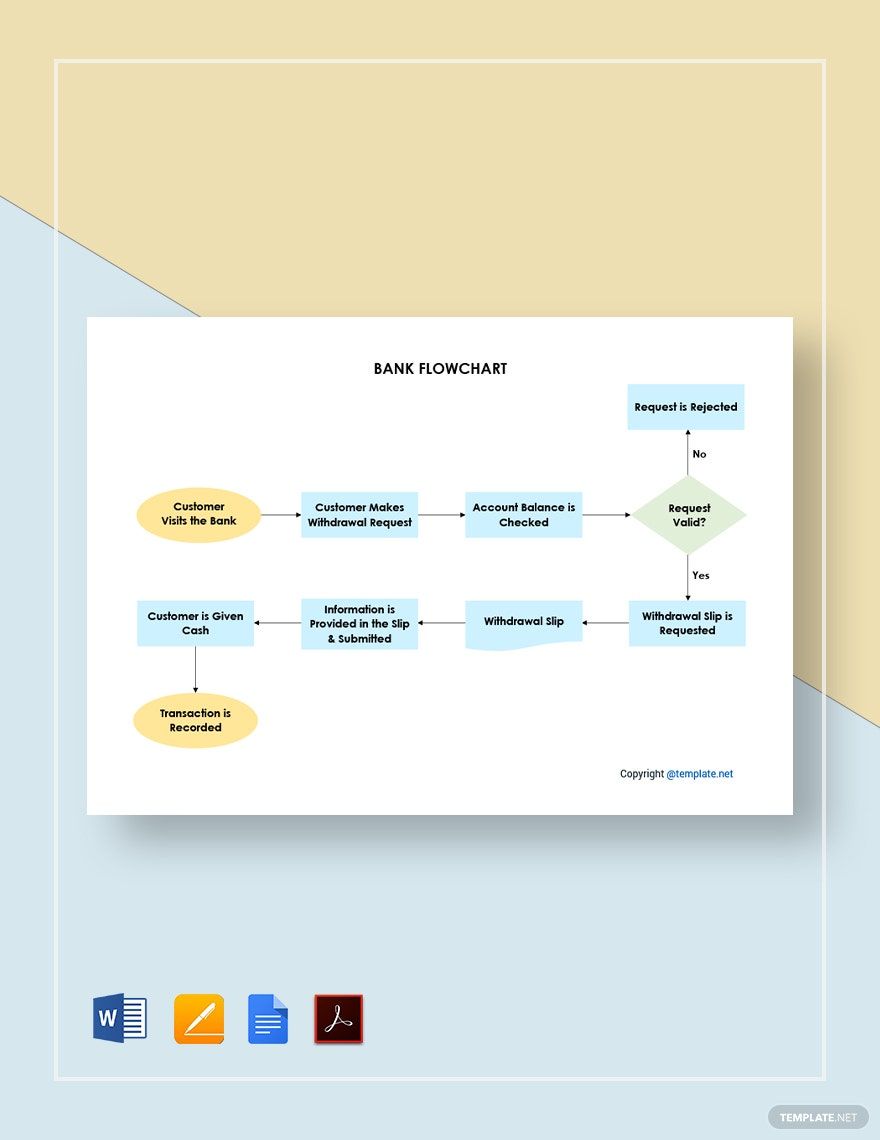
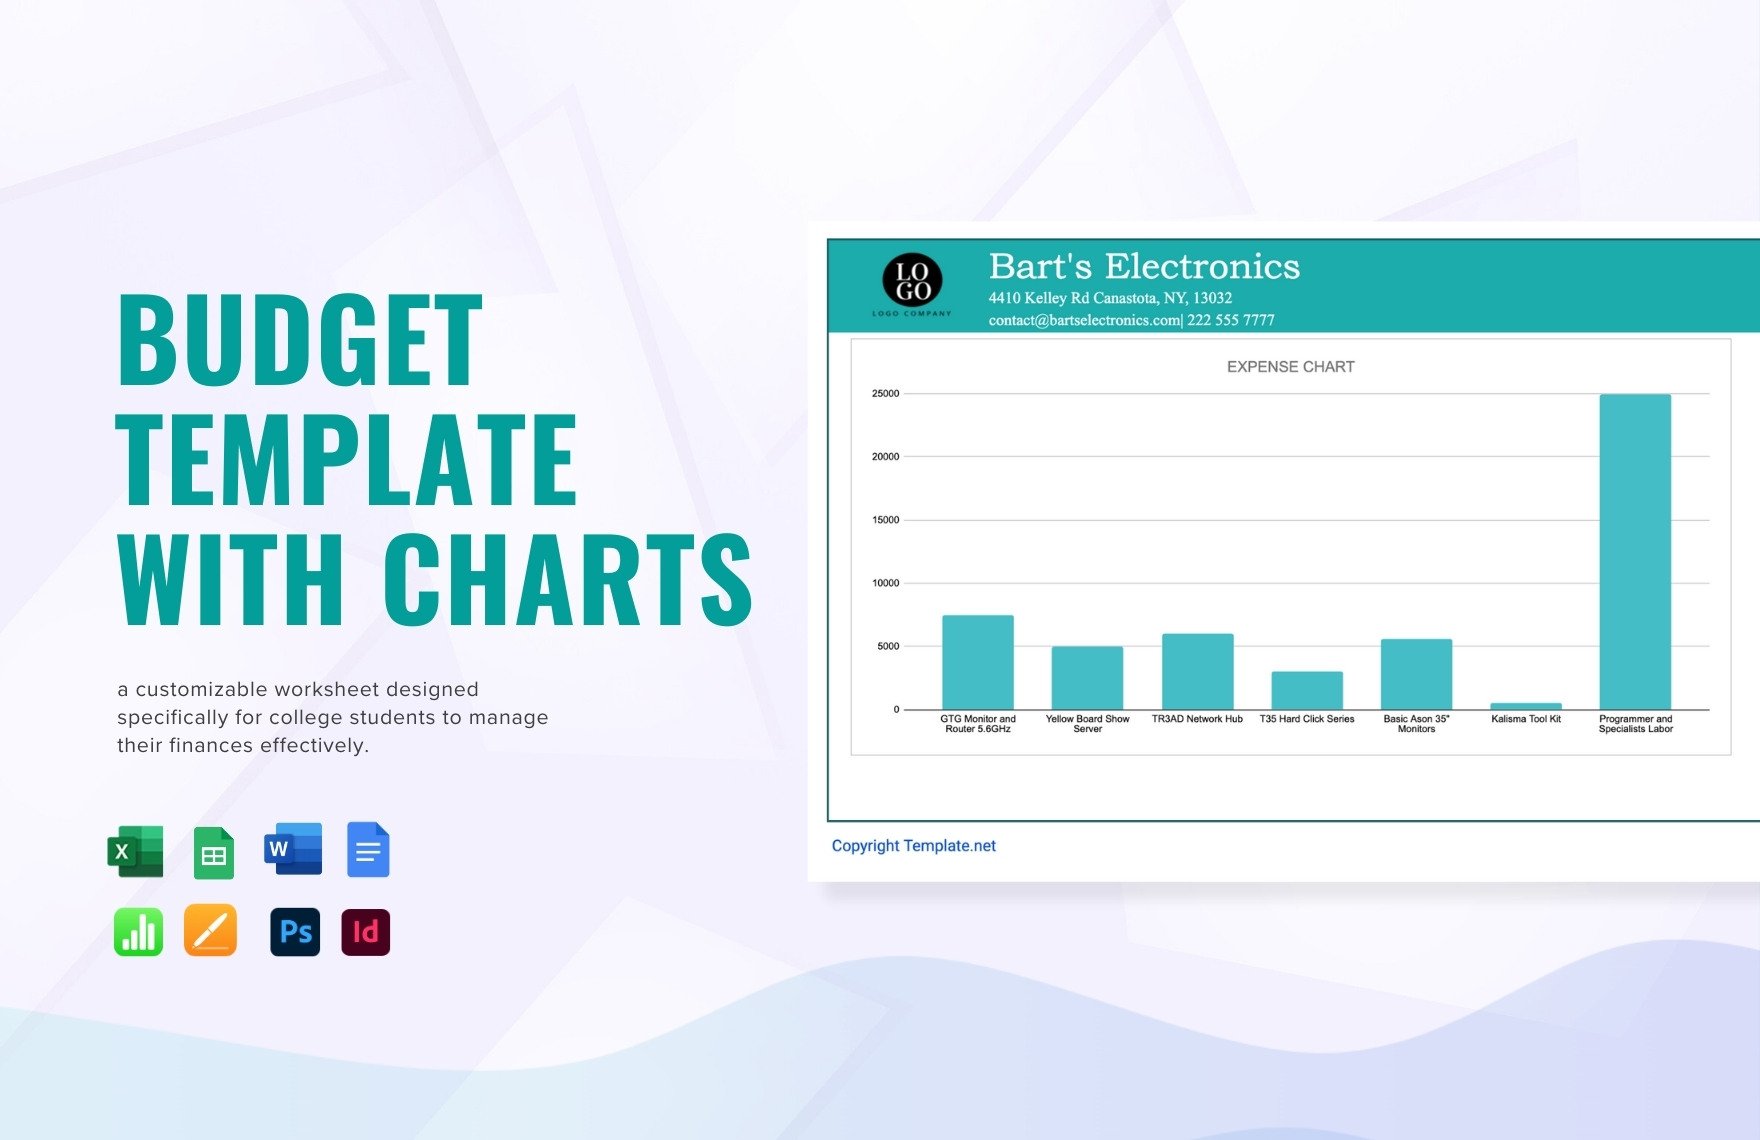
A chart displays a graphical representation of gathered information and data. It helps show analysis that is illustrated through lines, pie, graphs, and bars. It is also used in different situations, but mostly in schools and organizations. But whether you are creating a flow chart, Gantt chart, or organizational chart, all of these functions as an essential material in providing a visual representation of data.
So, how to tell a story with data? In this digital age, people expect to see more of graphical representations and images. It’s overwhelming to show data analysis without an illustration that completes the story or the report. Data visualization helps in creatively providing statistics, theories, and conclusions. It all comes upon collecting data, knowing your audience, and providing illustrations based on the gathered elements.
For anyone creating a chart that can transform event organization using Adobe InDesign, below are helpful steps on how you can create one.
1. Determine Your Purpose
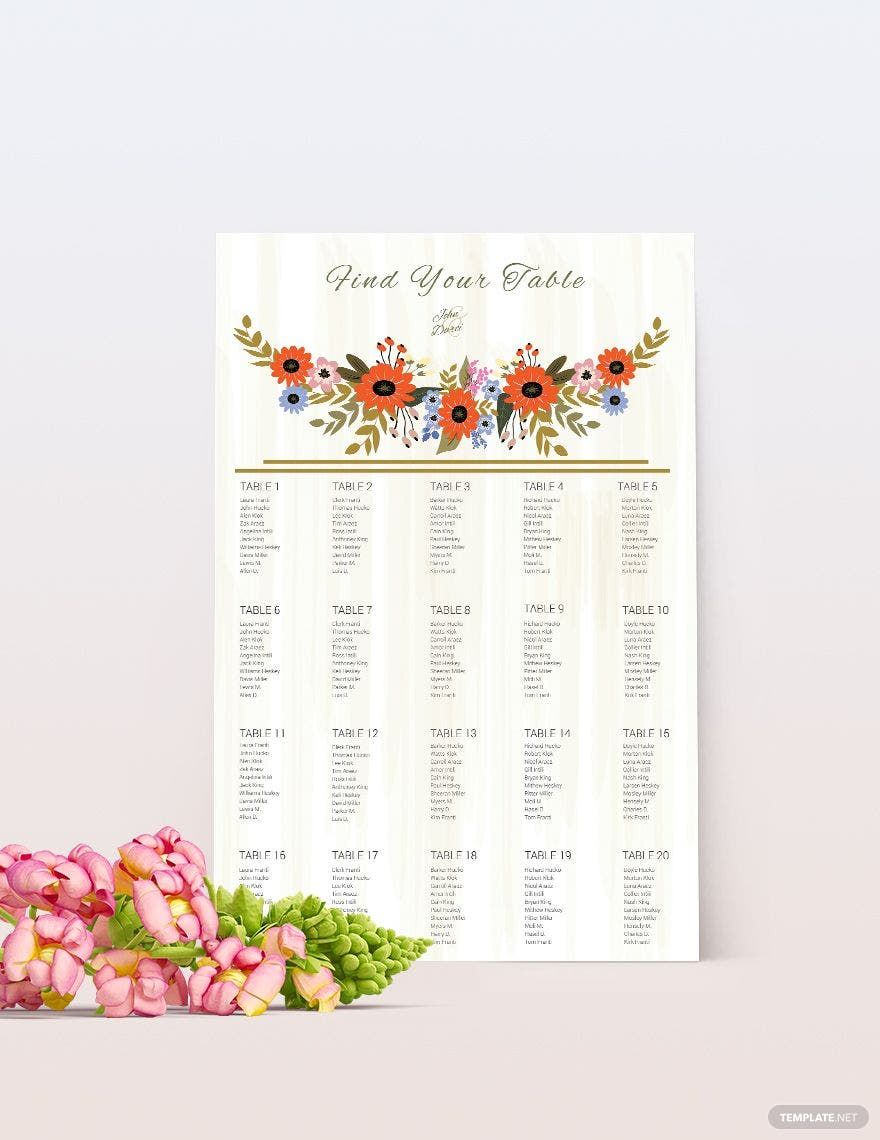
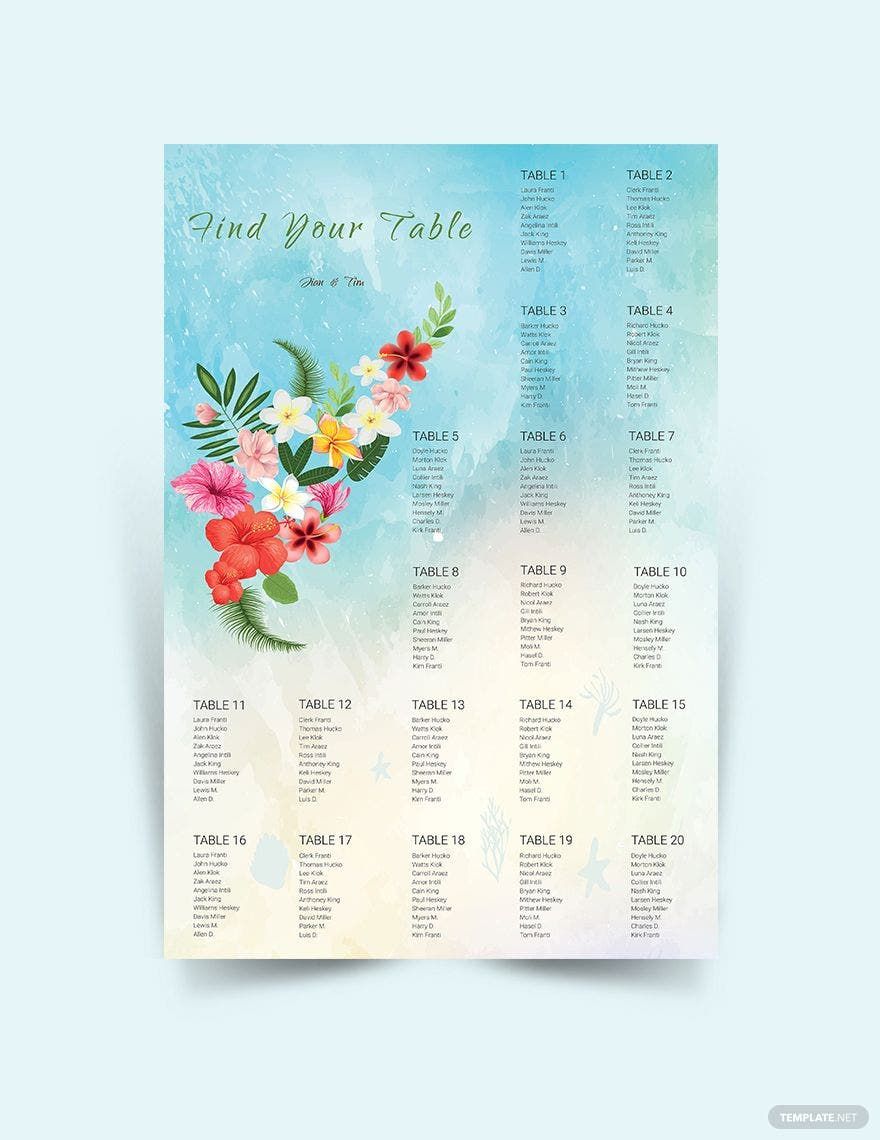
First, know what kind of chart you intend to create. But before that, you also need to identify your purpose in generating ideas. It is irrelevant to create a company chart when you are organizing your materials for your wedding or aiming for a wedding seating chart. Remember that although these charts function the same, each chart is significant depending on the purpose.
2. Choose a Template
Starting from scratch provides flexibility when it comes to designs and layout. But it makes the job easy and less time consuming when you use a ready-made template you can choose from this website. Whether you are creating a company organizational chart or a seating chart, having customizable templates gets the job done in an instant.
3. Input Data
Once you have a template of choice, you can now start inputting all the names, labels, and other data acquired — input data with the corresponding position, rank, department, and category. You can make boxes or circles that connect related elements from one another. This is a very important process to categorize each unit and information accurately. So, avoid scattering through the lines and make it simplified.
4. Incorporate Design Elements
Keep in mind that there are different types of charts, and incorporating designs is also dependent on the kind of chart you are doing. For business purposes, a simple chart should be formal and professional. But when you are creating a seating plan for your wedding, it is best to add colors and designs that match your wedding theme. Play with colors and use a typeface that are eye-grabbing to excite your guests.
5. Print File in Adobe InDesign
When planning to display it on department walls or event venues, it is best to print it on a thick and stable paper stock to prevent tearing it apart sooner. But when planning to use it for business reports, a blank and clean sheet is enough. Once you are done finalizing your document, click save from the drop-down menu and have your file ready for printing.