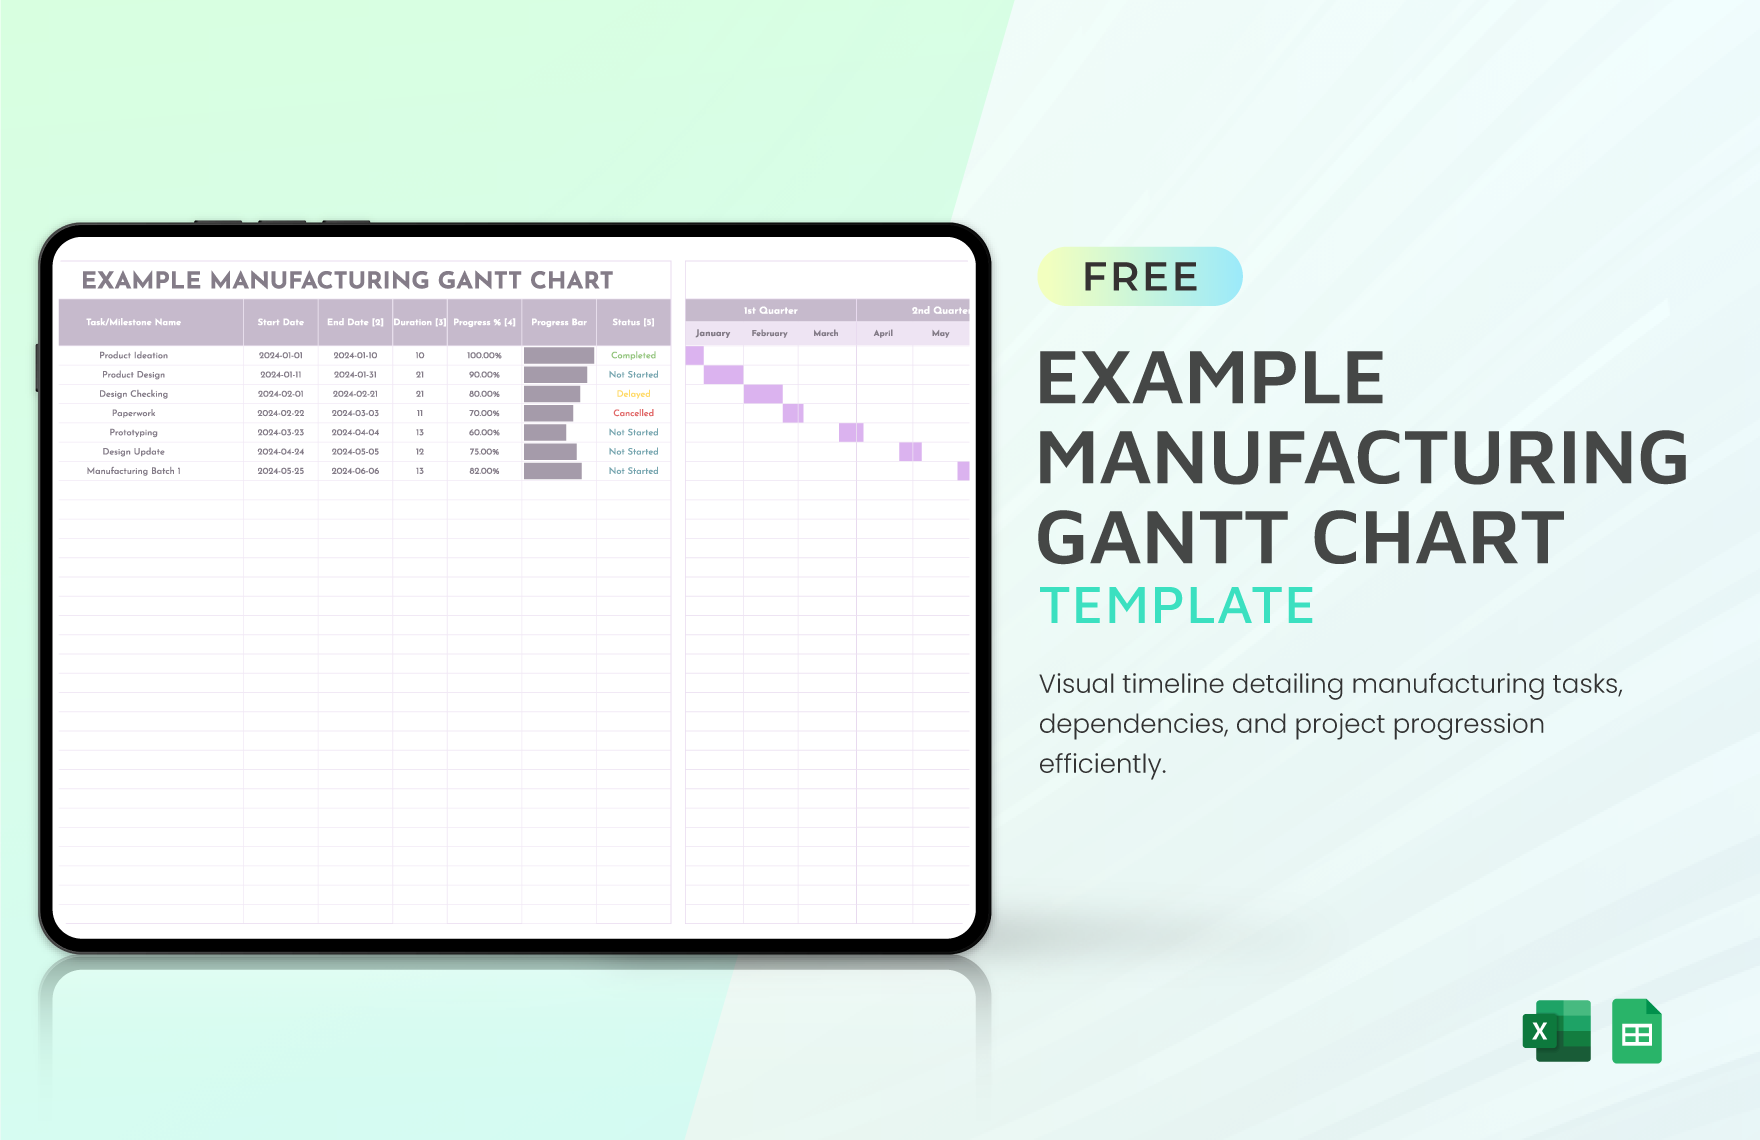
Make Your Project Planning to Life with Manufacturing Gantt Chart Templates from Template.net
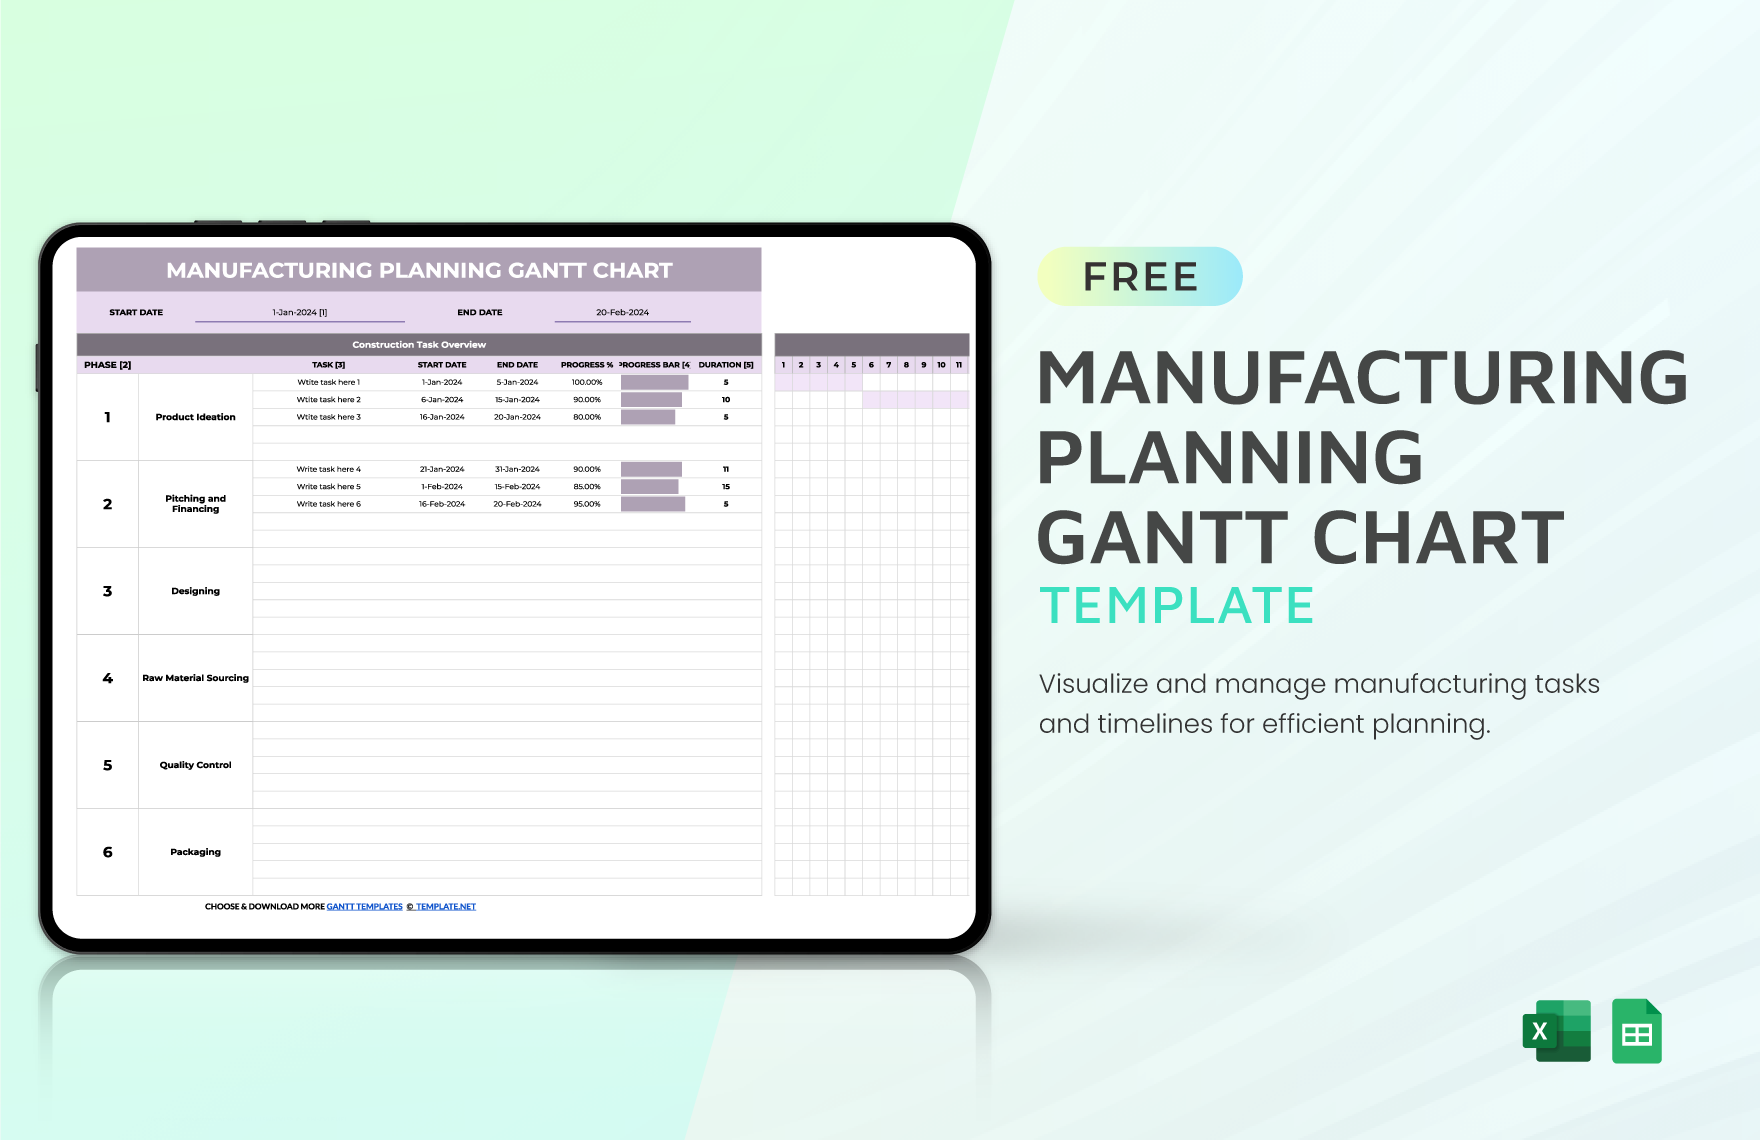
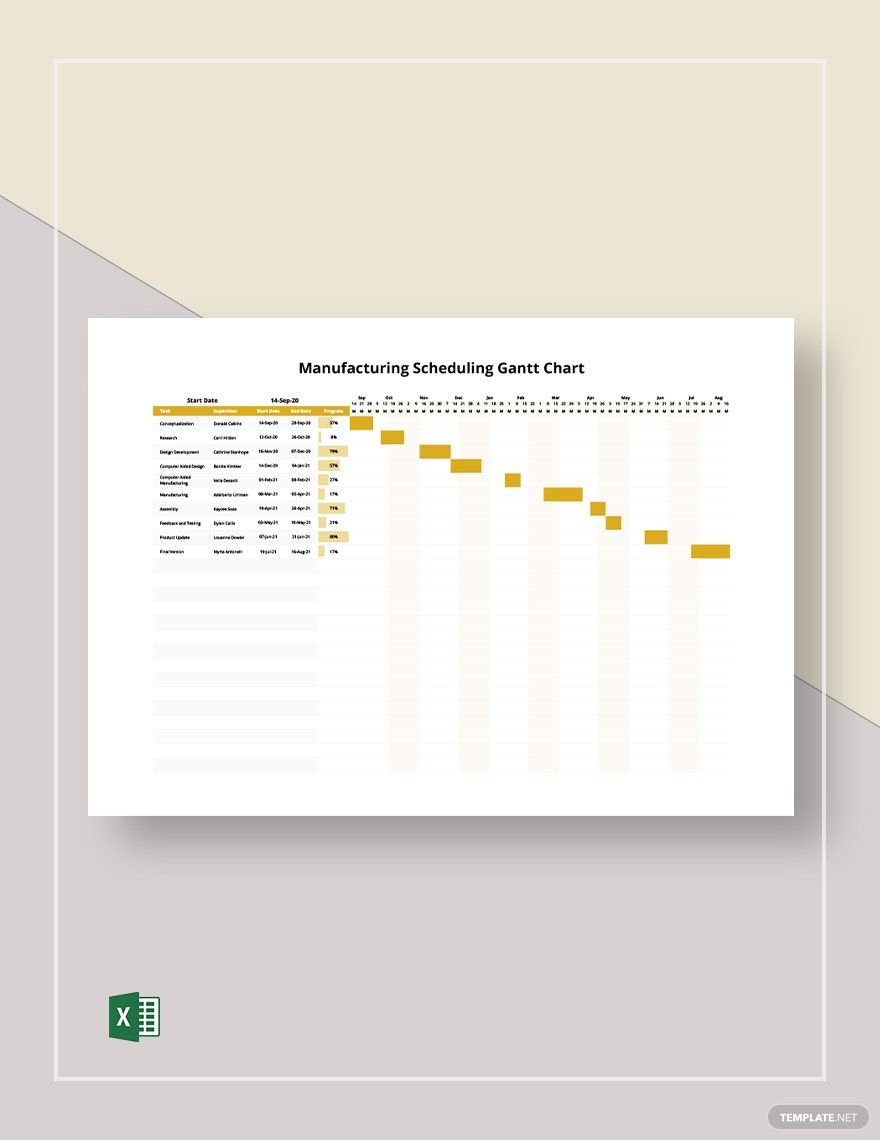
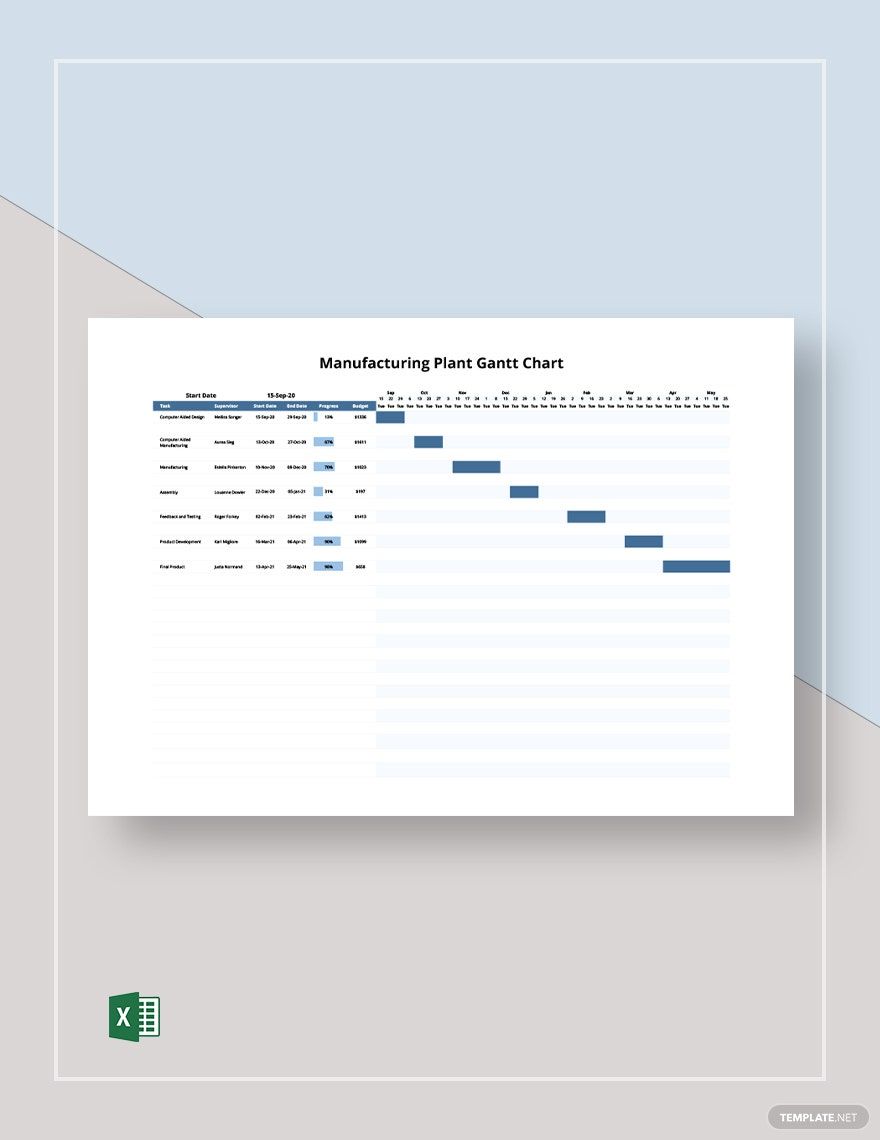
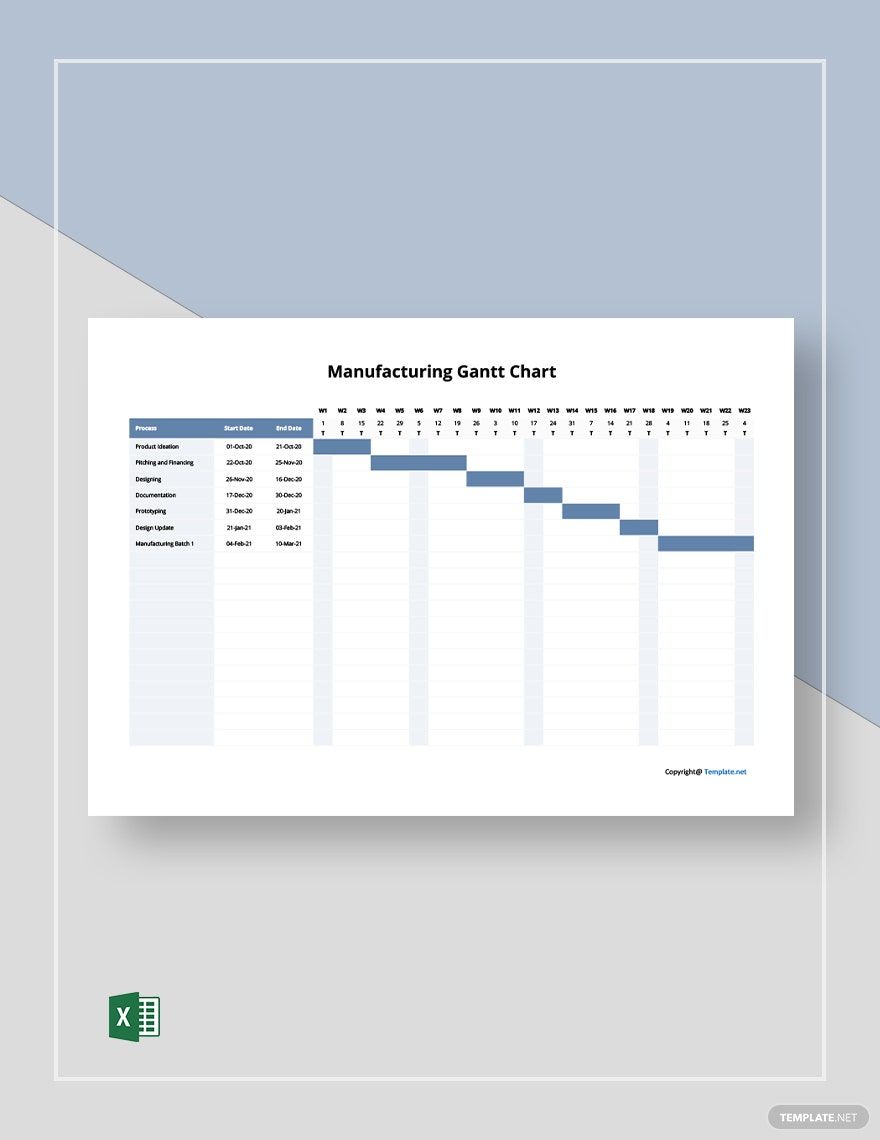
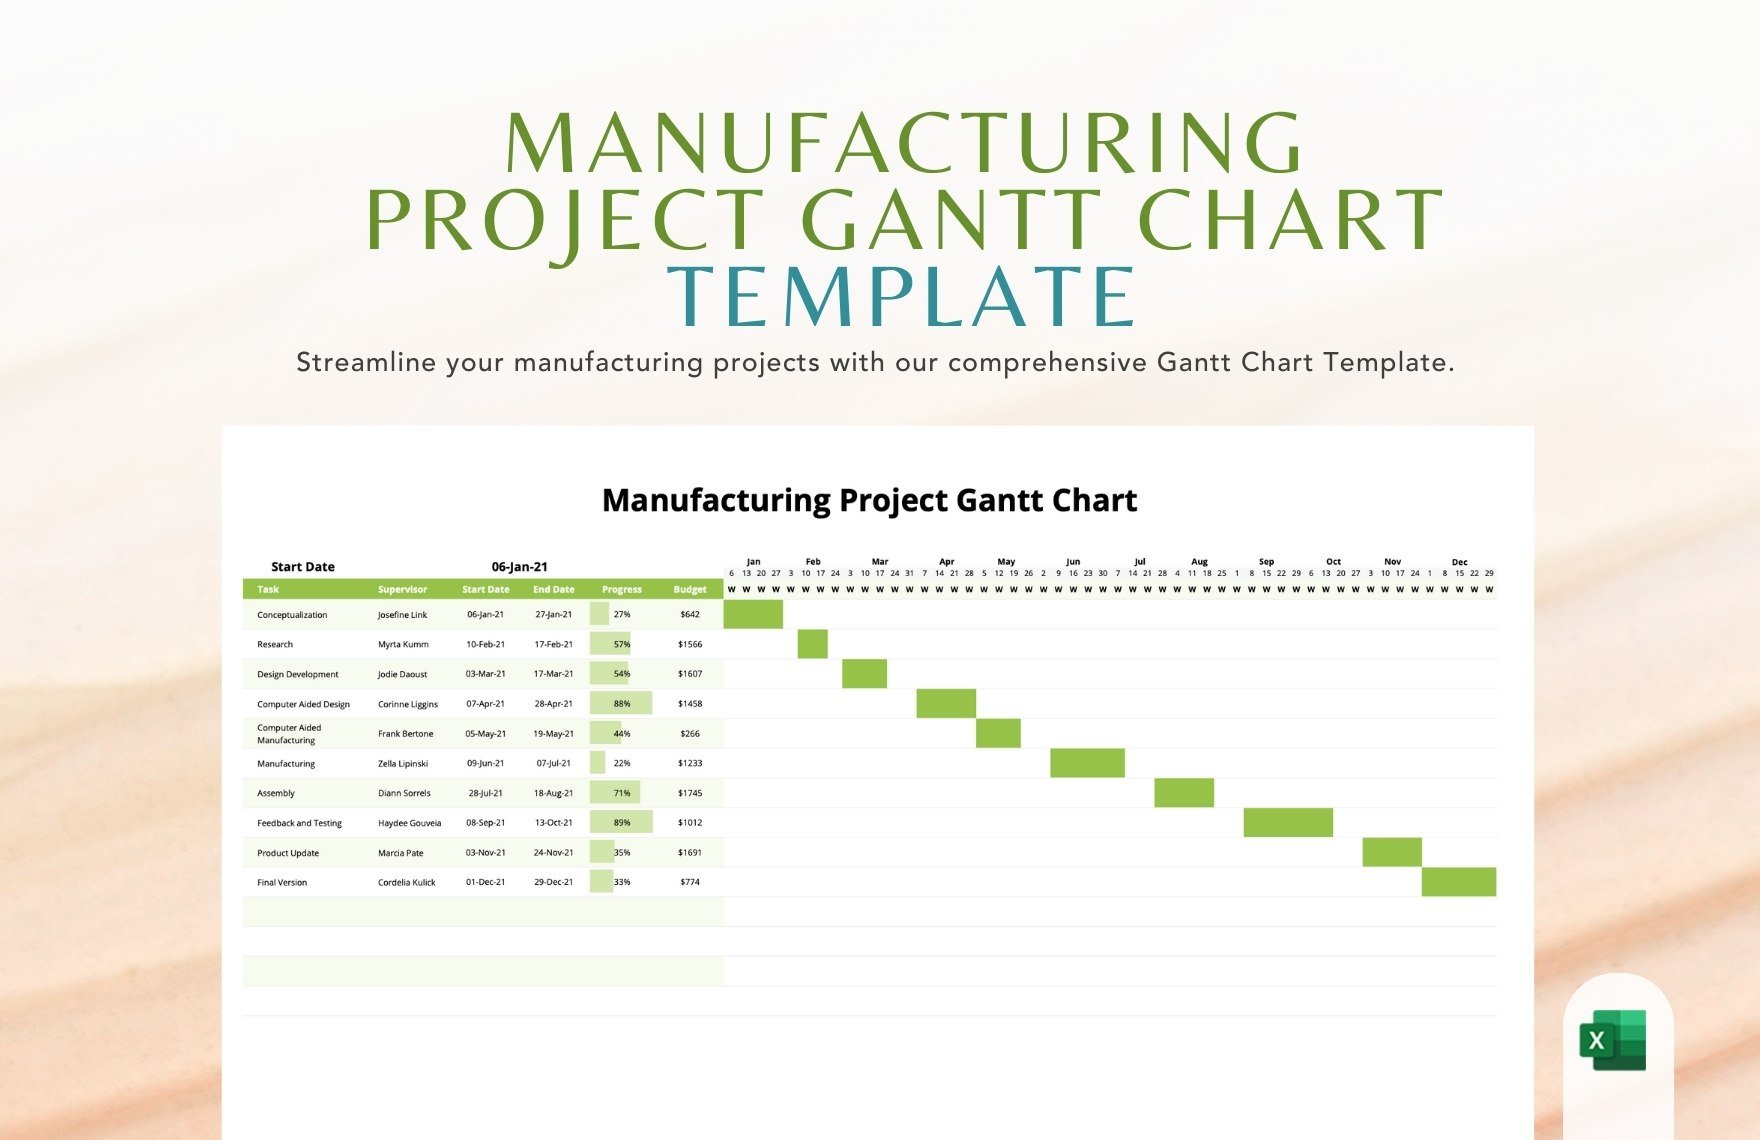
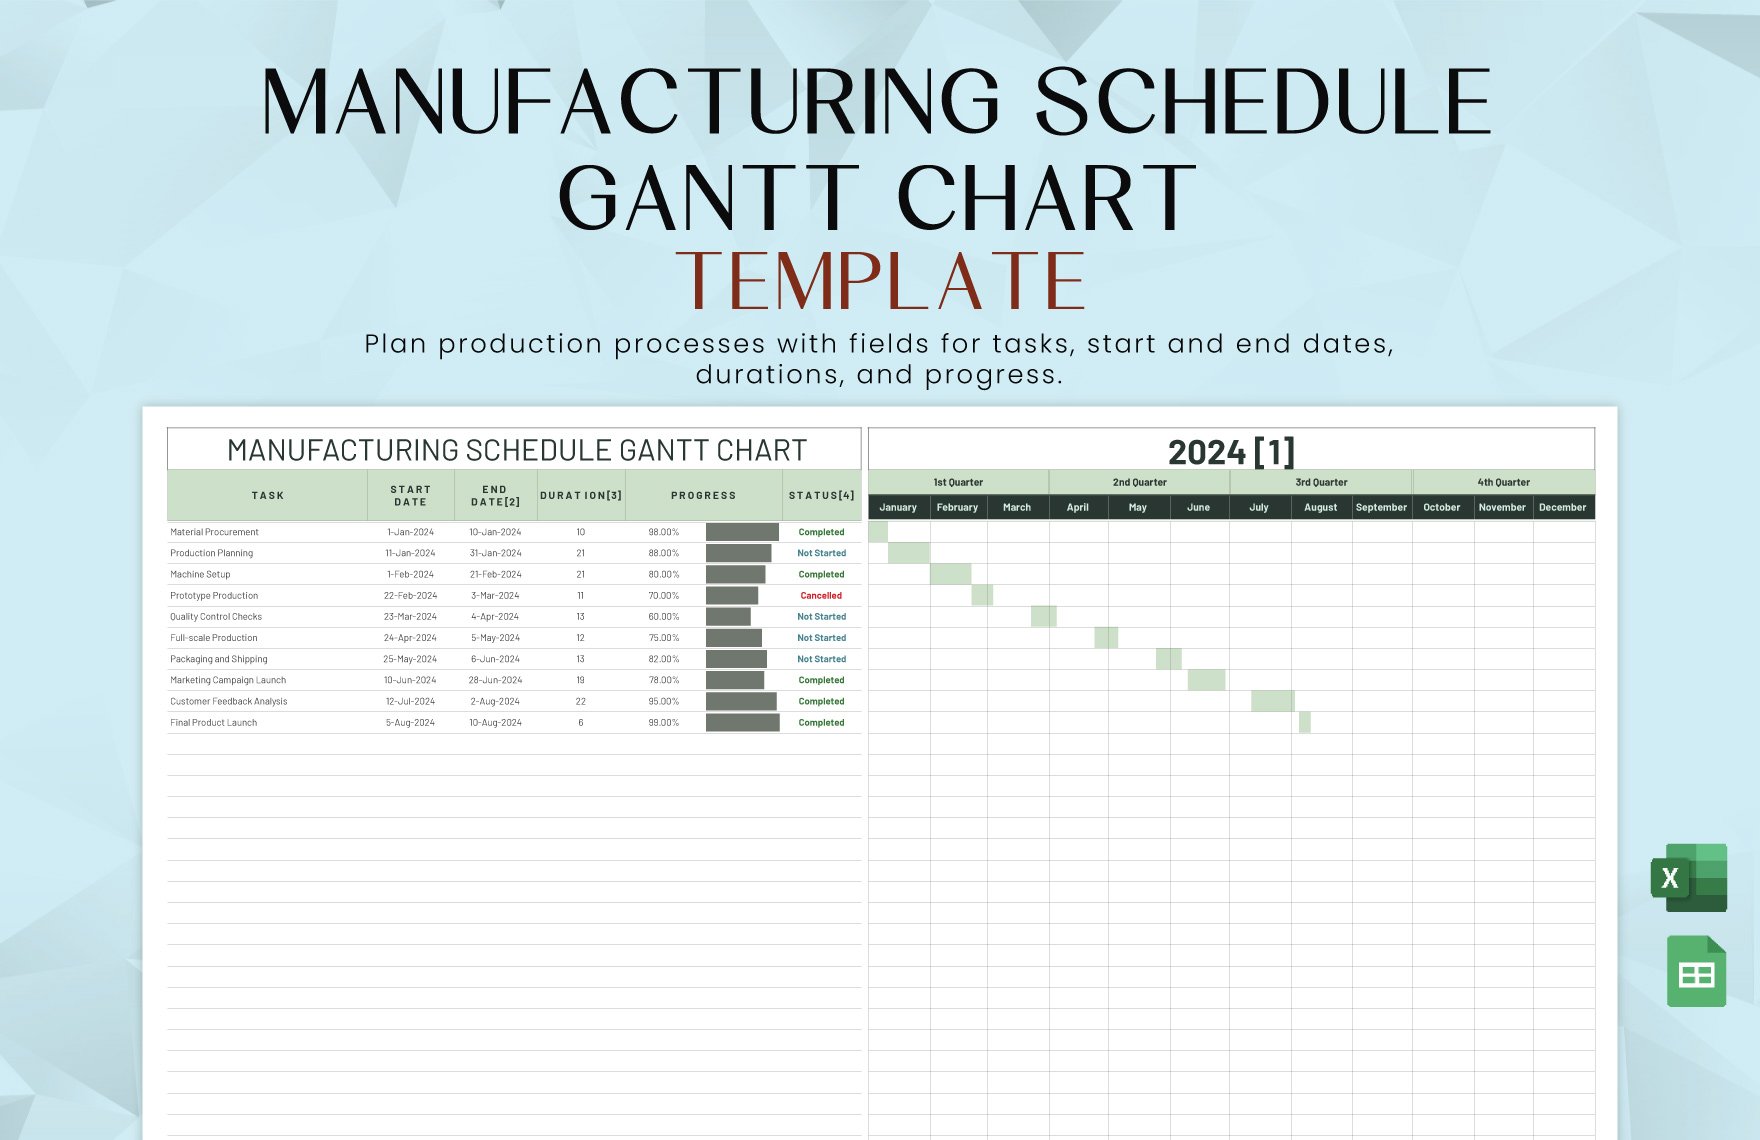
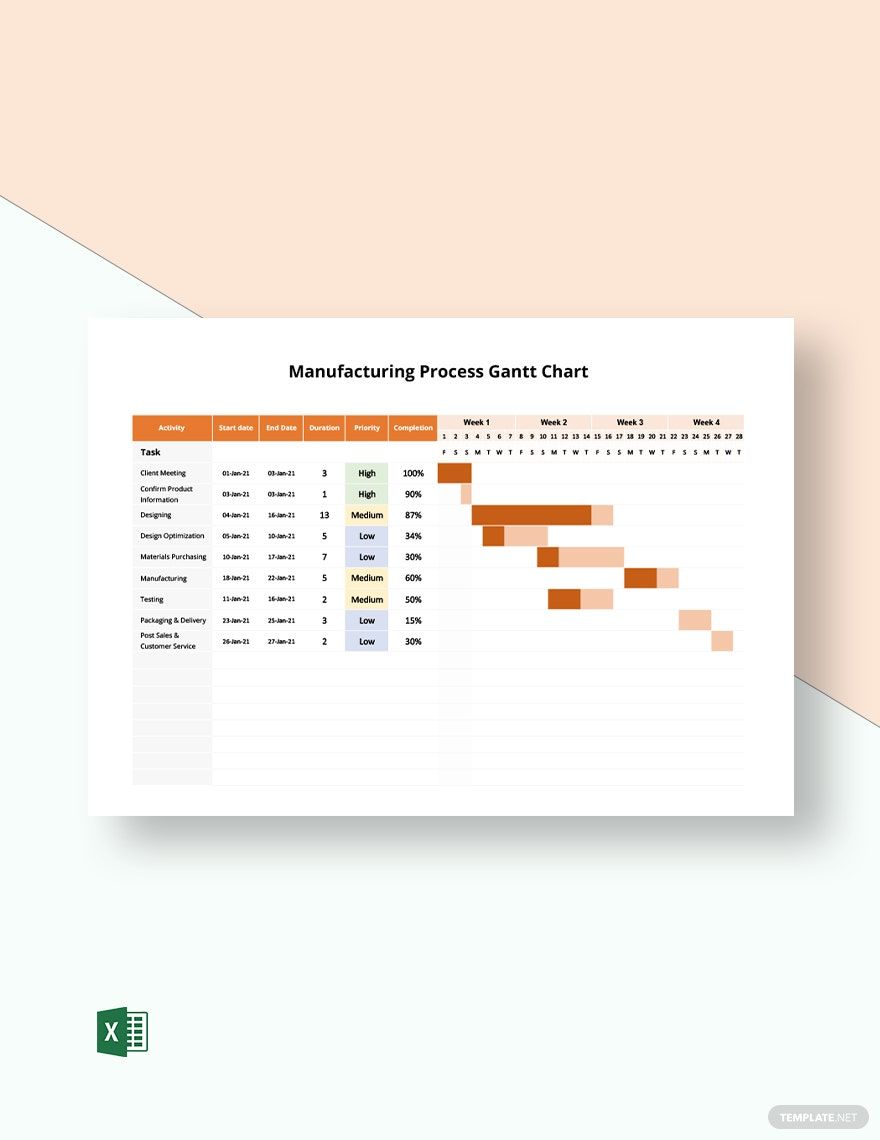
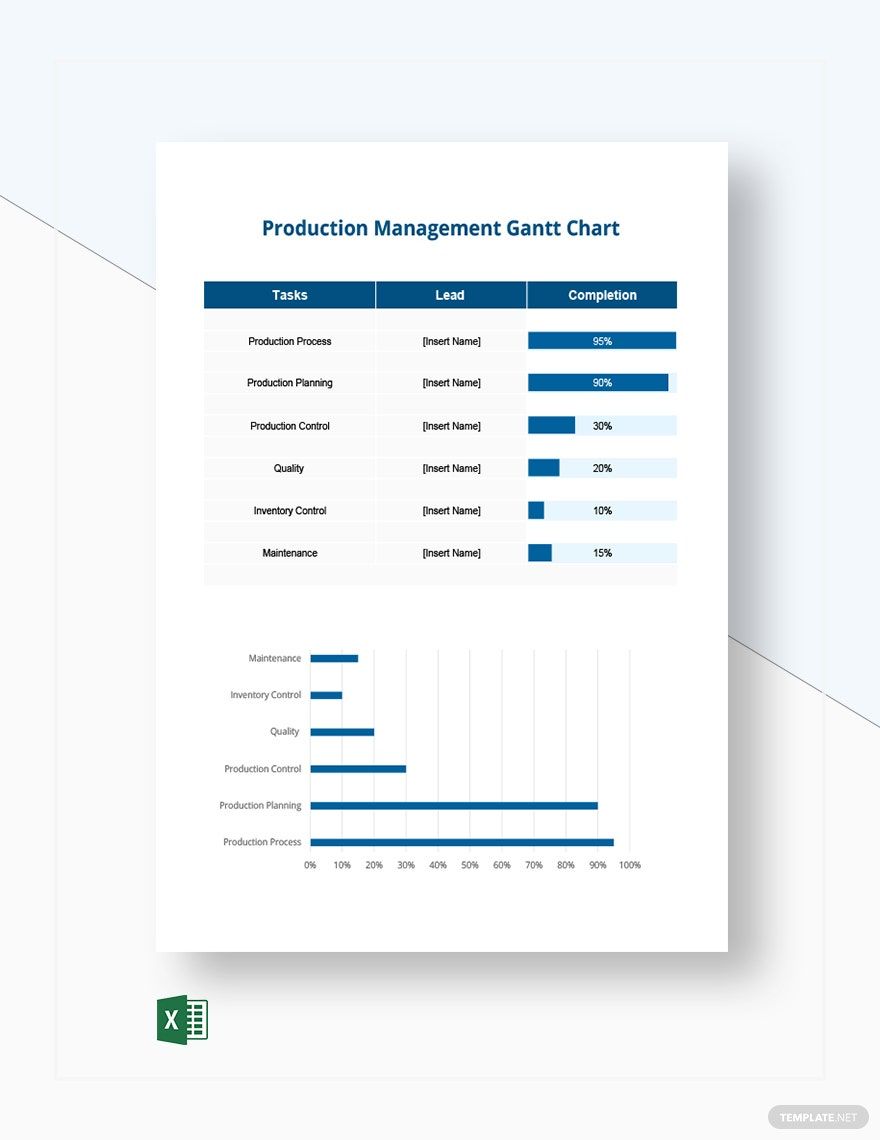
Keep your manufacturing team engaged, streamline operations, and enhance productivity with Manufacturing Gantt Chart Templates by Template.net. Designed for professionals in the manufacturing sector, these templates empower you to visualize your project timelines and synchronize team efforts effectively. Whether you're looking to schedule production tasks or monitor milestone progress, these templates offer a clear and organized view of your project timelines. Each template includes critical elements like task durations, dependencies, and deadlines, making timeline management a breeze. With professional-grade design, these user-friendly tools require no specialized skills to implement, ensuring that even those unfamiliar with Gantt charts can achieve professional-quality results.
Discover the many Gantt Chart Templates we have on hand, tailored specifically for manufacturing needs. Begin by selecting a template that best aligns with your project goals, and customize it by swapping in your specific project details, tweaking colors and fonts to match your brand aesthetic. Add advanced touches with drag-and-drop functionality for icons and graphics, or integrate animated effects to highlight key project phases. The possibilities are endless and skill-free, making it fun and efficient to create the perfect project plan. Plus, with regularly updated templates ensuring you always have fresh design options, your charts will always be up to date with the latest trends. When you’re finished, easily download or share your charts via print or export for effortless team collaboration.
