Get your business moving by downloading any one of our ready-made Chart Templates that are 100% customizable and easily-editable in any version of Apple Pages. Get to customize your data according to your organization's performance by simply making changes to the graph and illustrations. Not an ounce of your time will be wasted. You can also show any presentation at a crucial time whenever an impromptu situation arises. Our chart templates are designed to work in any standard software applications like Pages for Mac. Print-ready, perfect for both commercial and business purposes. The templates make use of high-quality layout, artwork, images, and graphics to meet stringent requirements and specifications. Available in A4 & US Sizes. Start downloading now!
How To Create A Chart In Apple Pages?
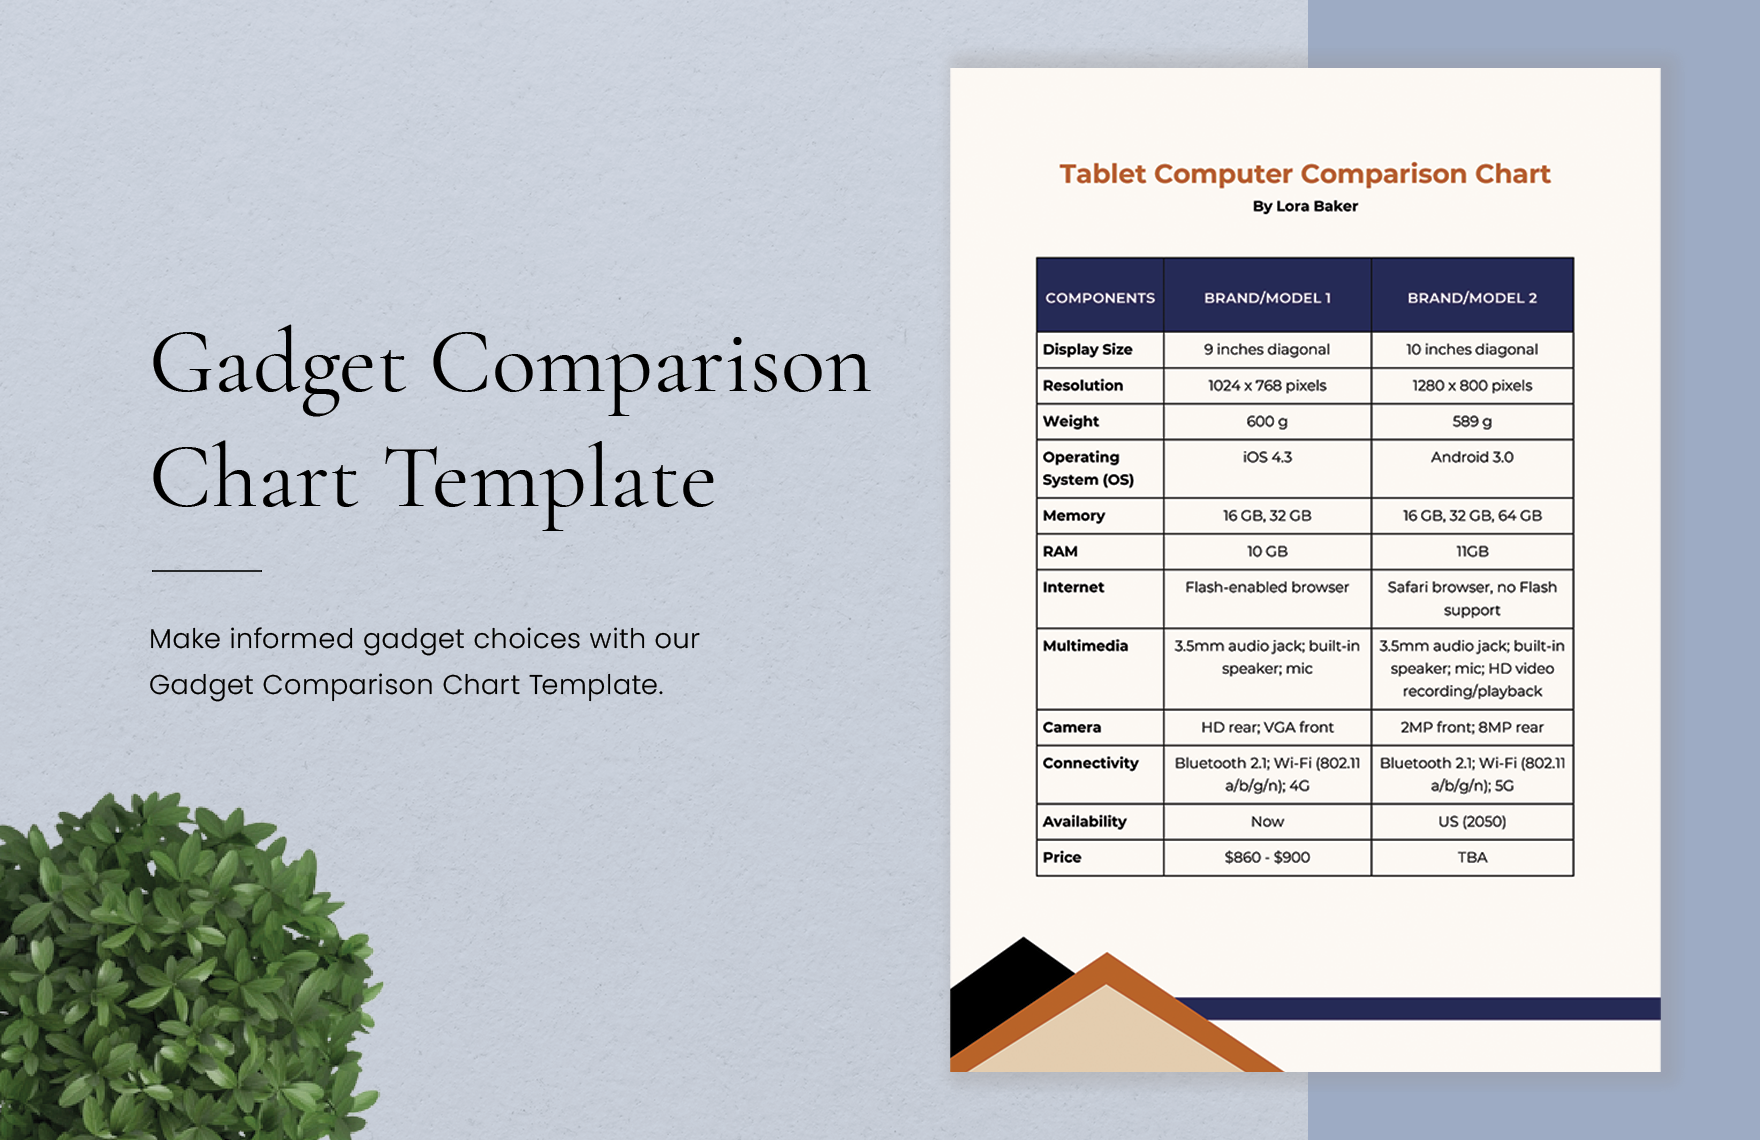
A chart is a highly flexible tool that has countless purposes. A chart is generally used for personal purposes, data analysis purposes, statistical purposes, and business purposes. If you're a part of a large industrial company that continuously produces charts for data comparisons, project report, presentations, operational process flows, and other business-related reasons, it's best to familiarize yourself on how to do it effectively. For that reason, we have gathered a few simple tips on how to create a chart of any kind.
1. Consider Using Apple Pages
Any word processor or editing software is fully capable of creating a sample chart, such as MS Word and MS Excel. Hence, you have the freedom to choose any as long it's according to your convenience. However, you should consider using Apple Pages. Why should you? With Apple Pages, you have all the needed tools and features to any chart, whether you want it to look simple or creative. Moreover, if you have a Mac PC, Apple Pages is already right there for you.
2. Determine The Chart's Purpose
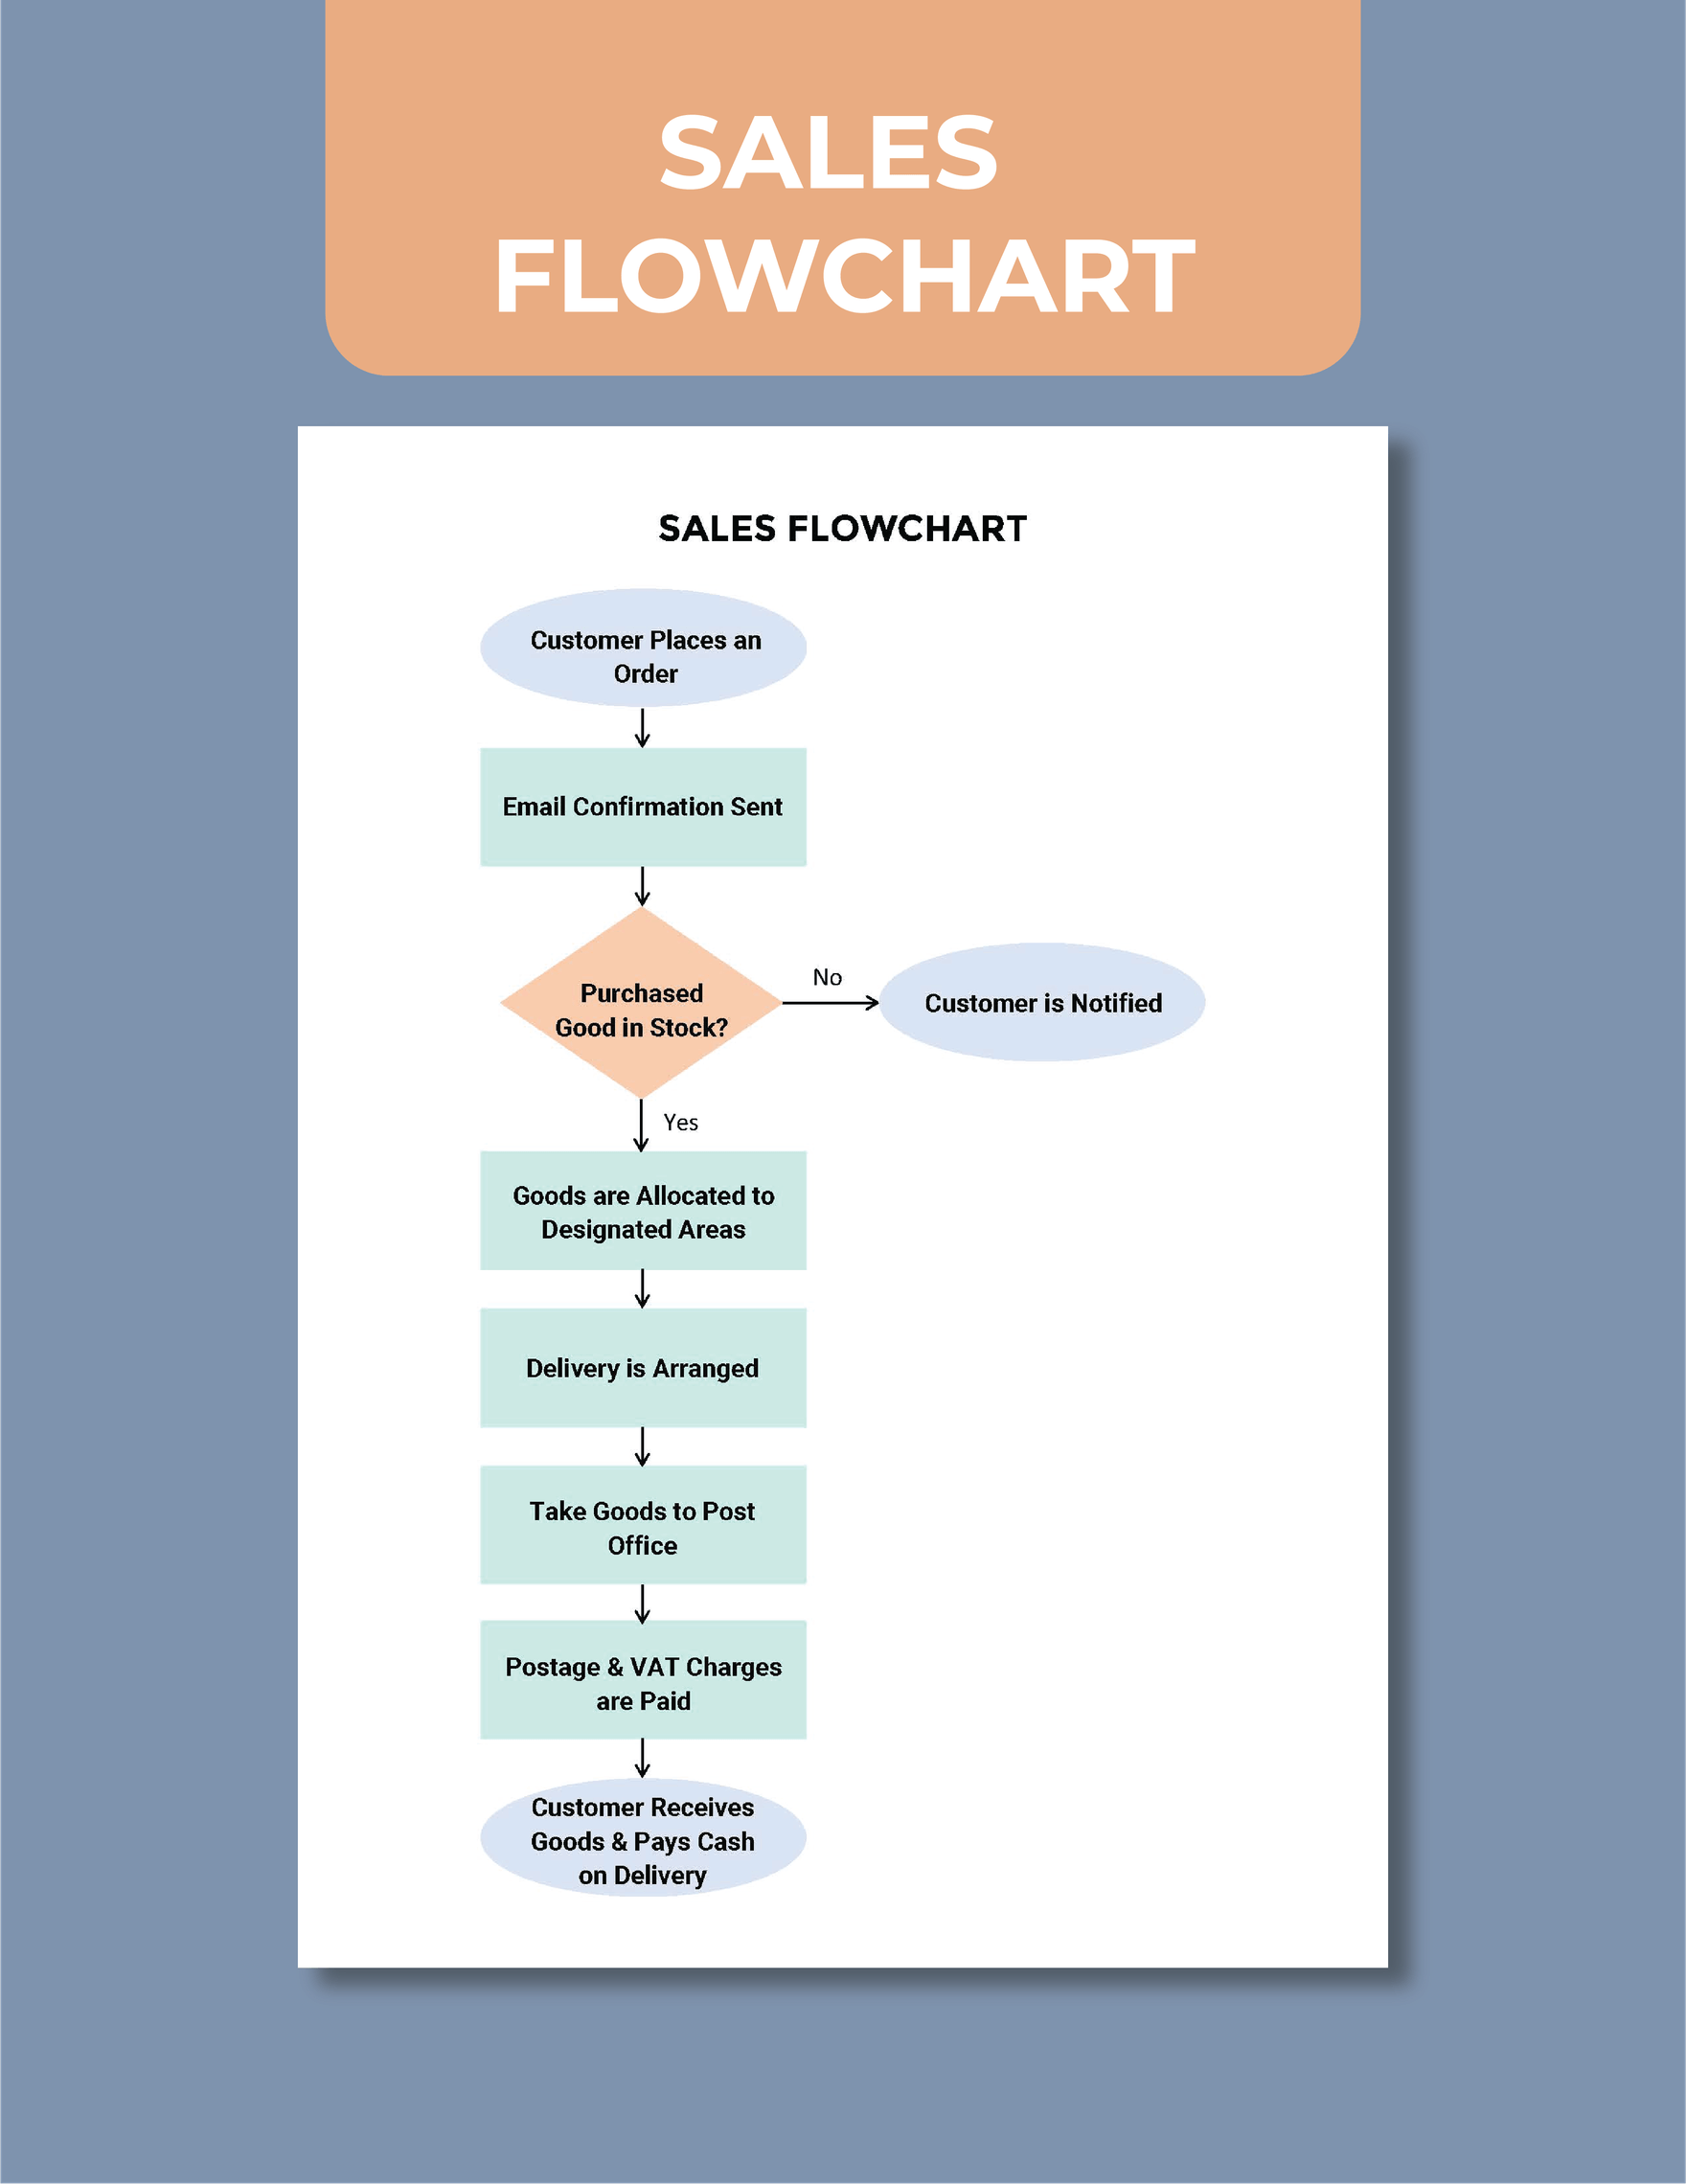
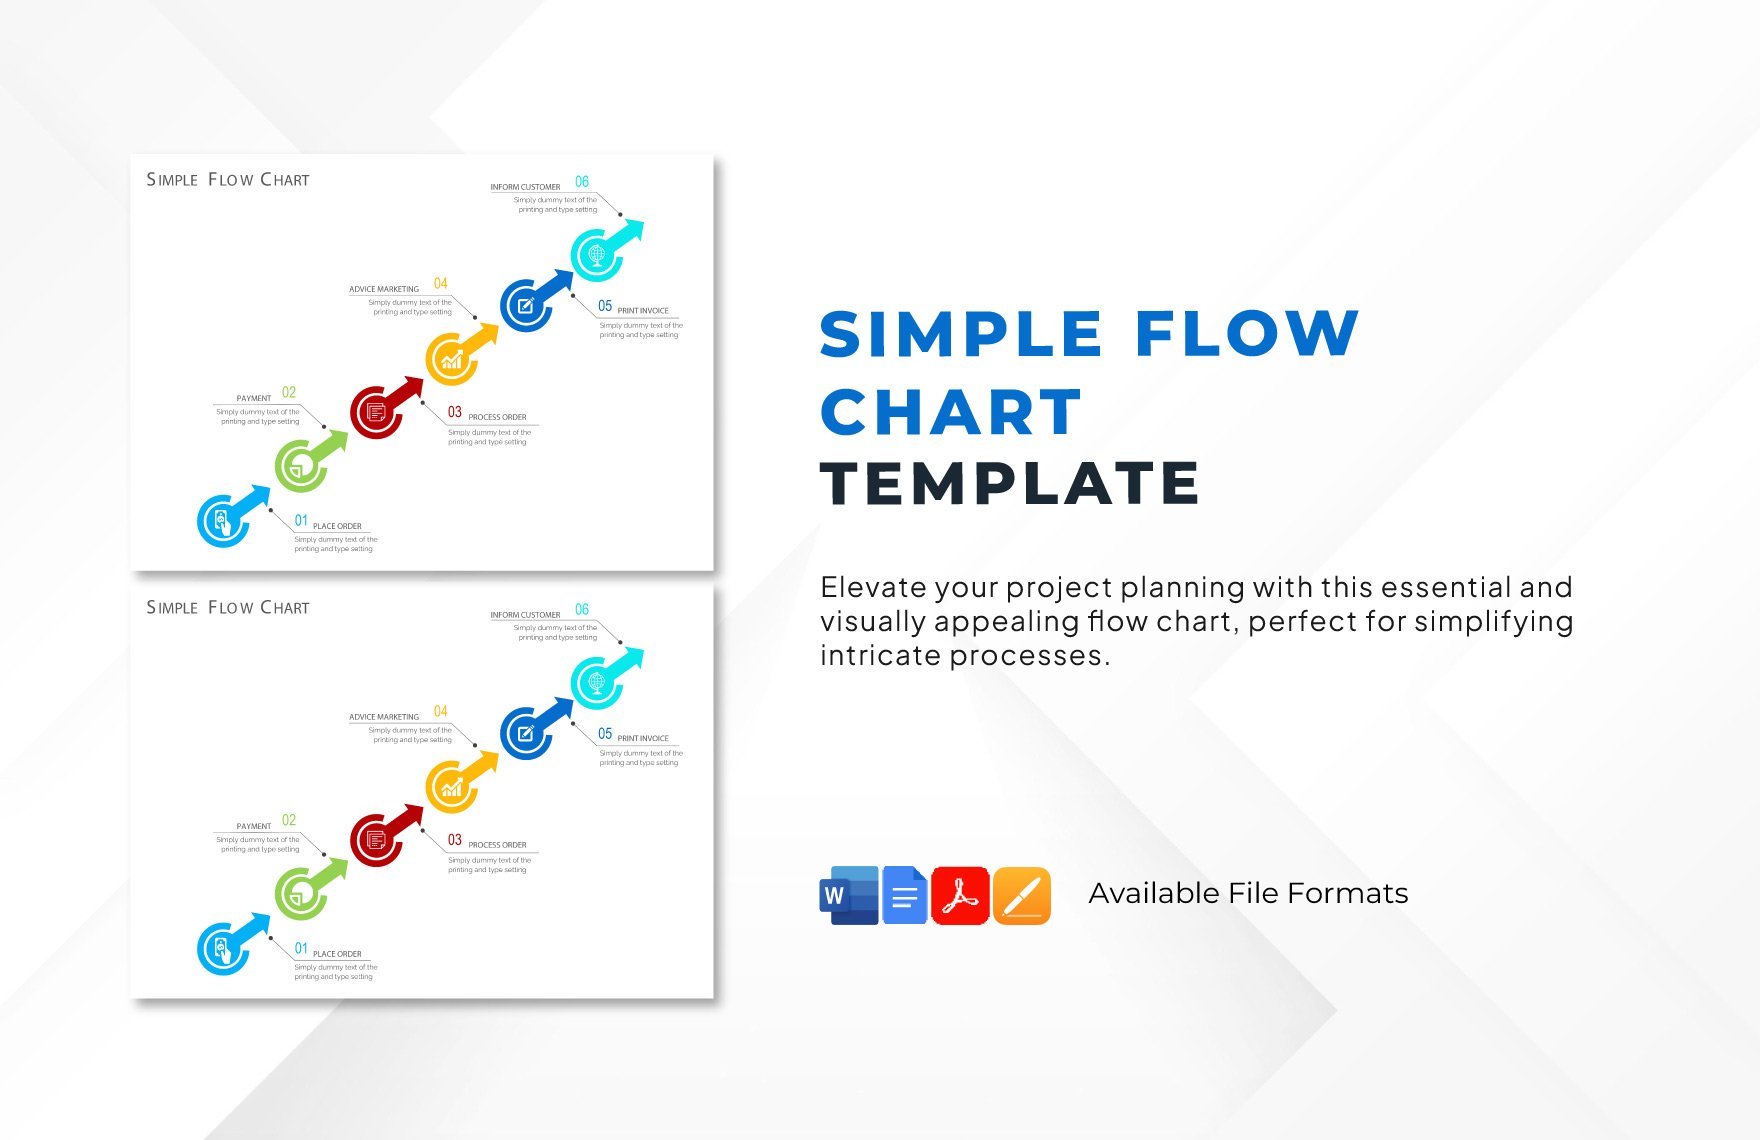
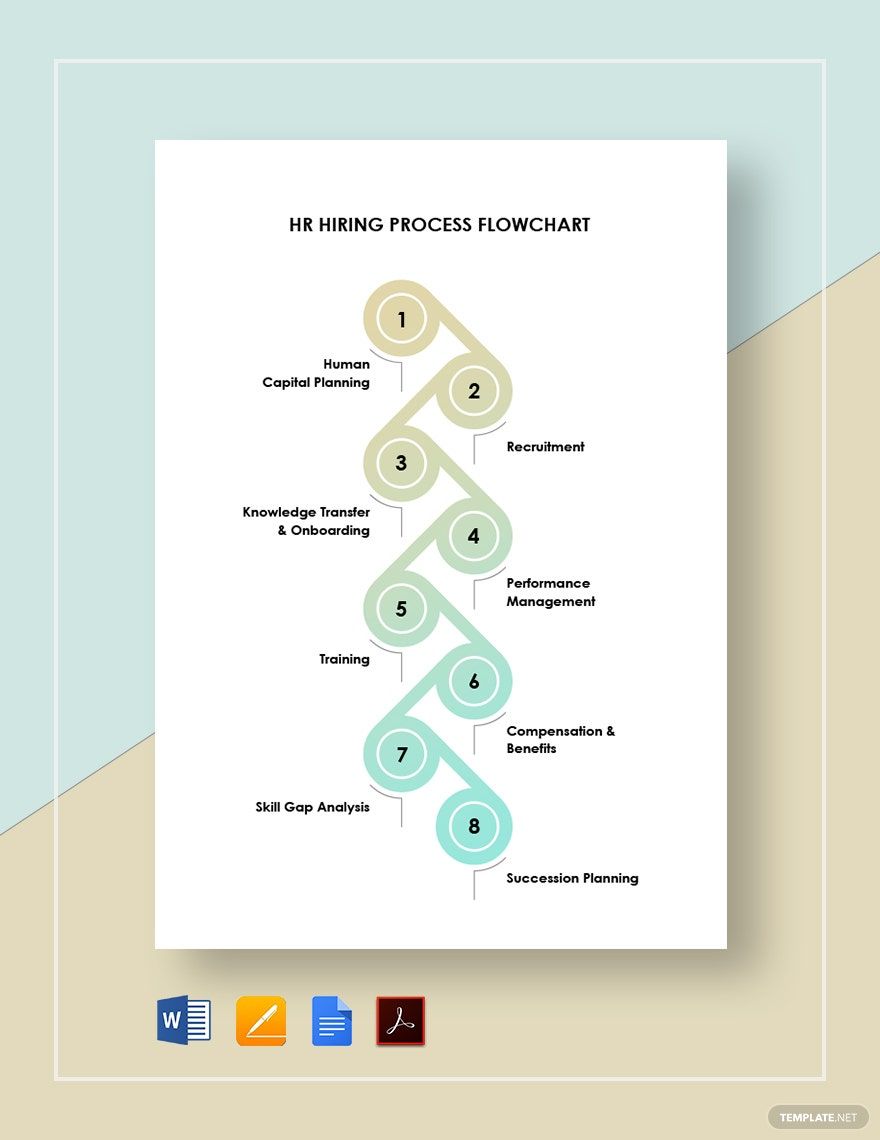
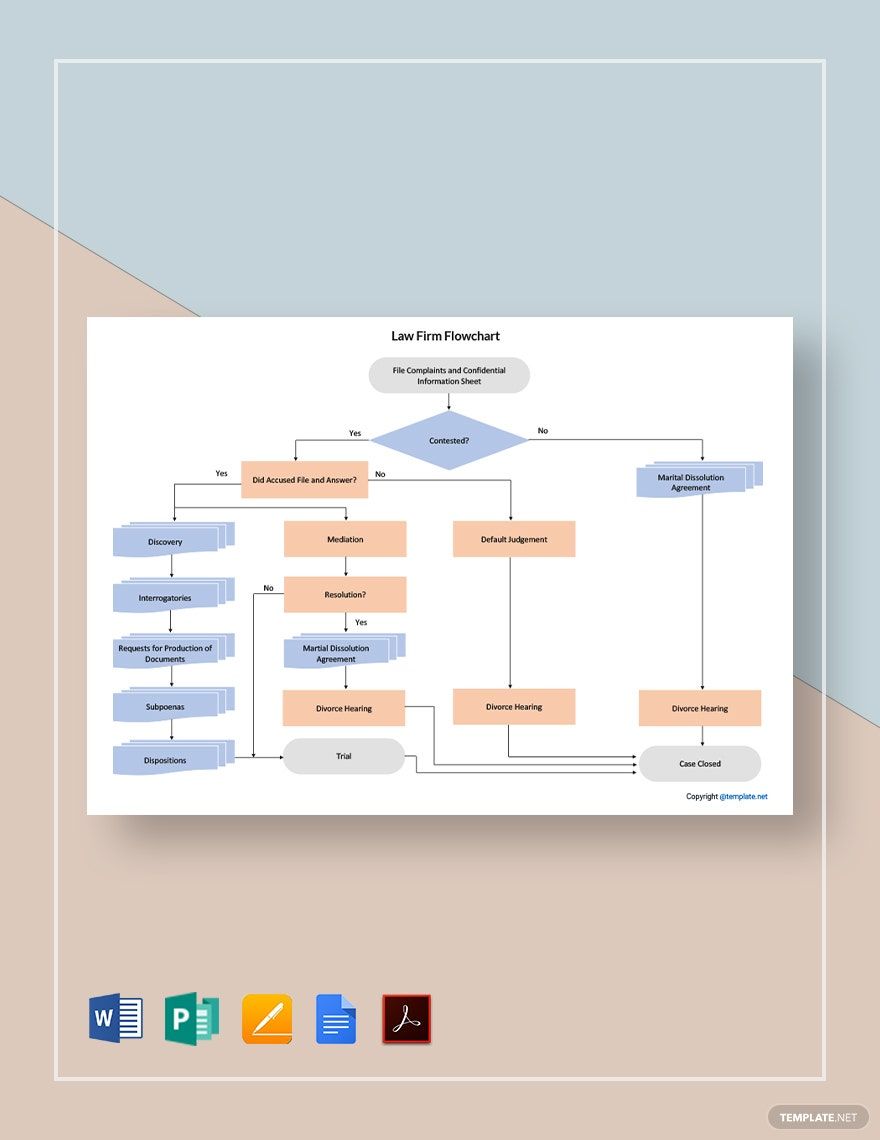
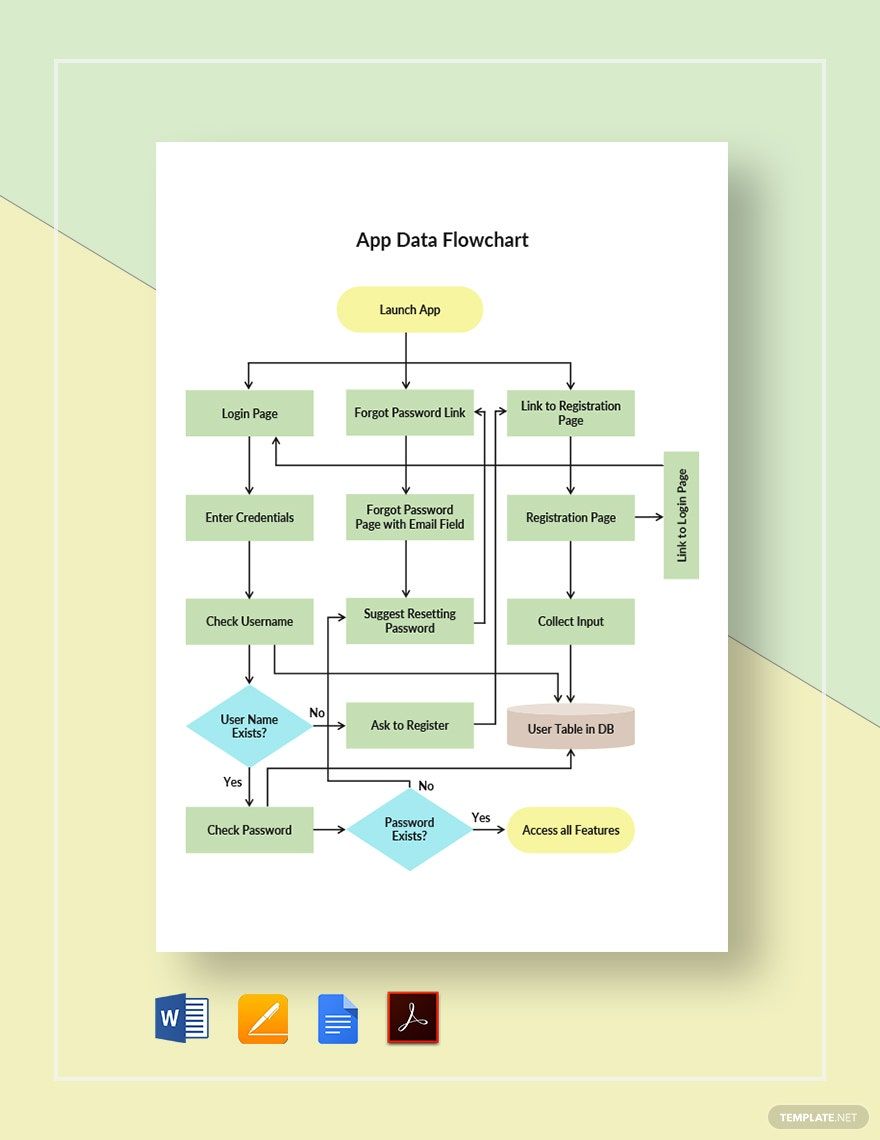
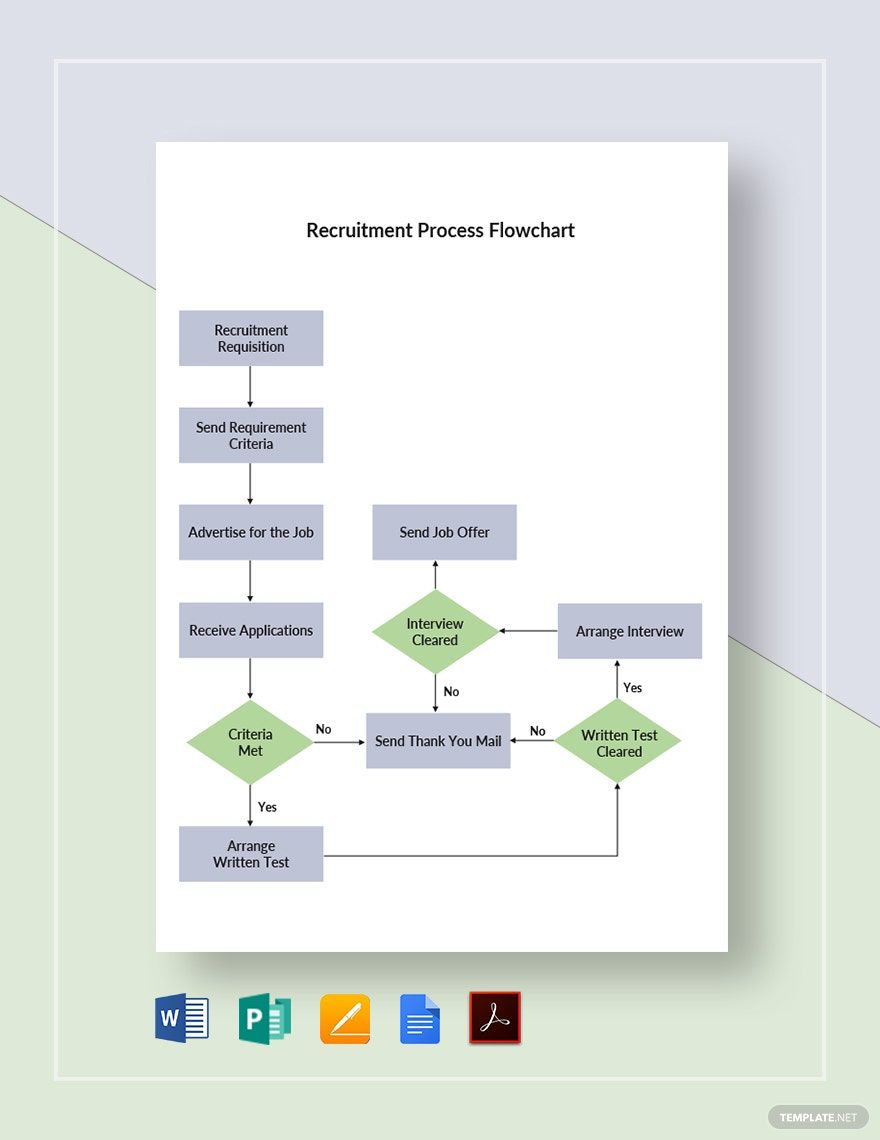
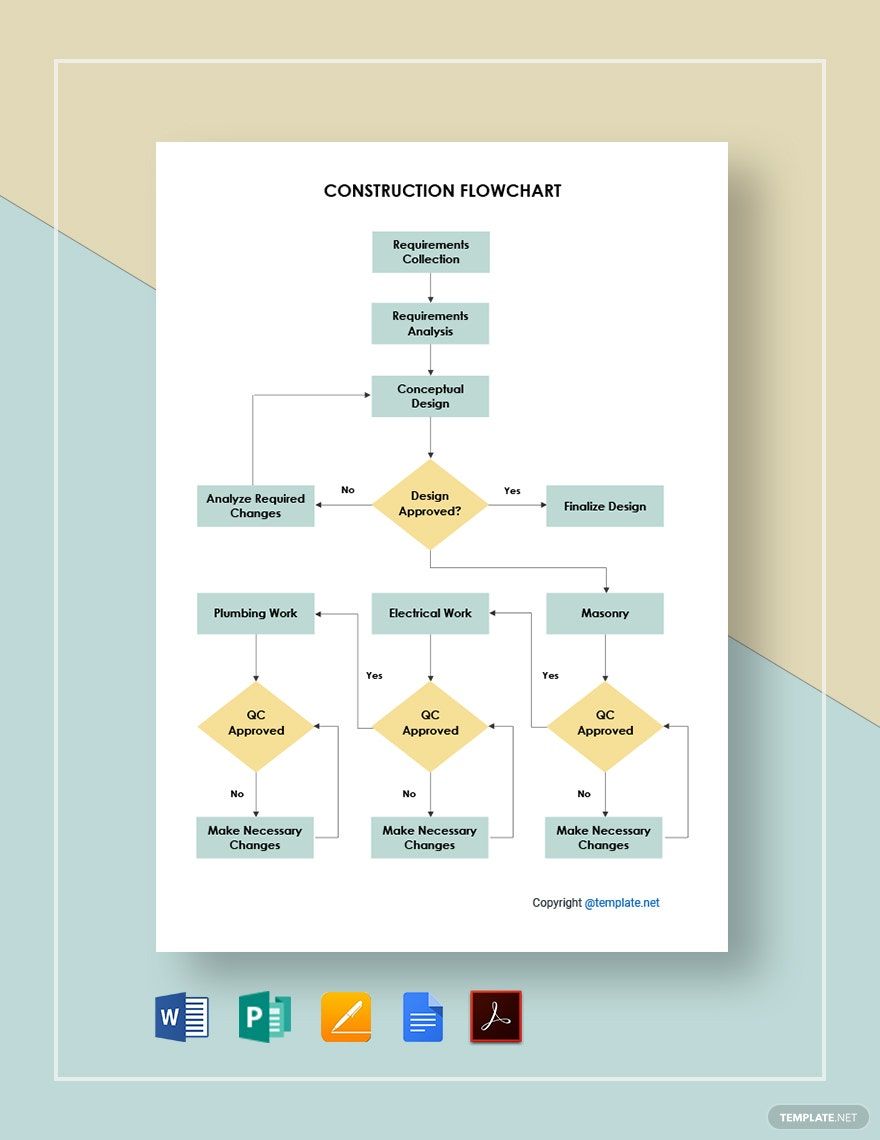
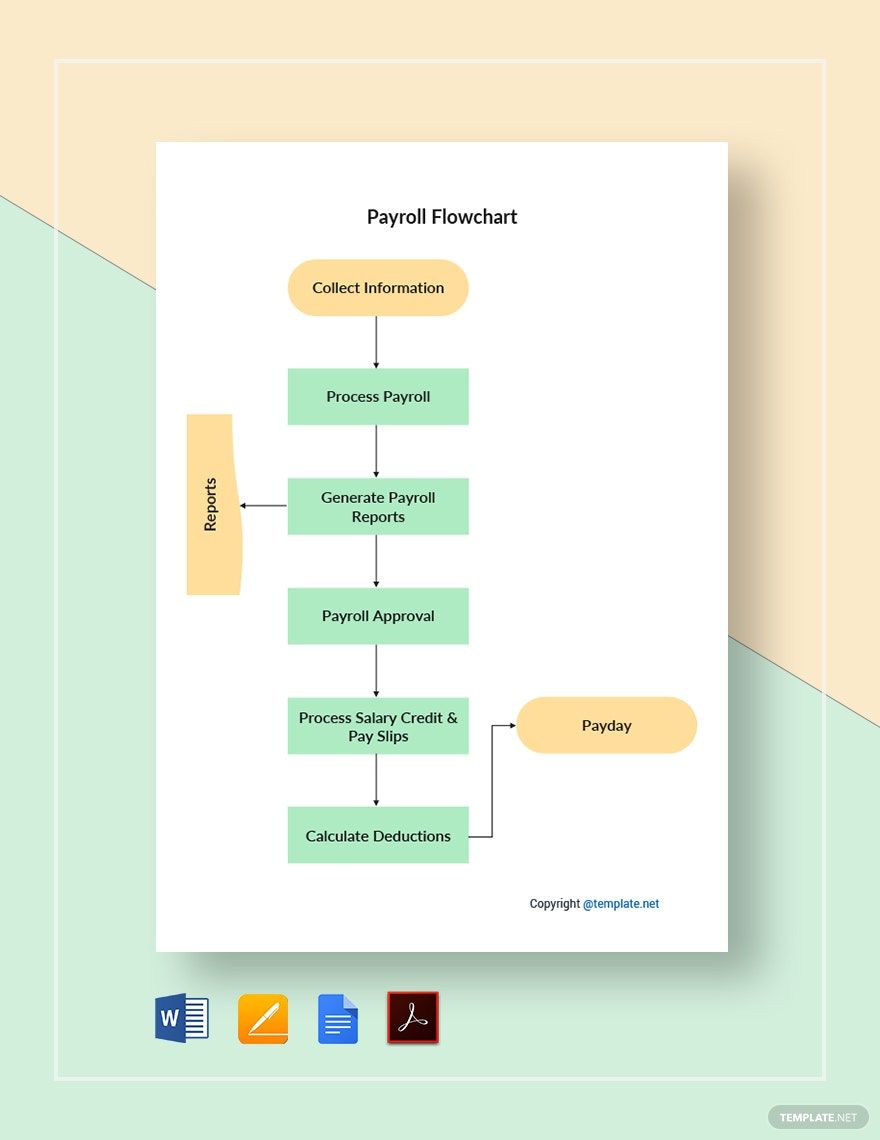
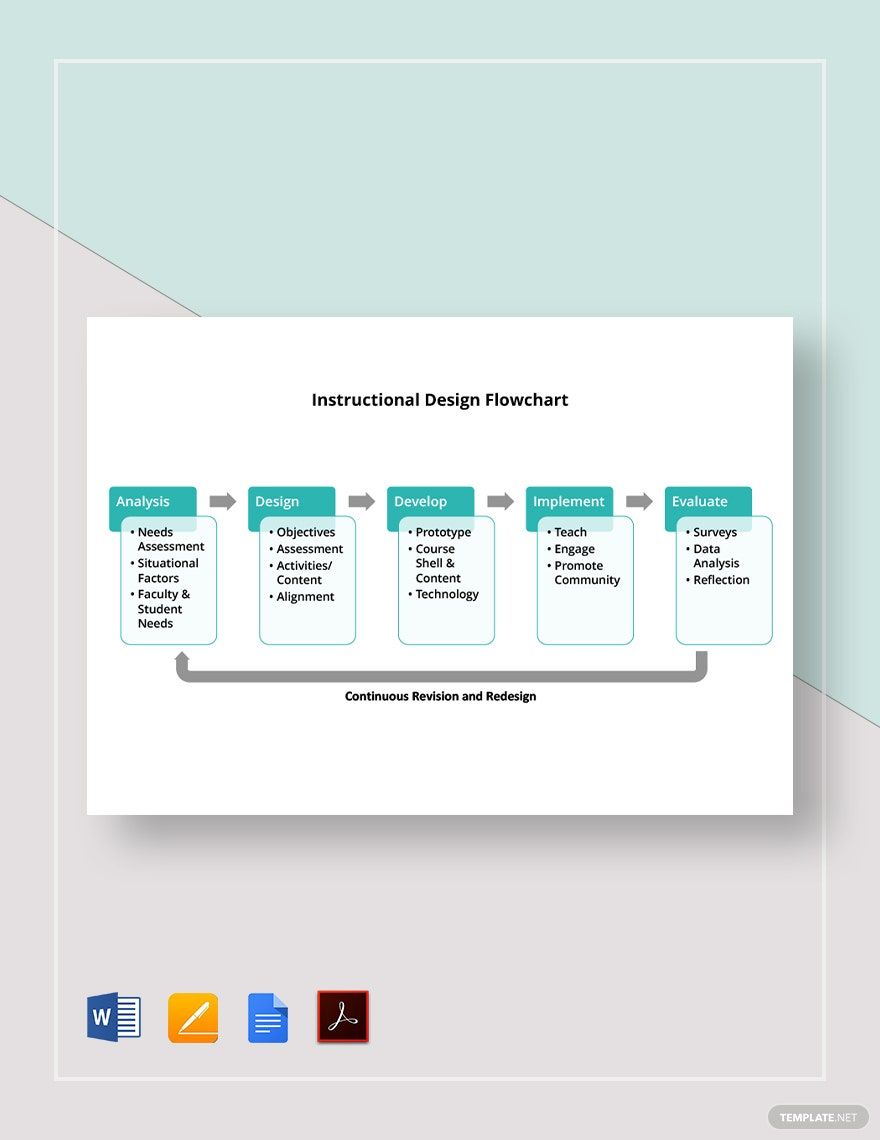
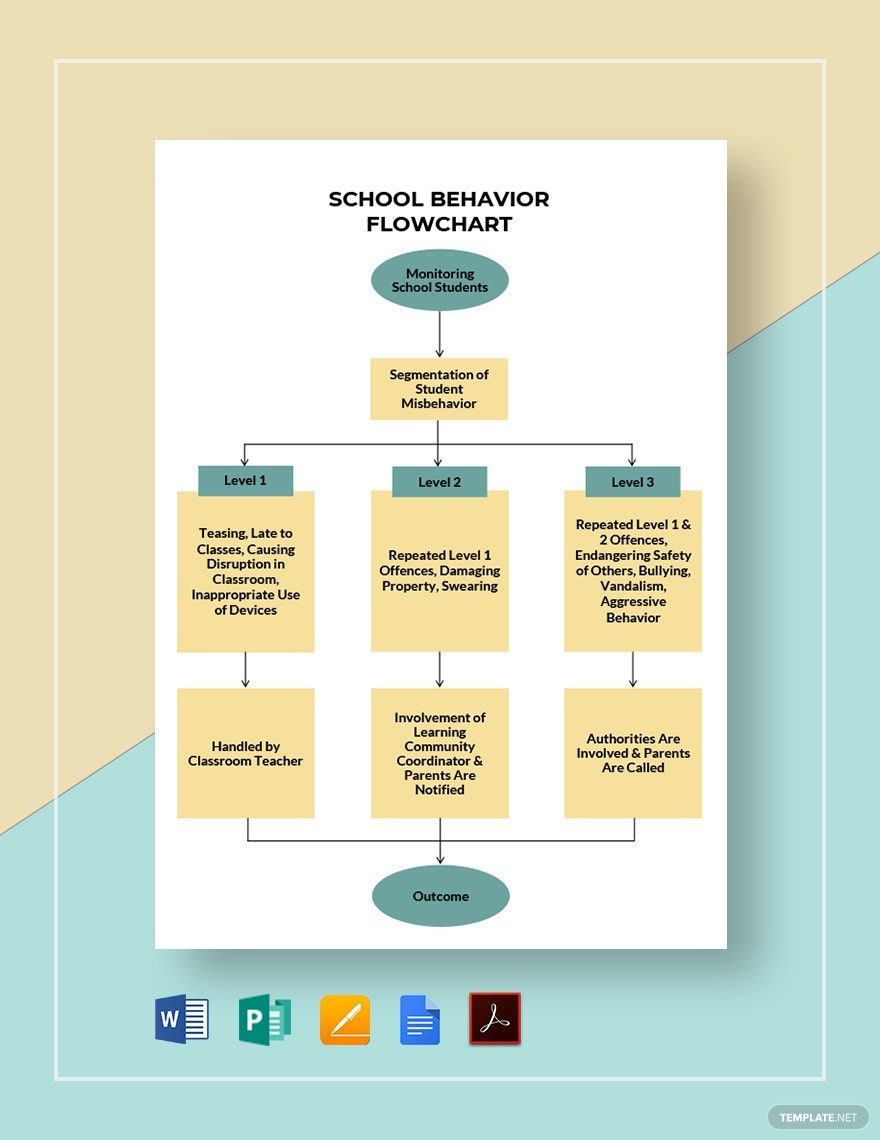
As mentioned earlier, a chart has countless purposes. So before you start creating one, you must first determine its purpose. The determined purpose of a chart will be the driving force on how it must take form. For instance, if your chart's purpose is to showcase the workflow of your company's operations, you should form it into a flow chart. If that's the case, it's advisable to use any of our flow chart templates.
3. Align The Chart's Columns, Rows, and Lines
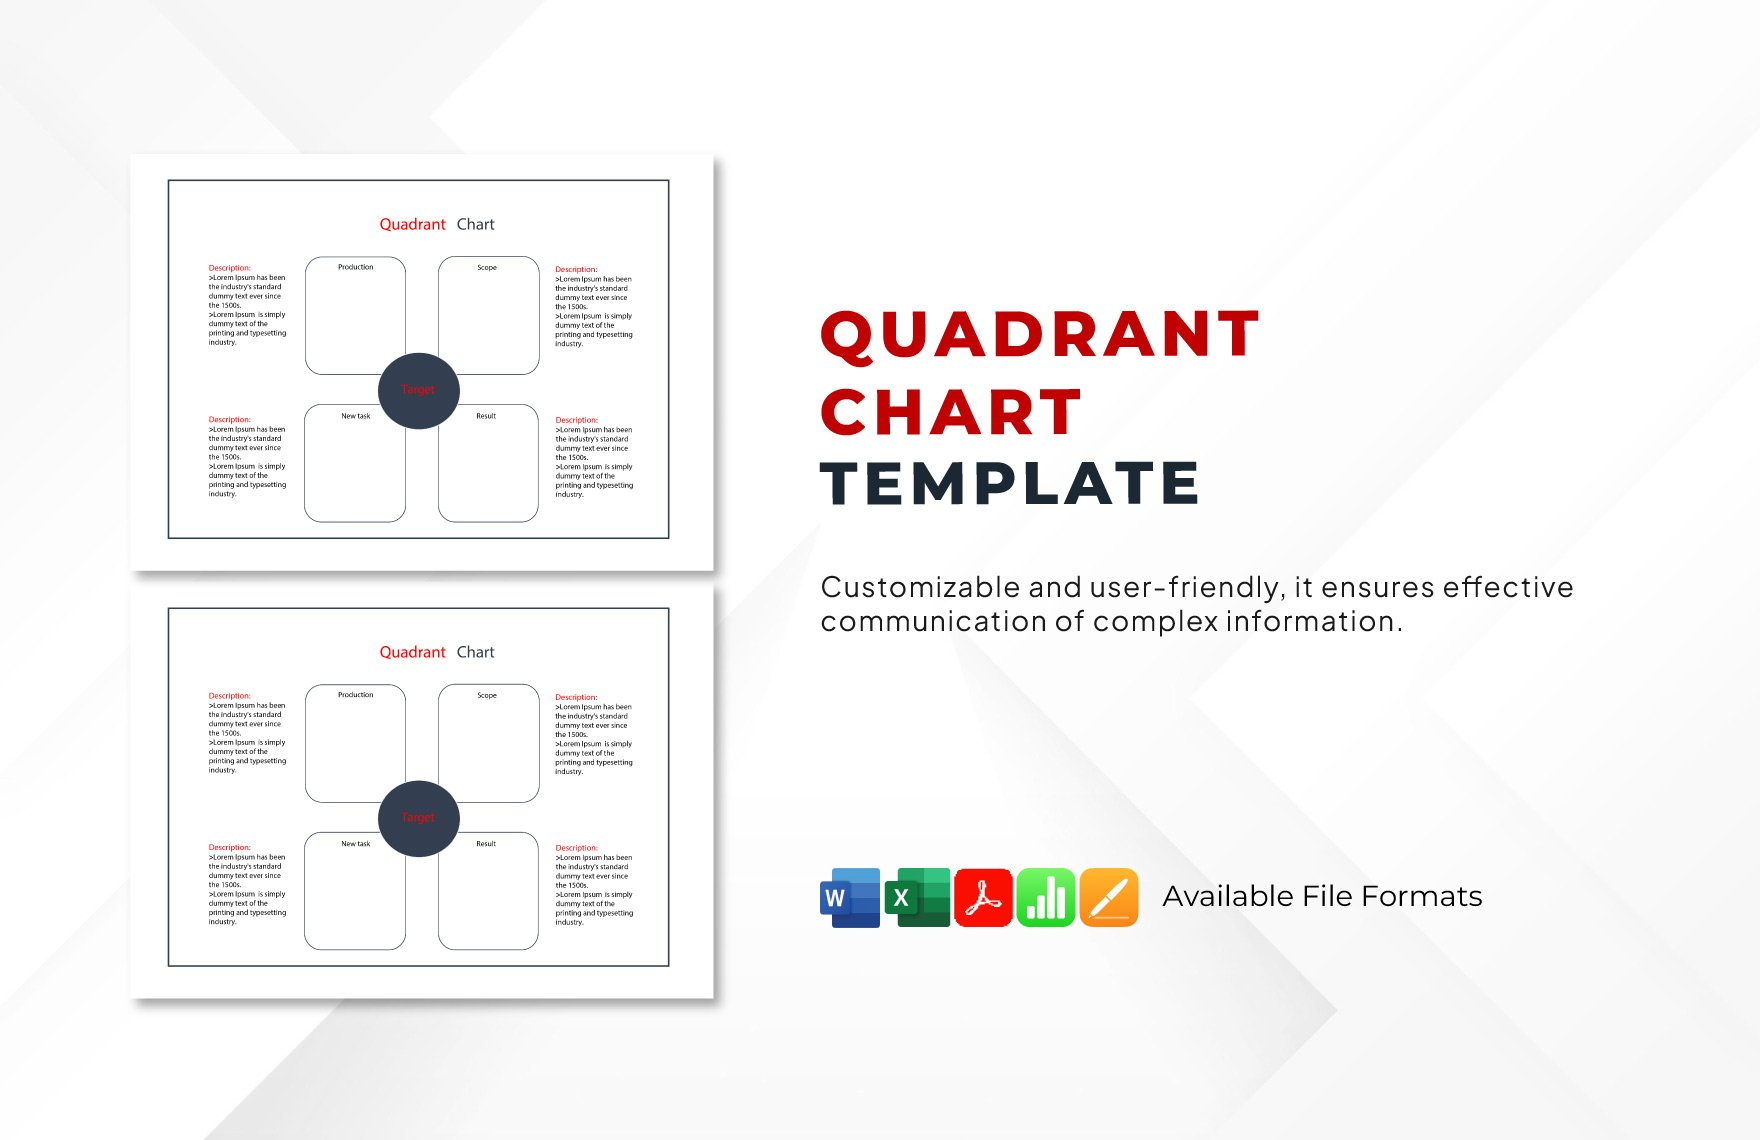
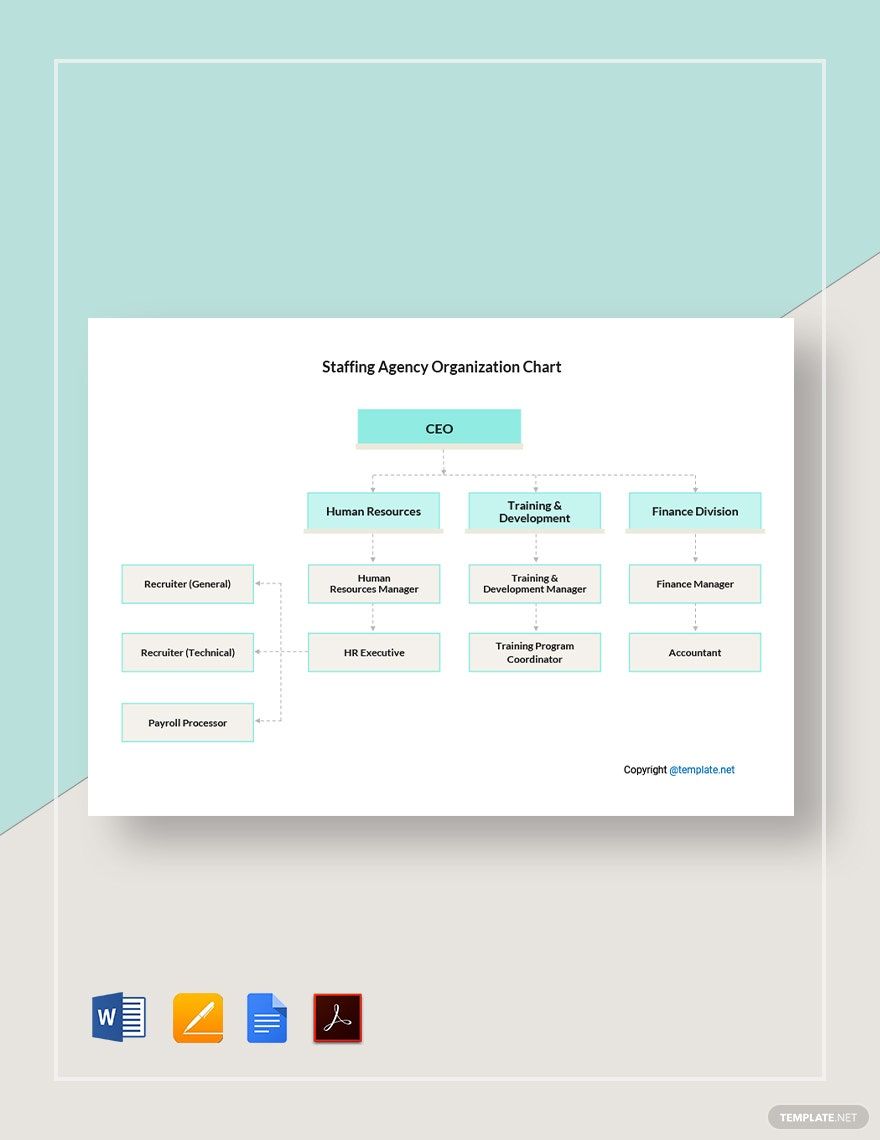
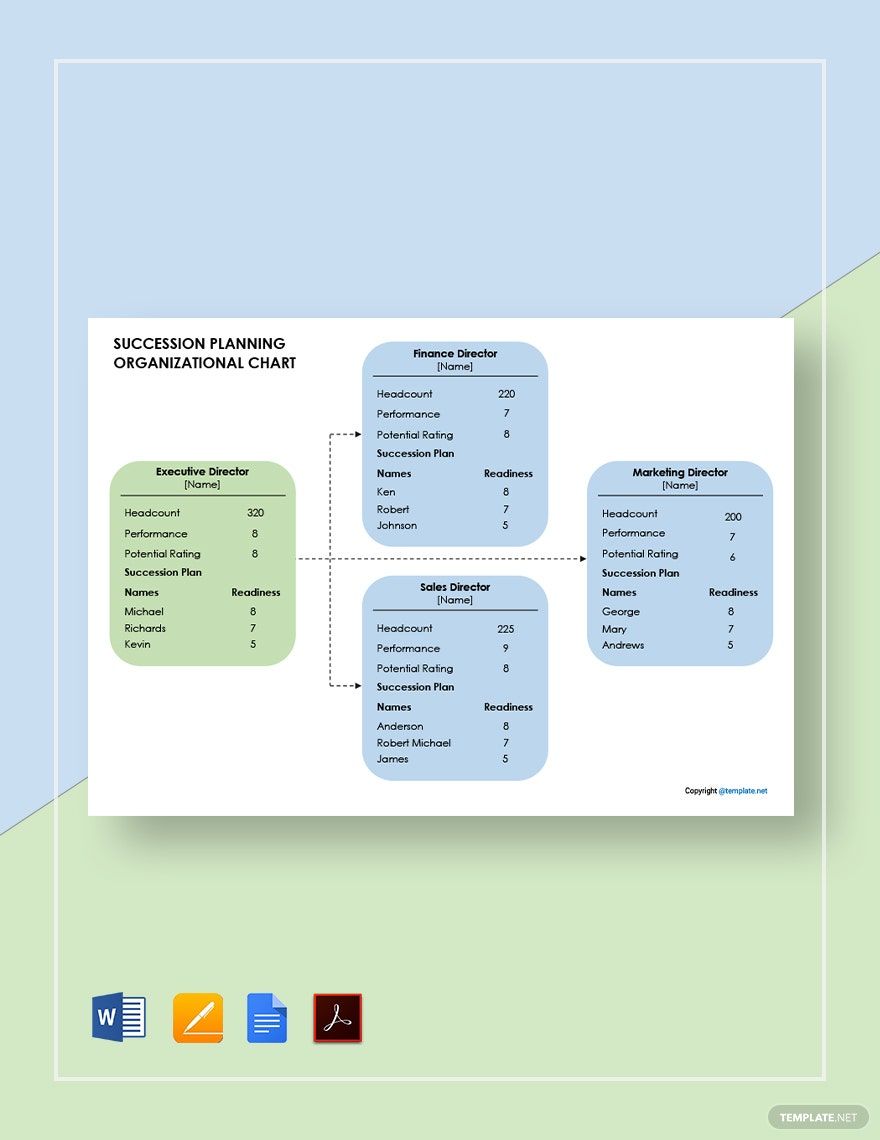
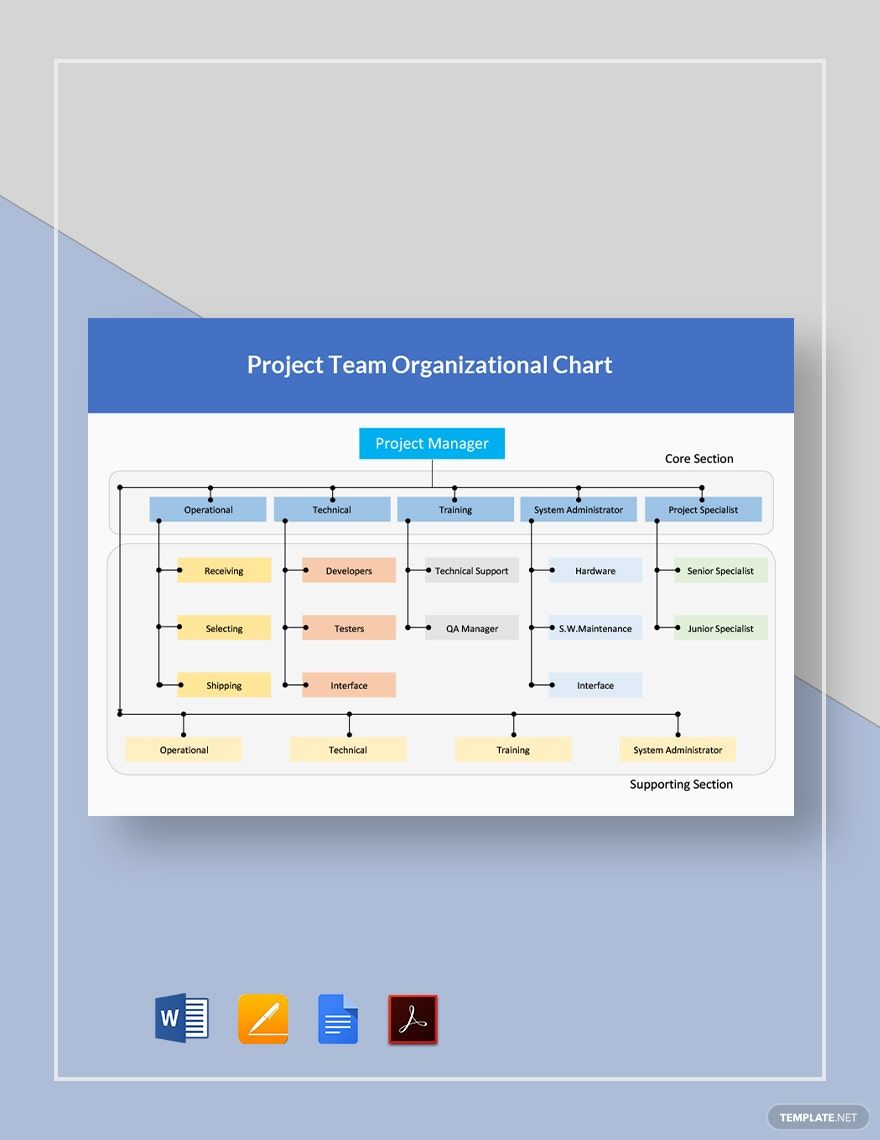
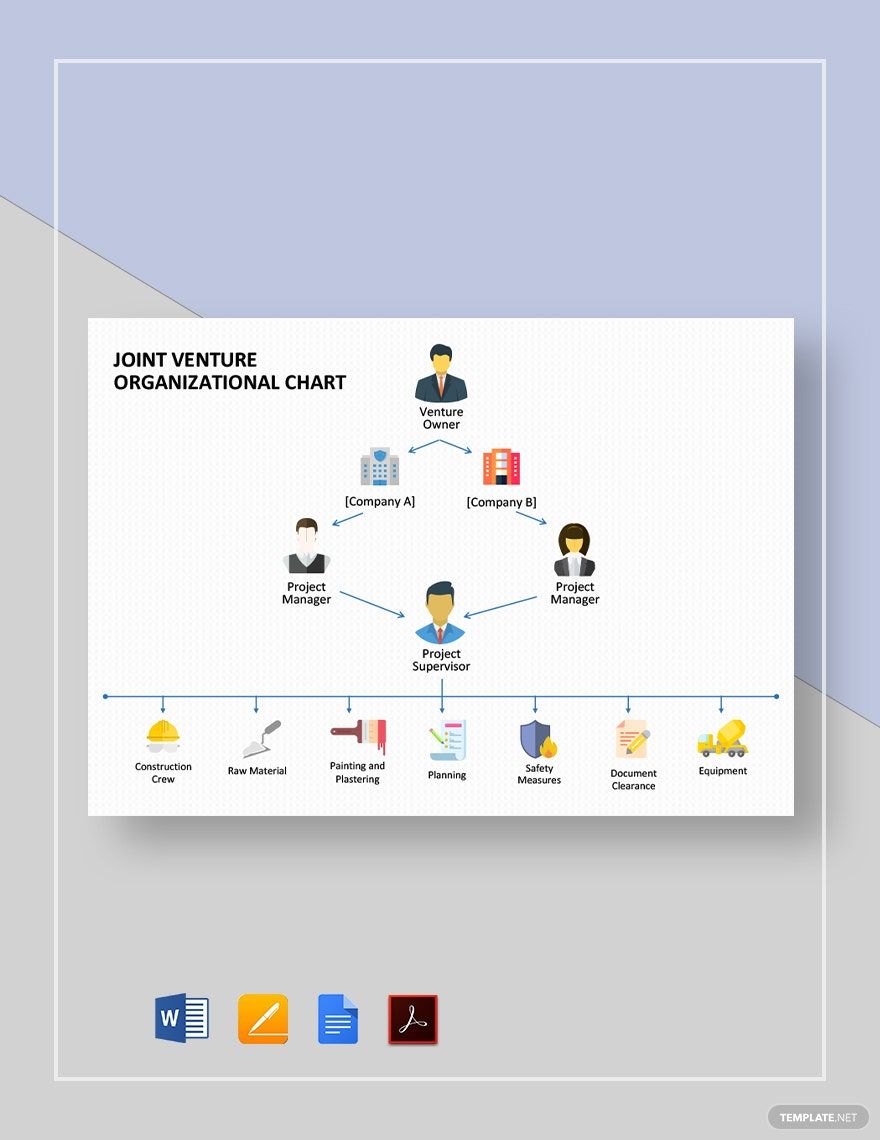
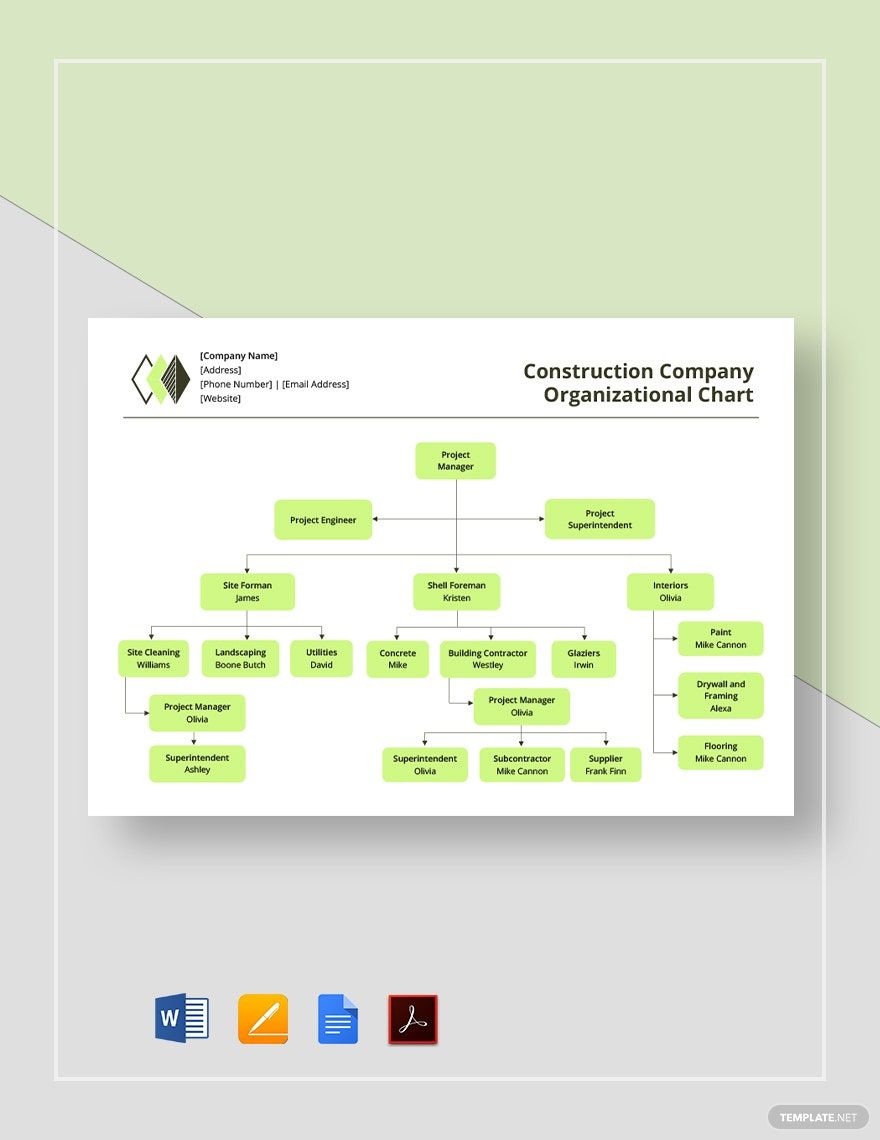
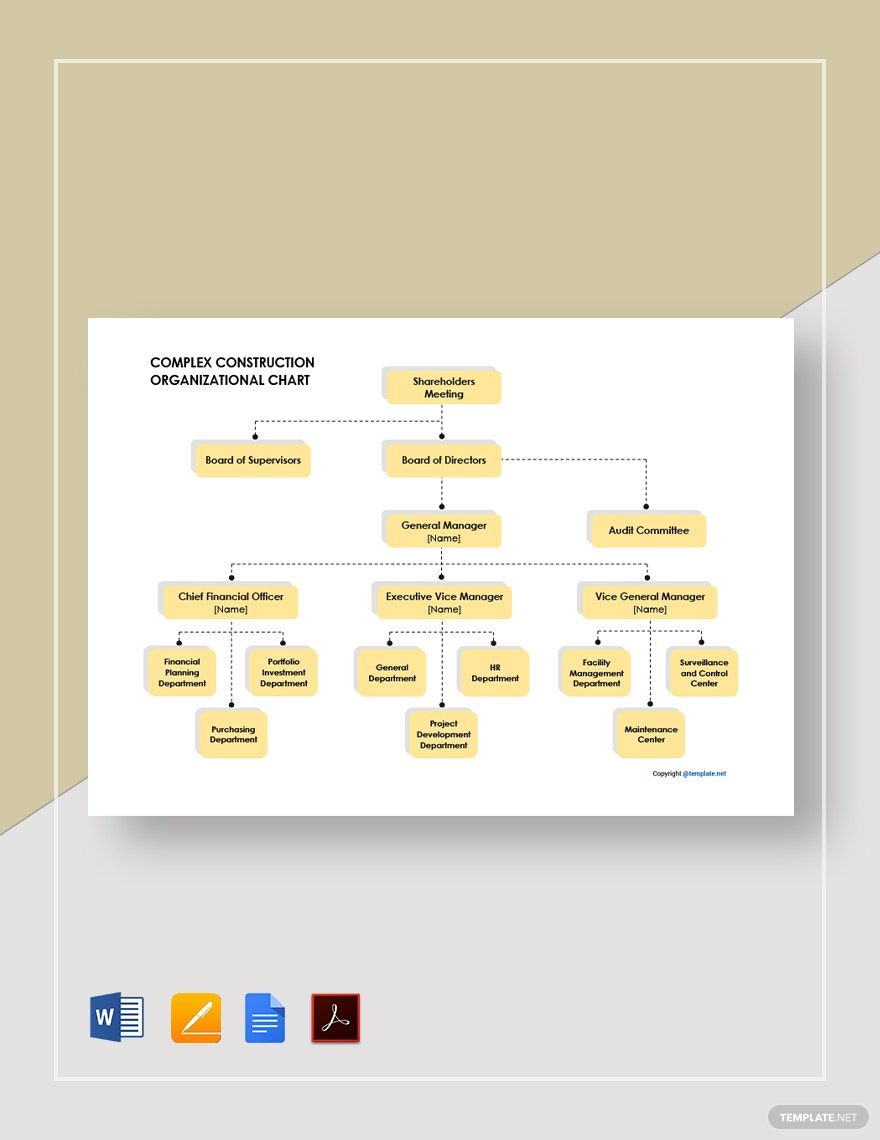
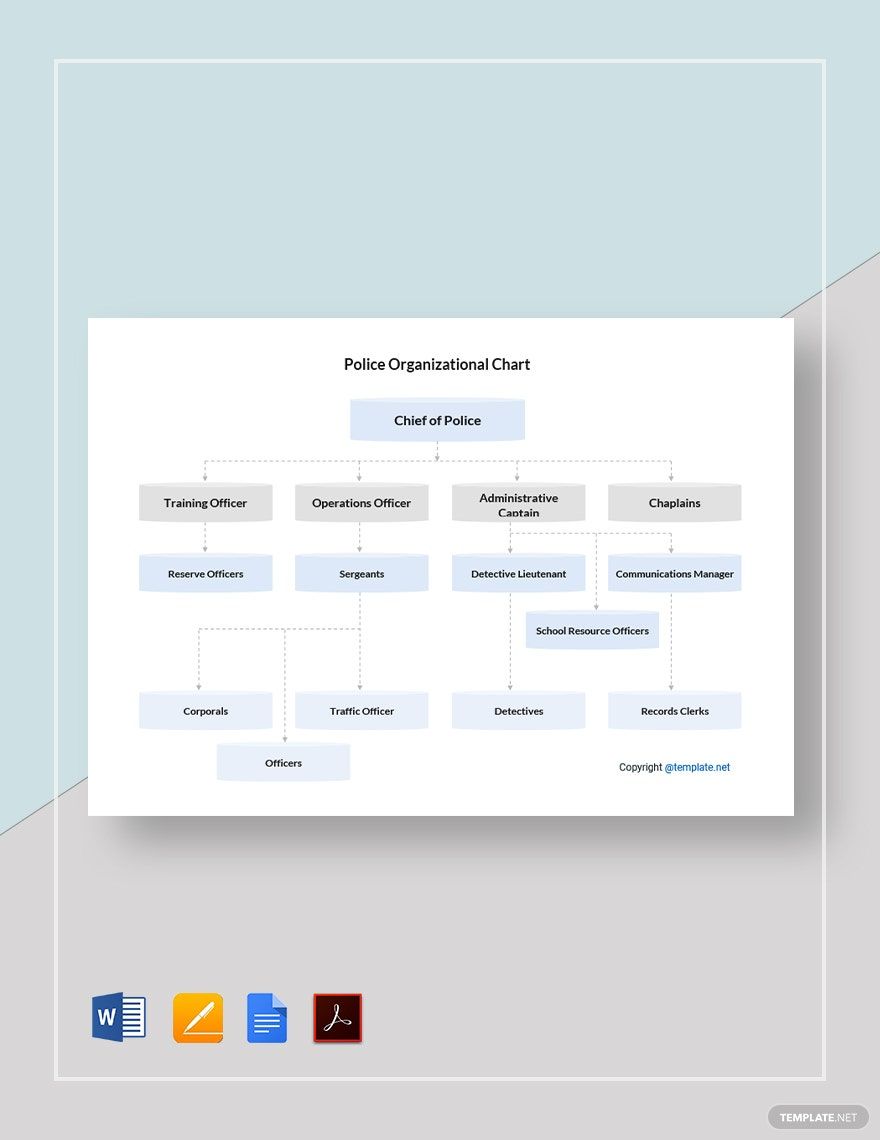
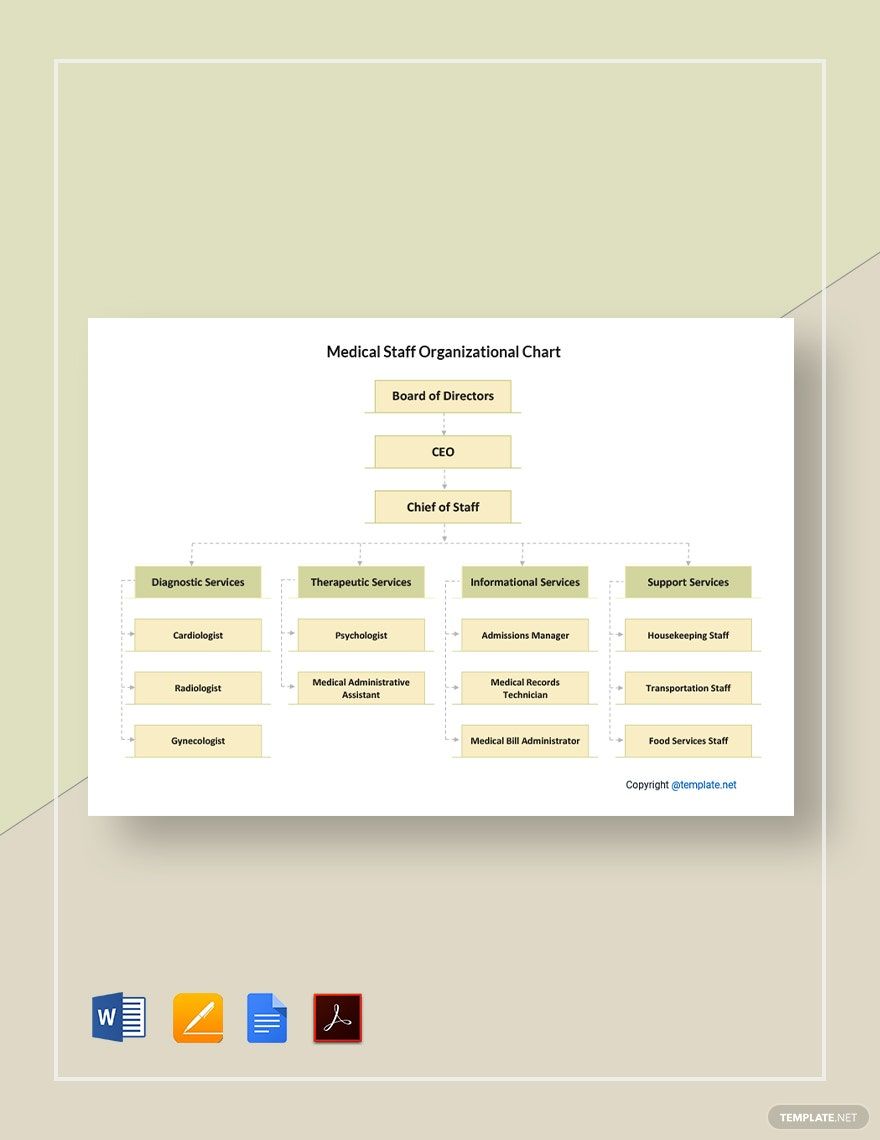
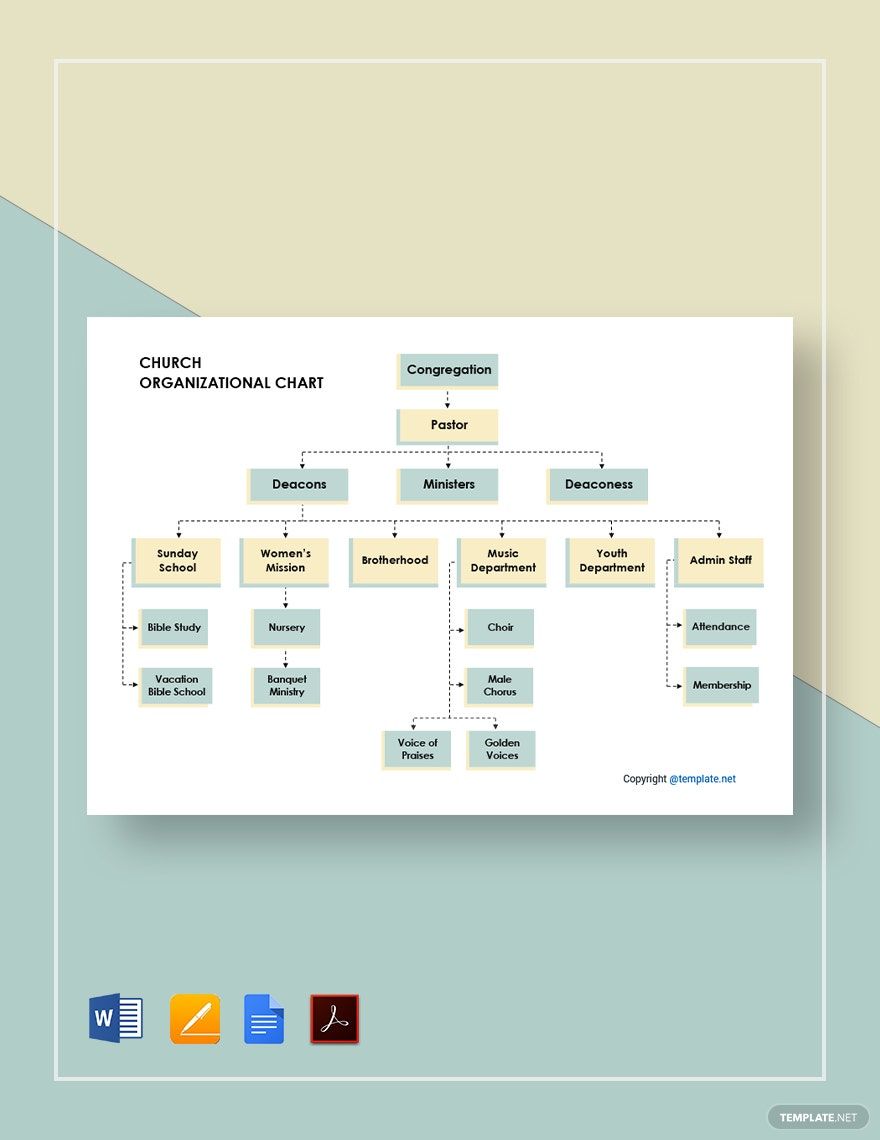
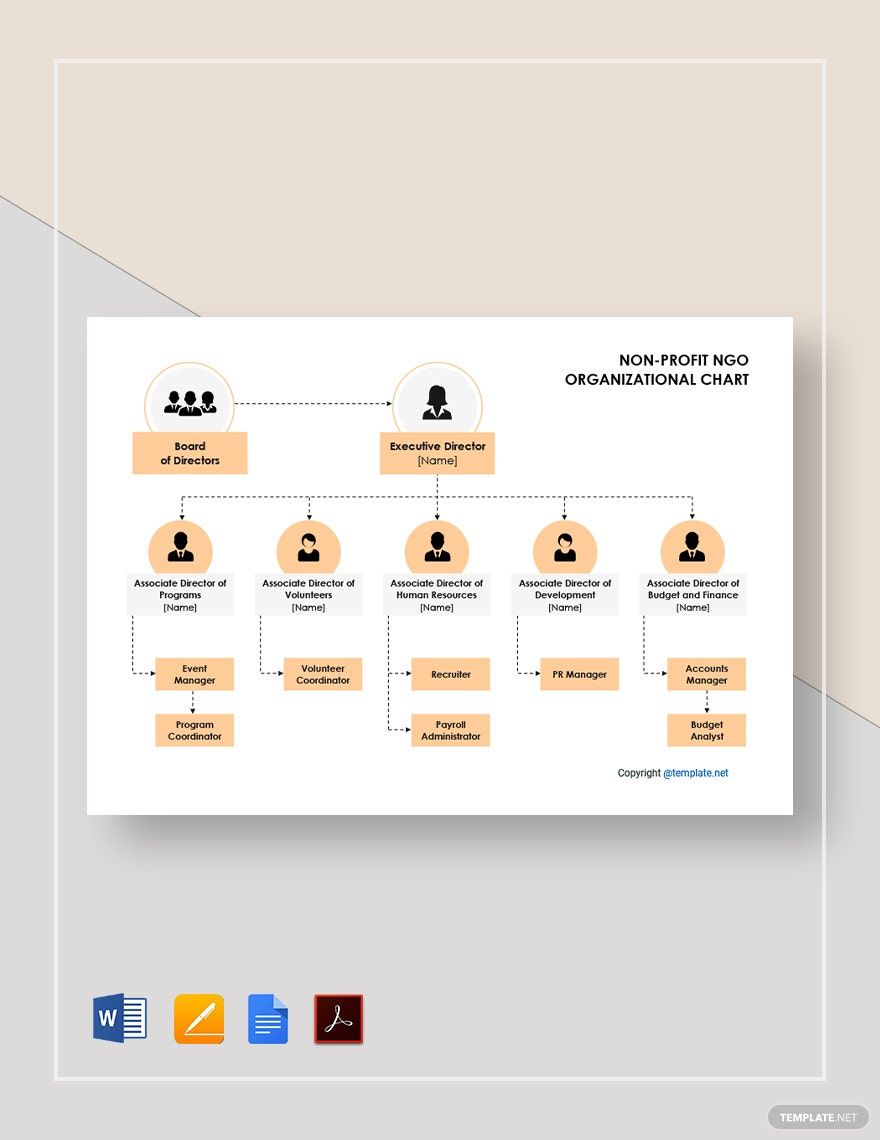
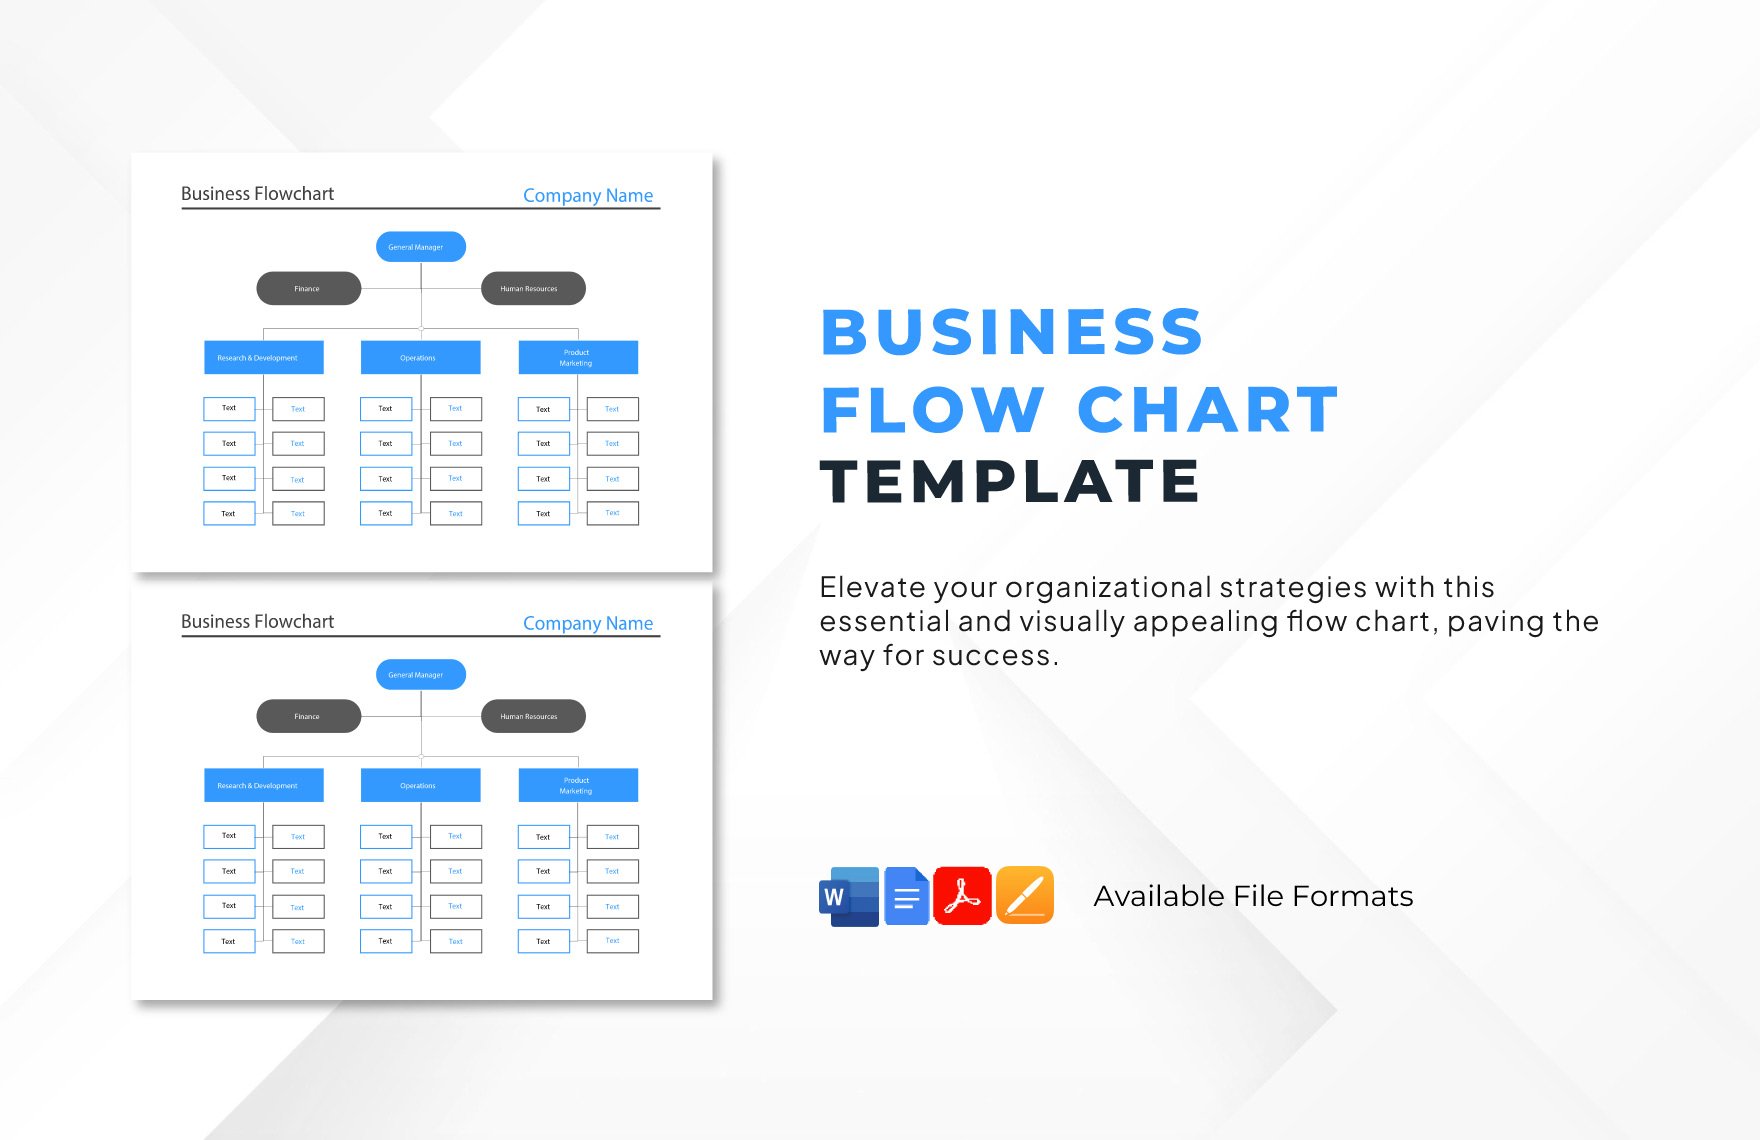
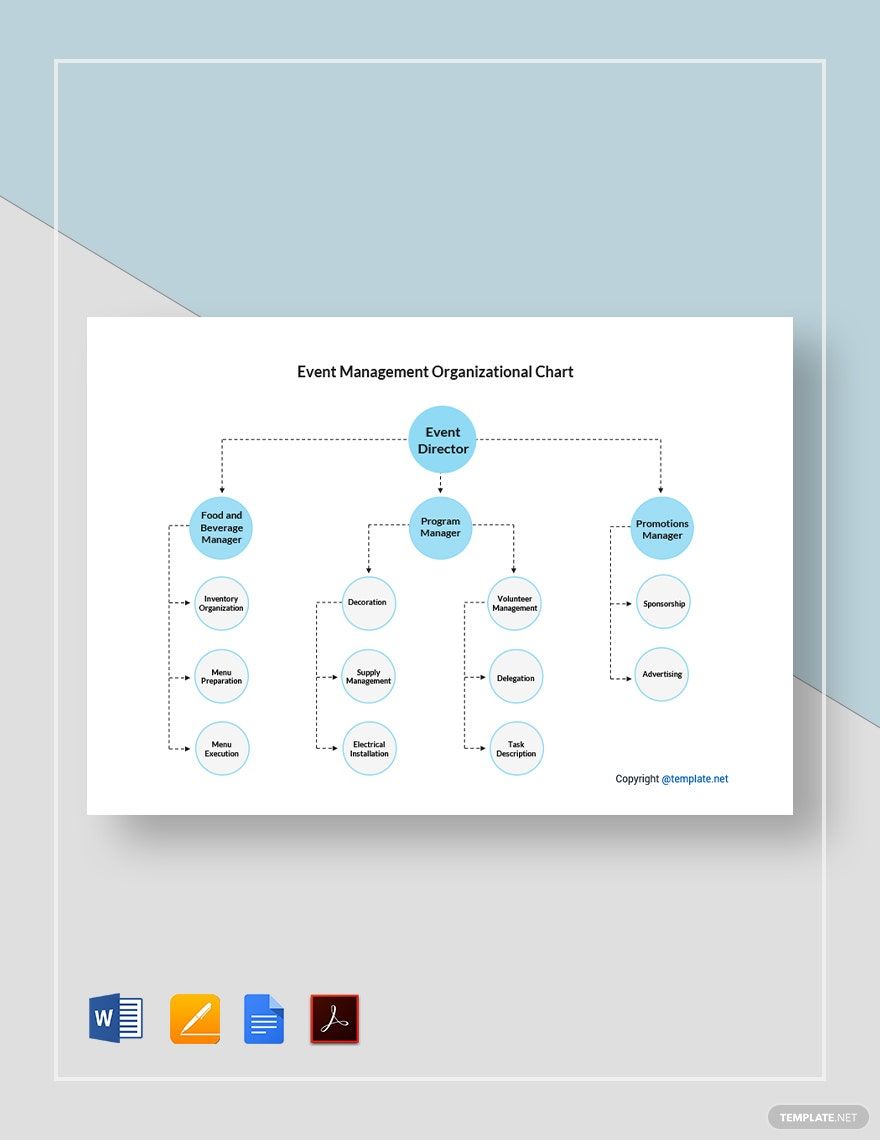
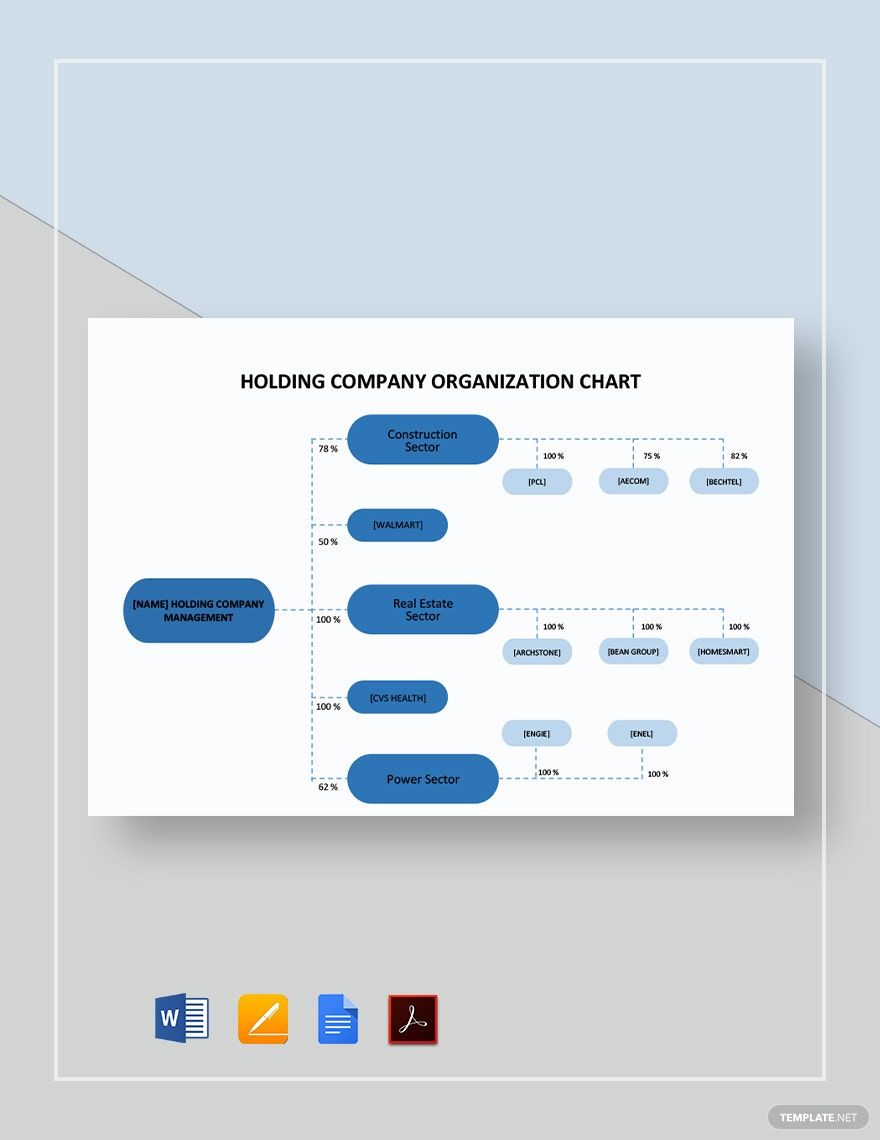
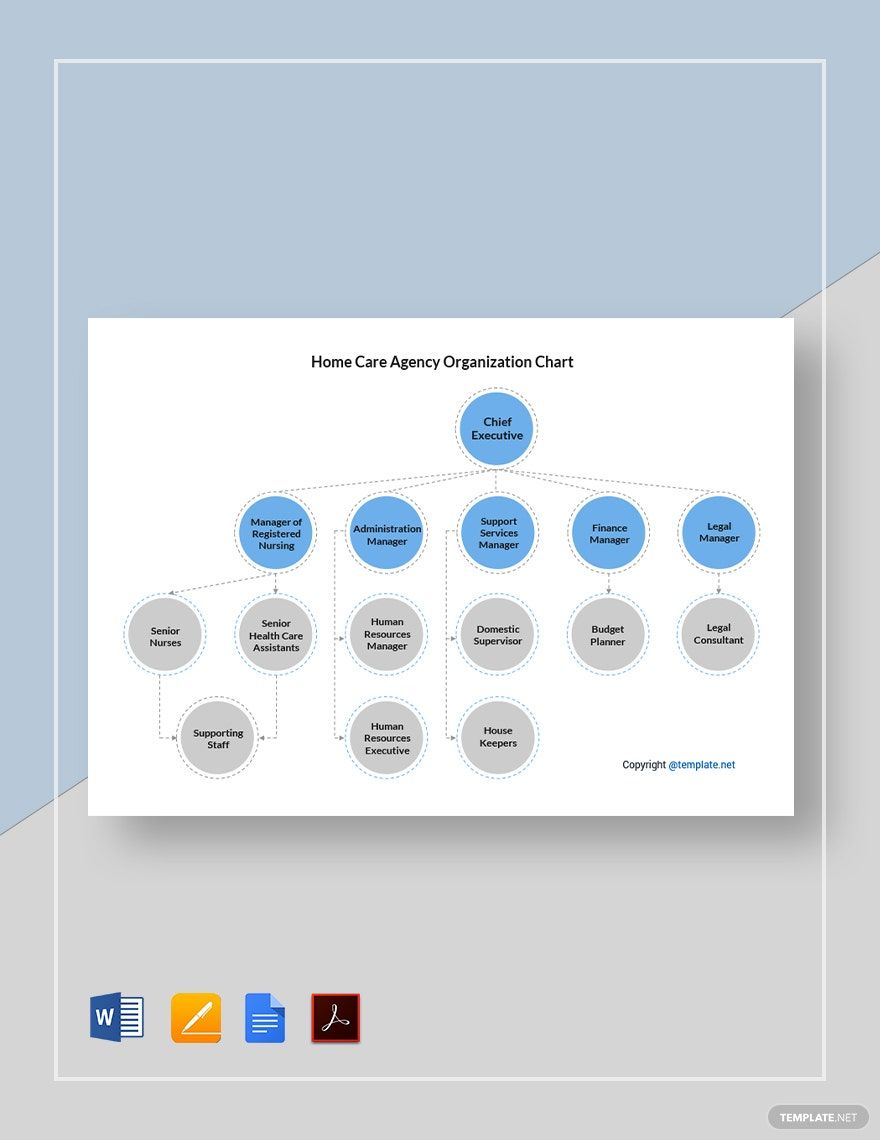
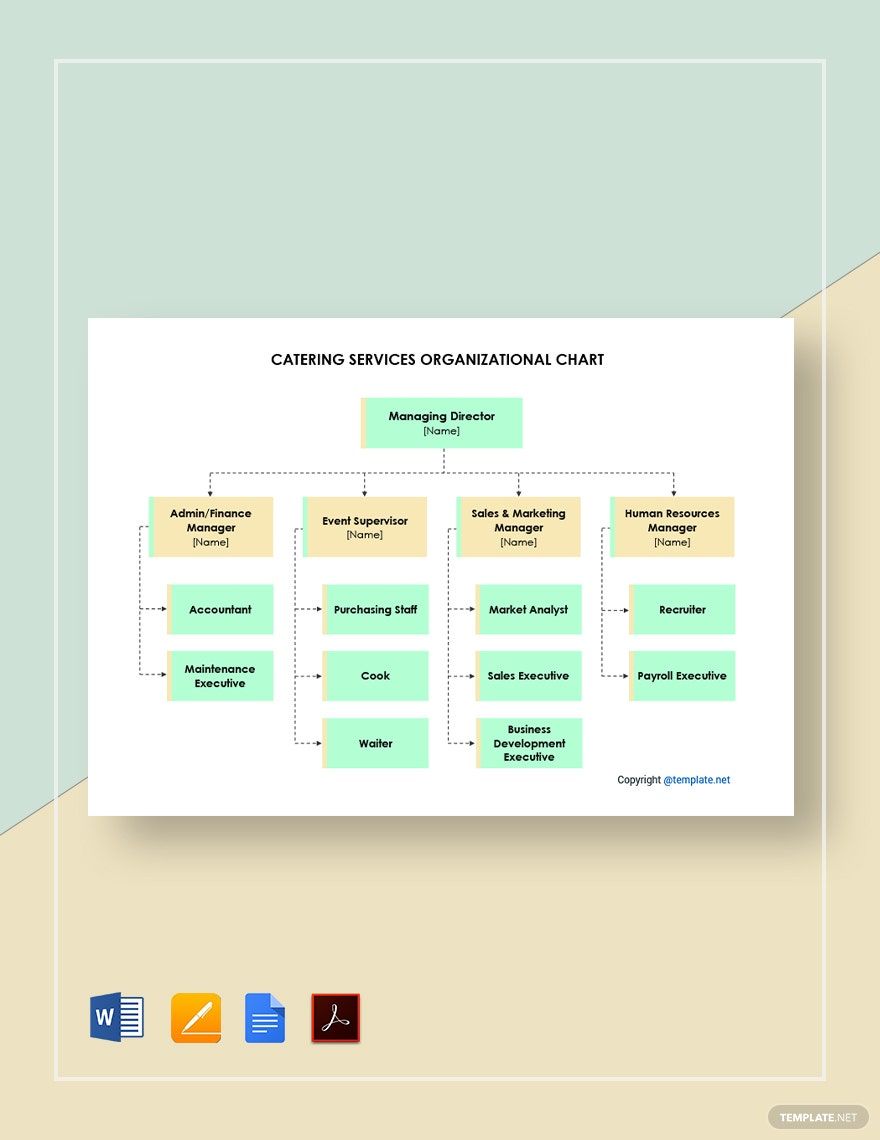
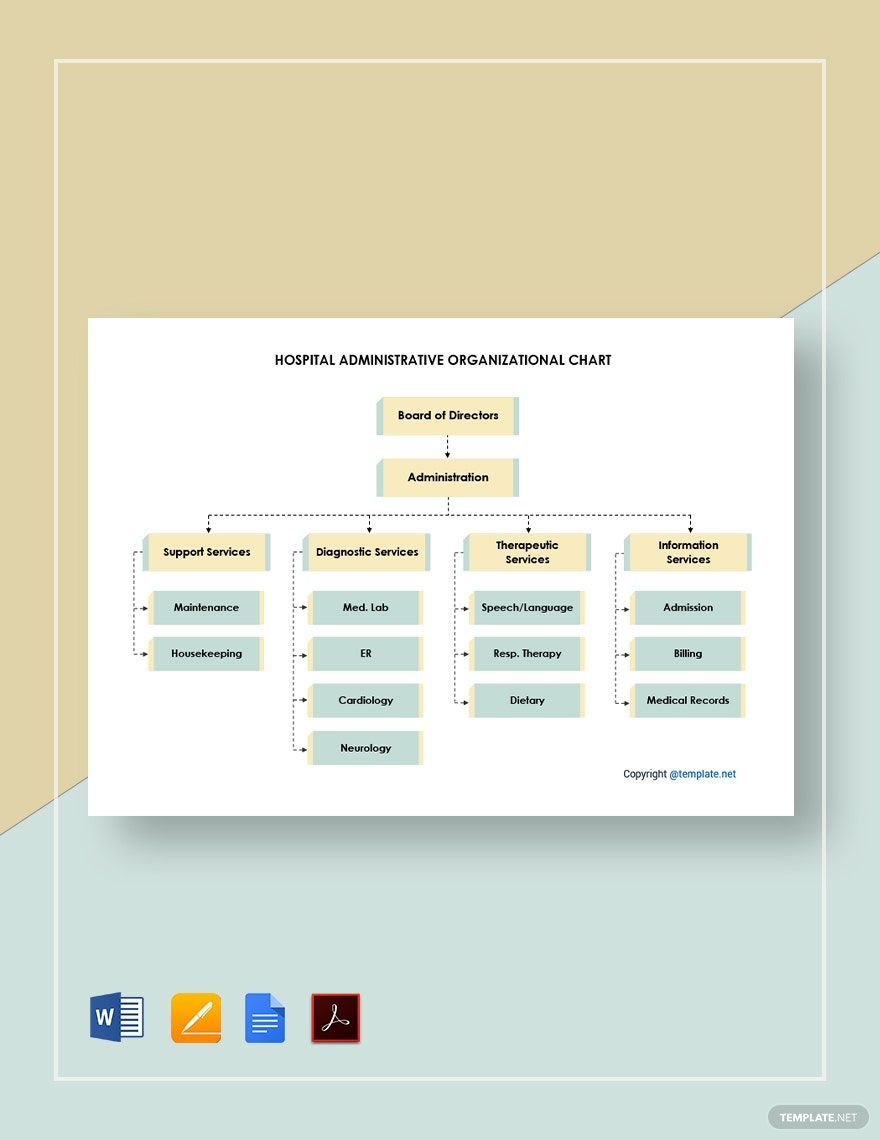
One of the main functions of a chart is to organize data, statistics, and information. So if a chart looks disorganized and messy, then it failed to serve its purpose. That's why it's important that you must align its columns, rows, and lines accordingly. An excellent example of this is our organizational chart templates.
4. Gather Every Needed Data
Once your chart has already taken form, it's the right time for you to inject all the data that it needs to organize or analyze. What's likely needed are your previous monthly reports, financial reports, and project progress reports. Make sure to inject them accordingly to where it should belong on your chart. You may ask for the assistance of your company's data and stat analyzers to accurately convey the data being presented by your chart.
5. Use Chart Templates
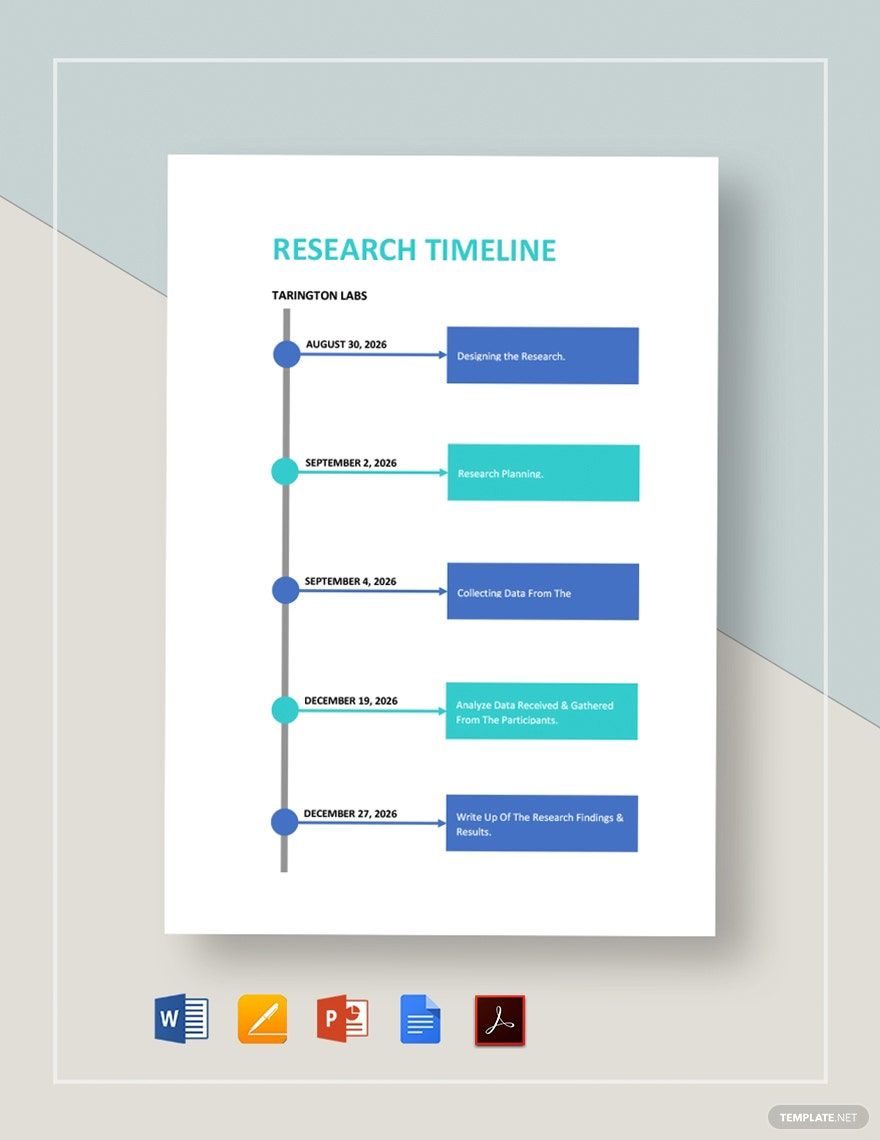
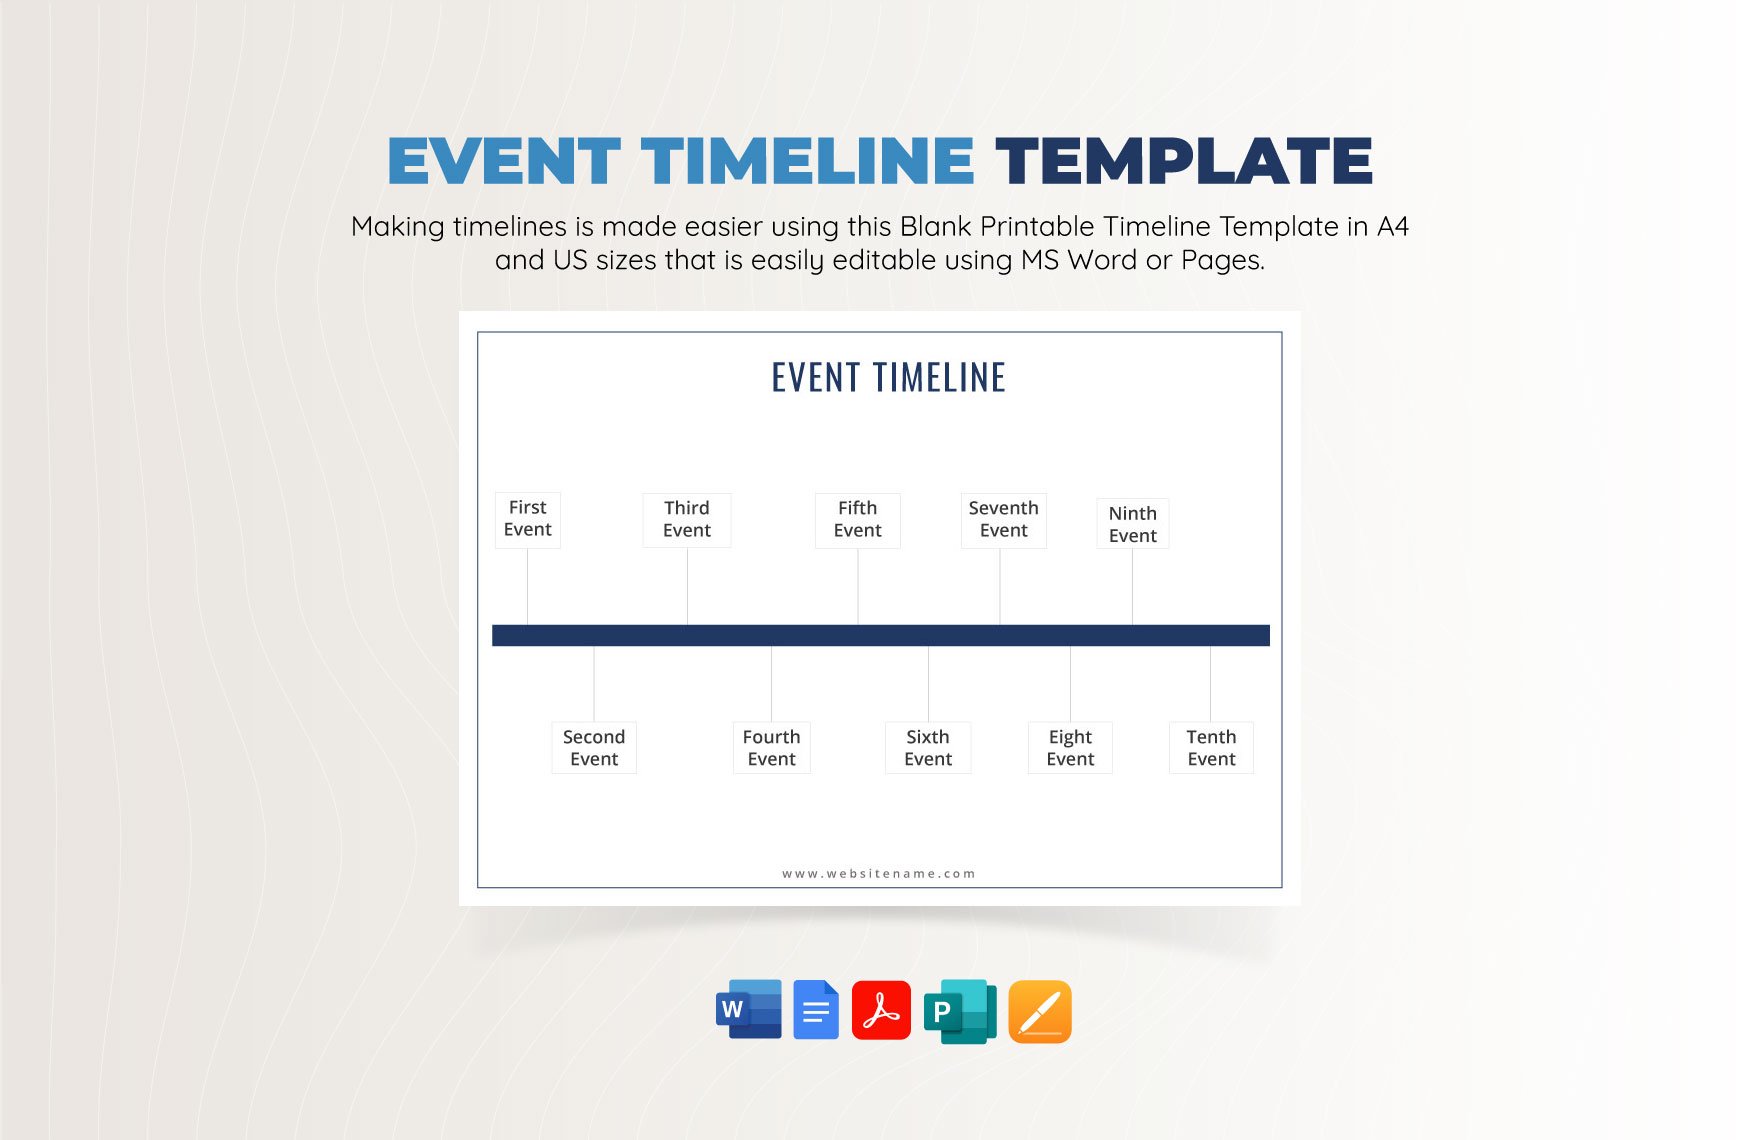
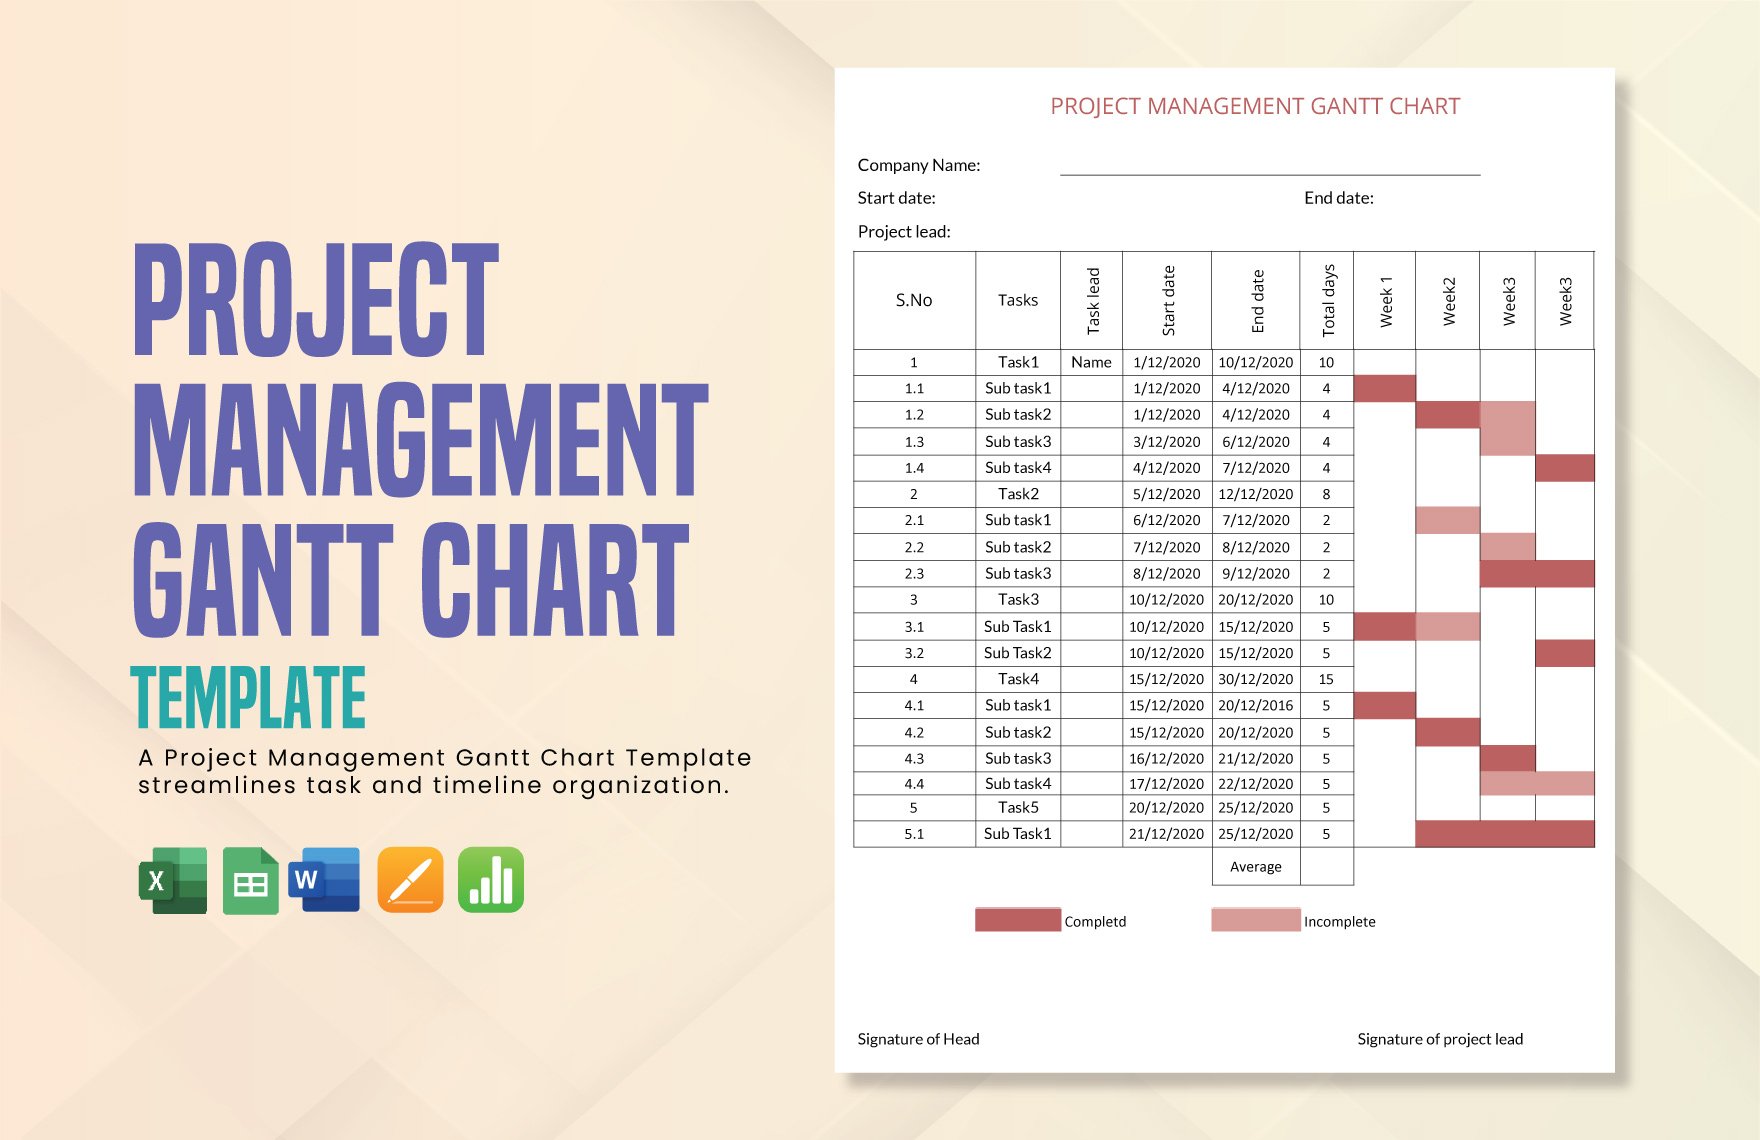
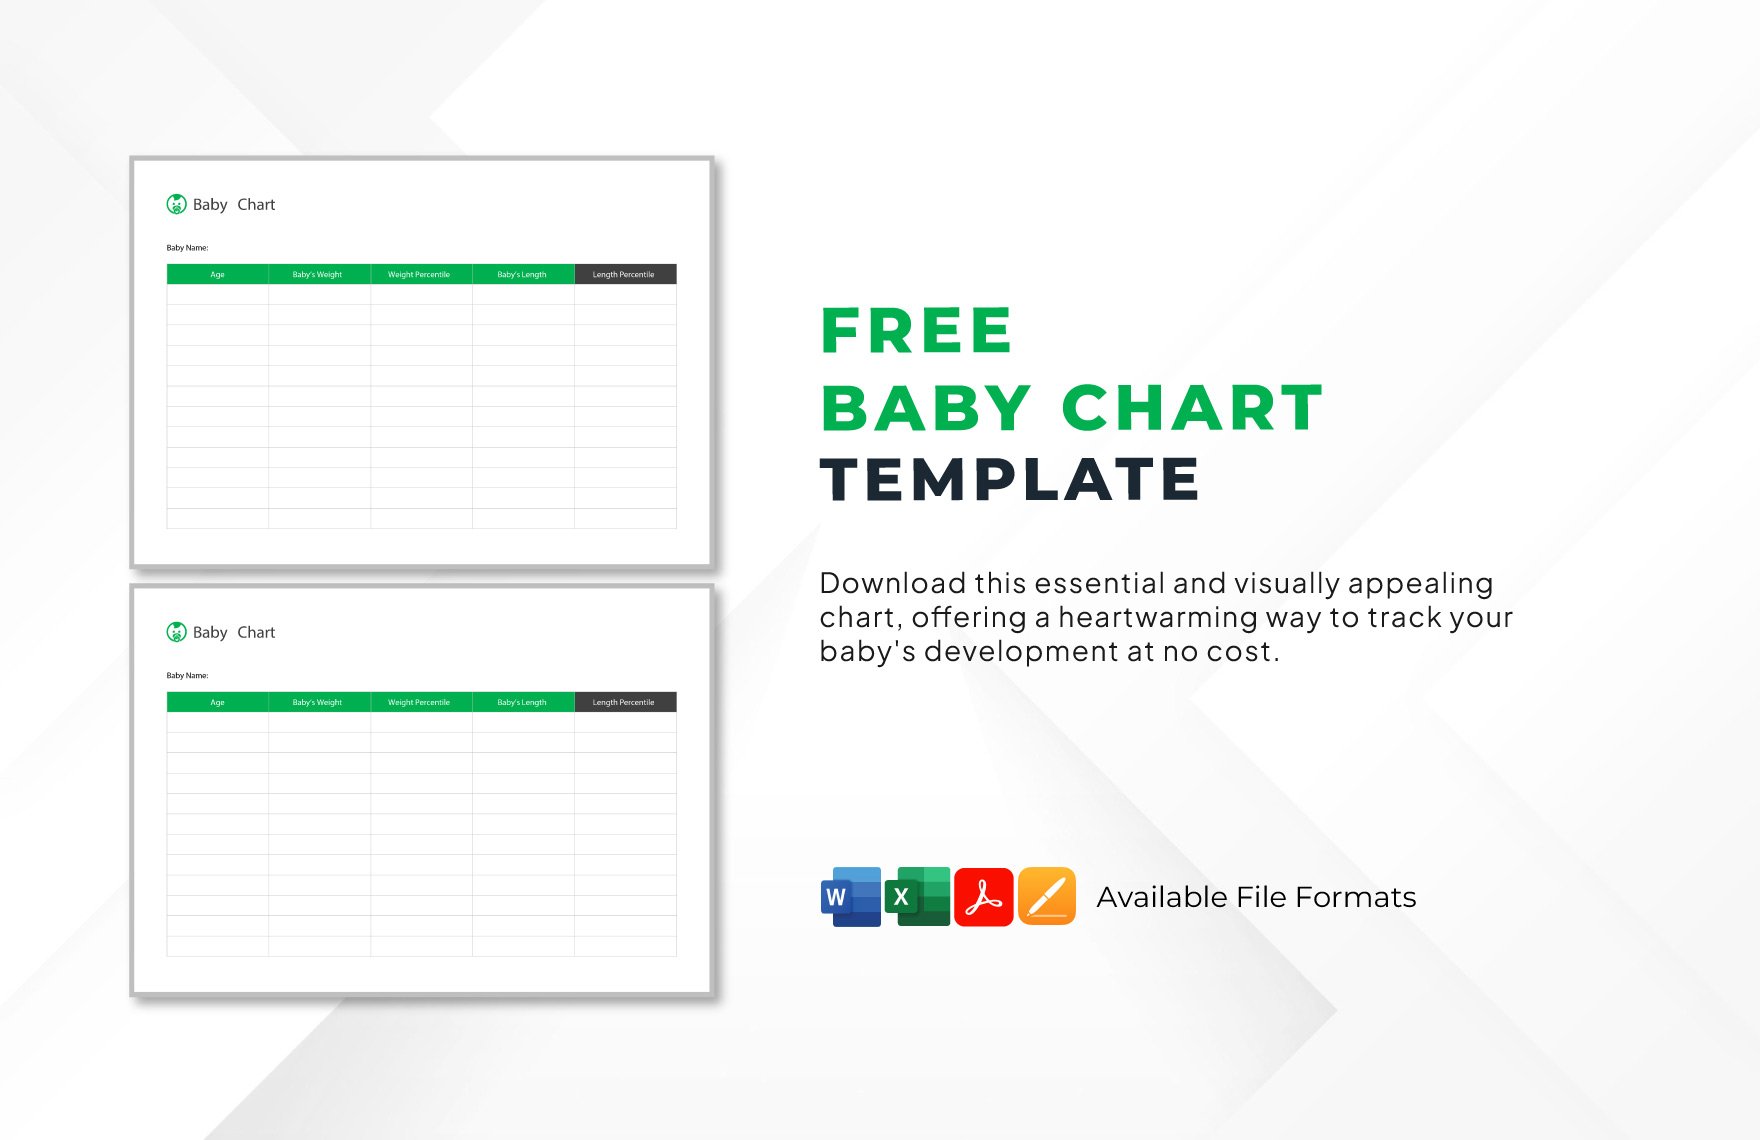
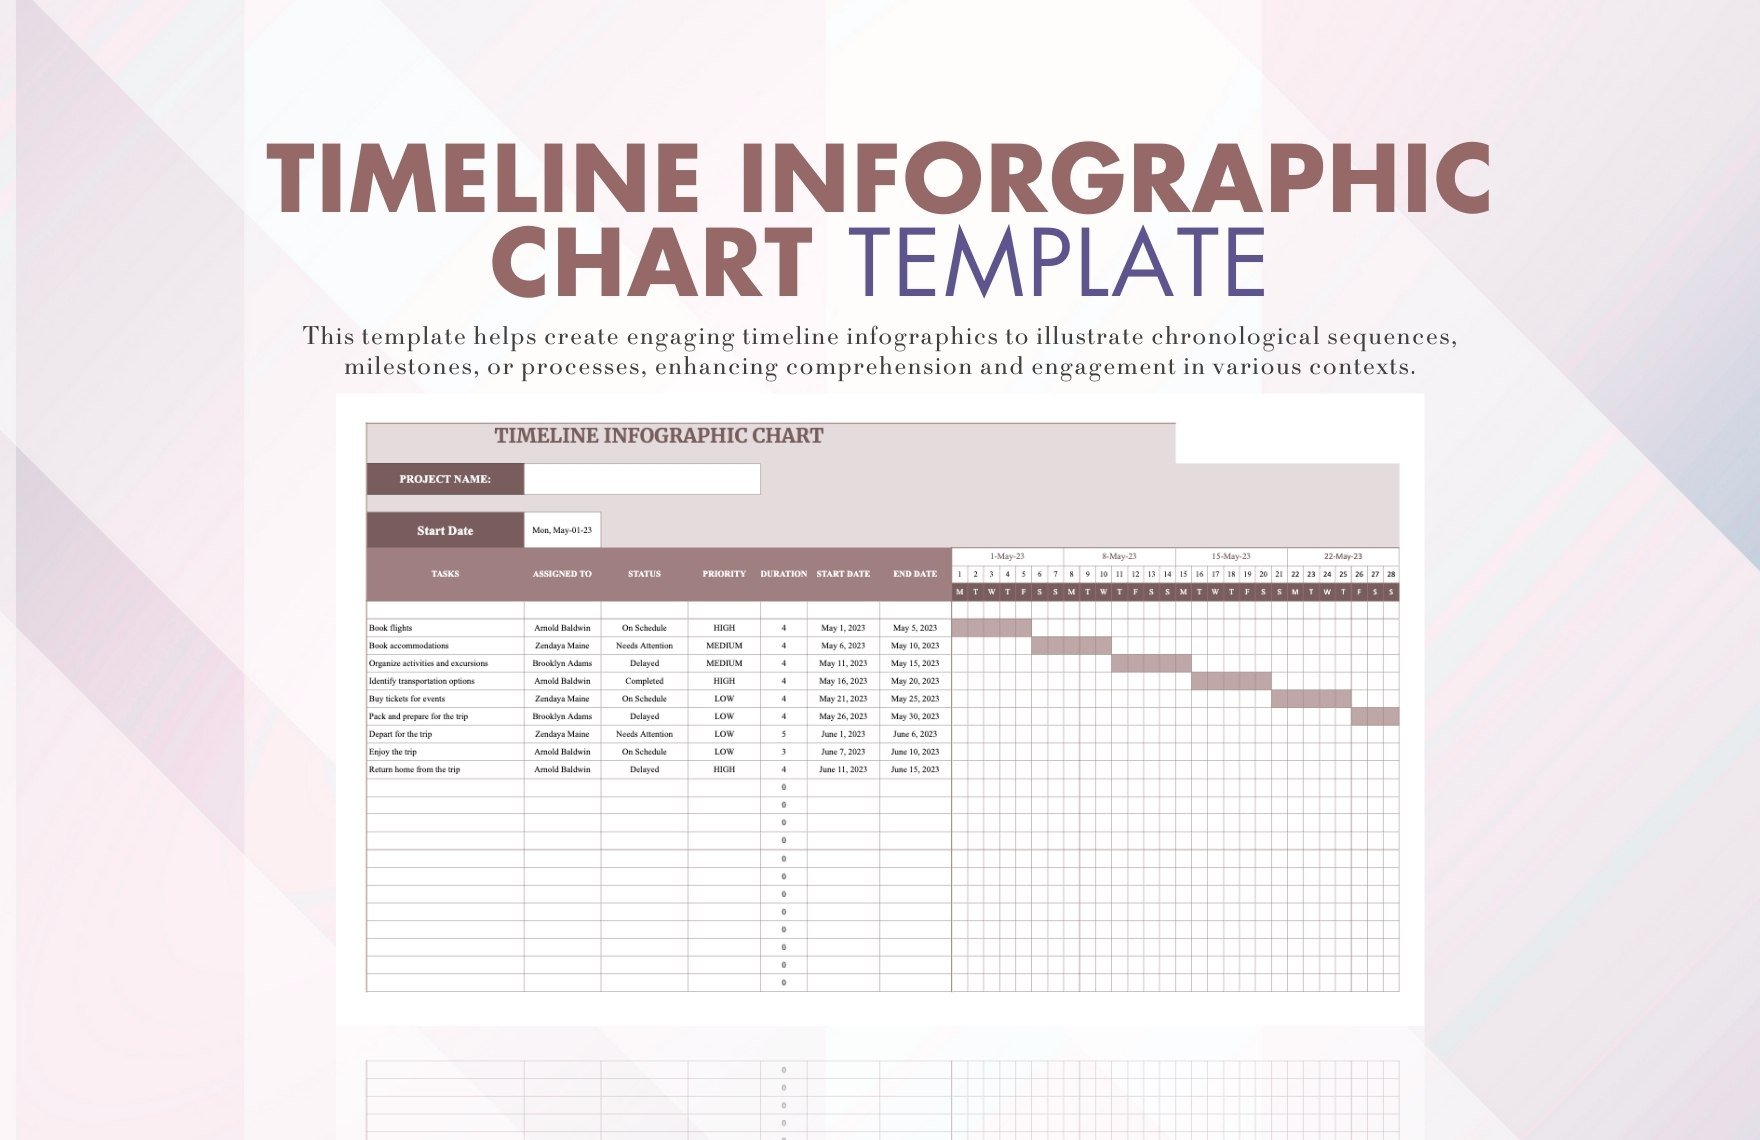
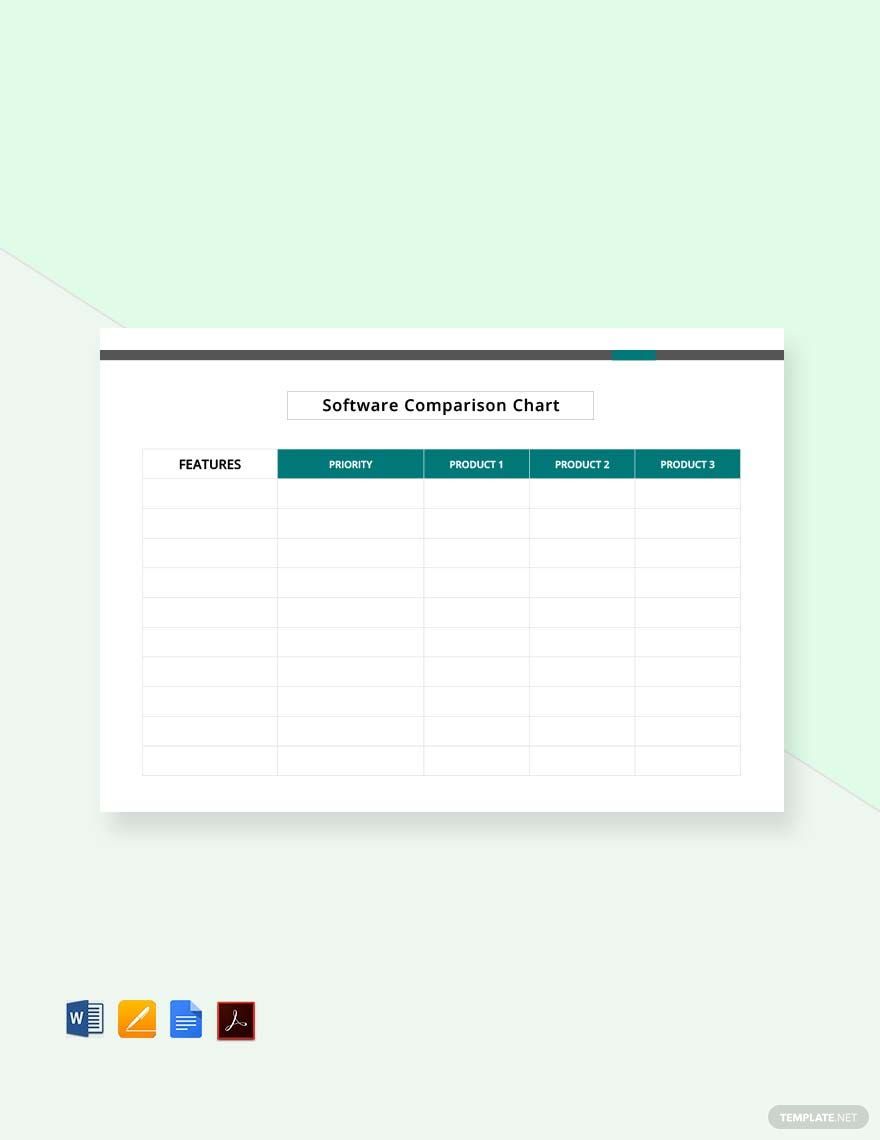
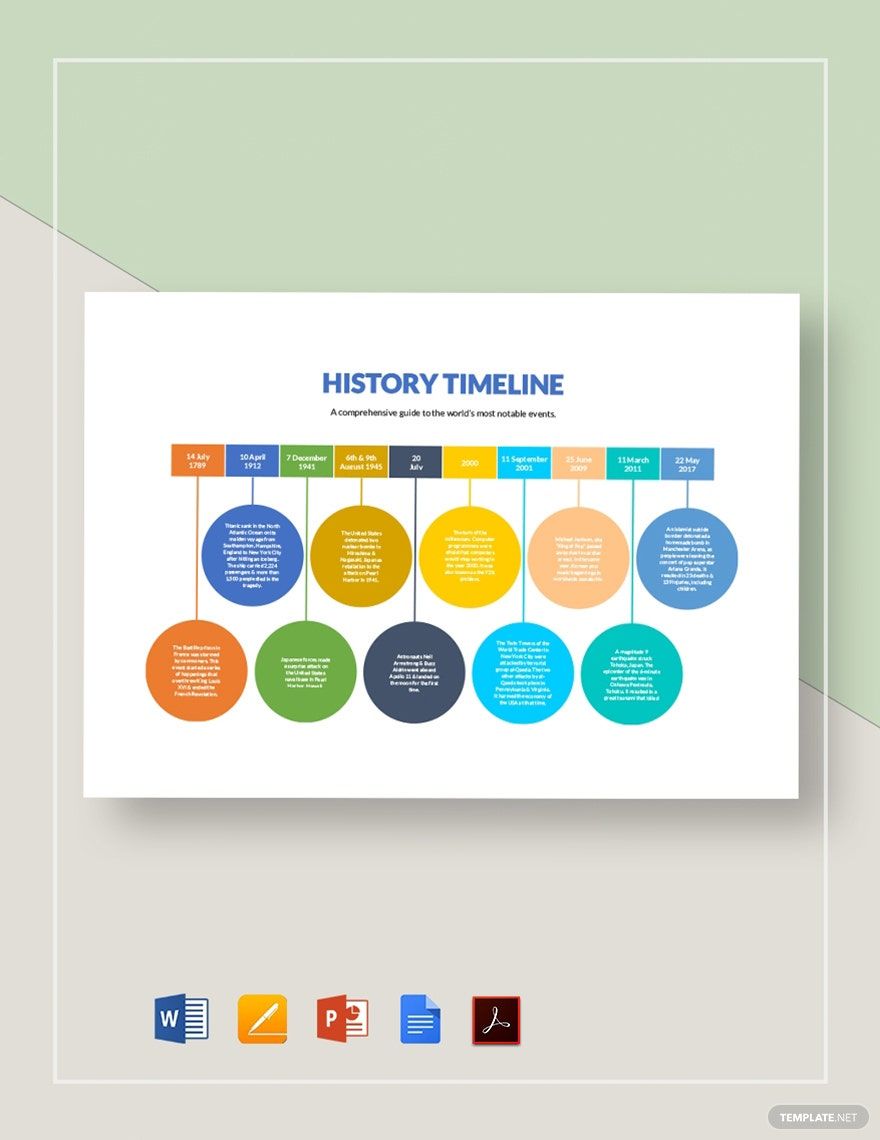
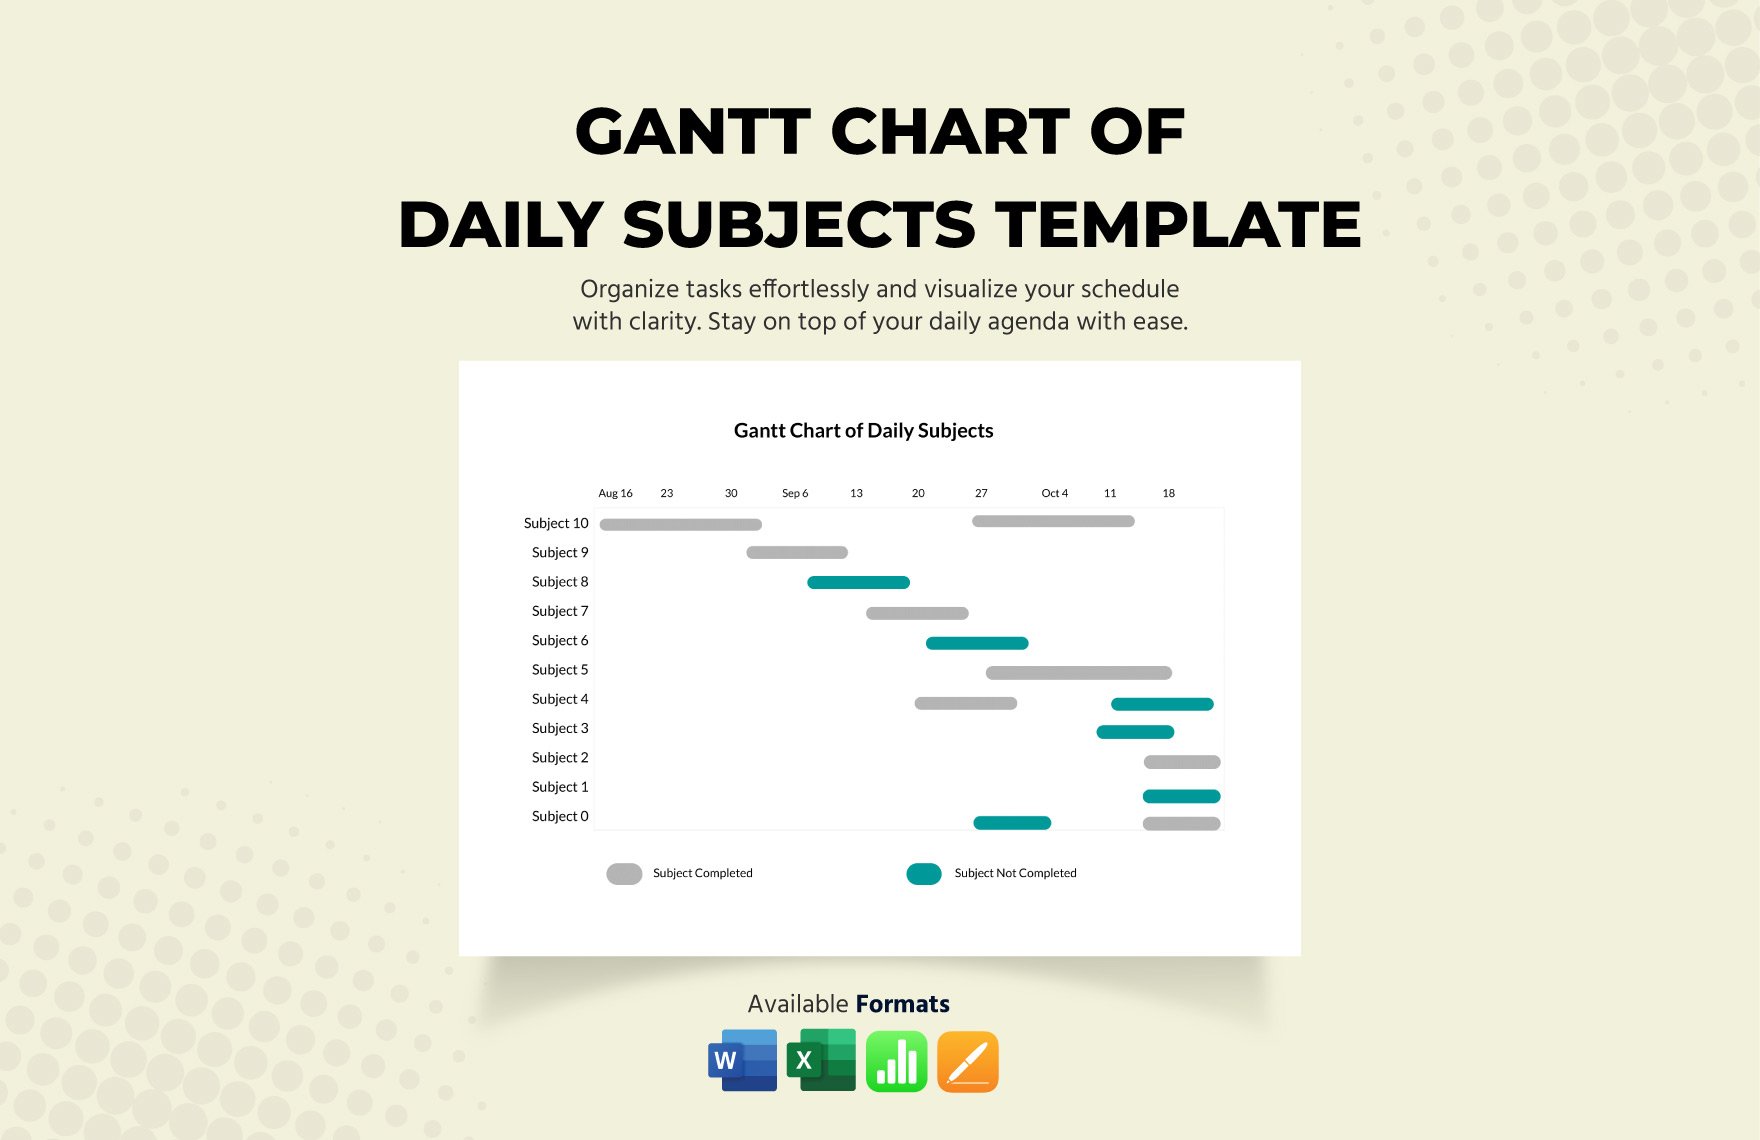
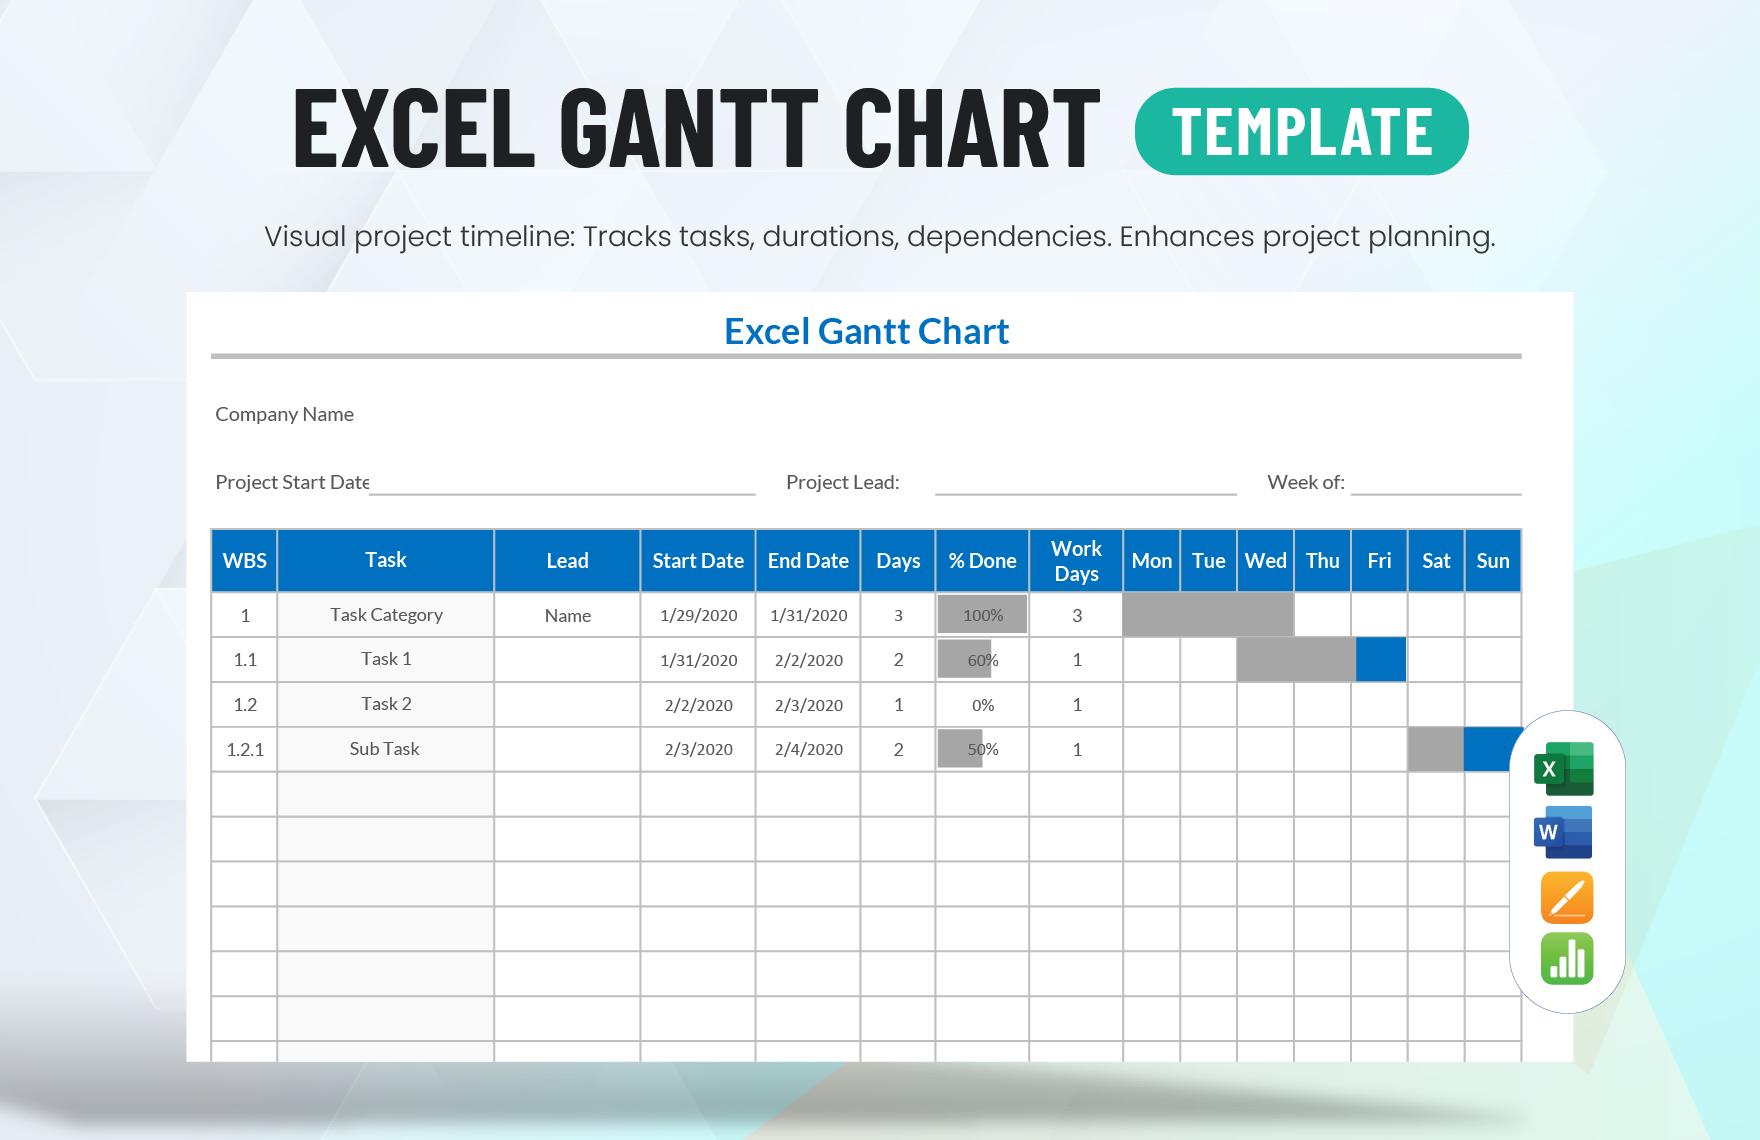
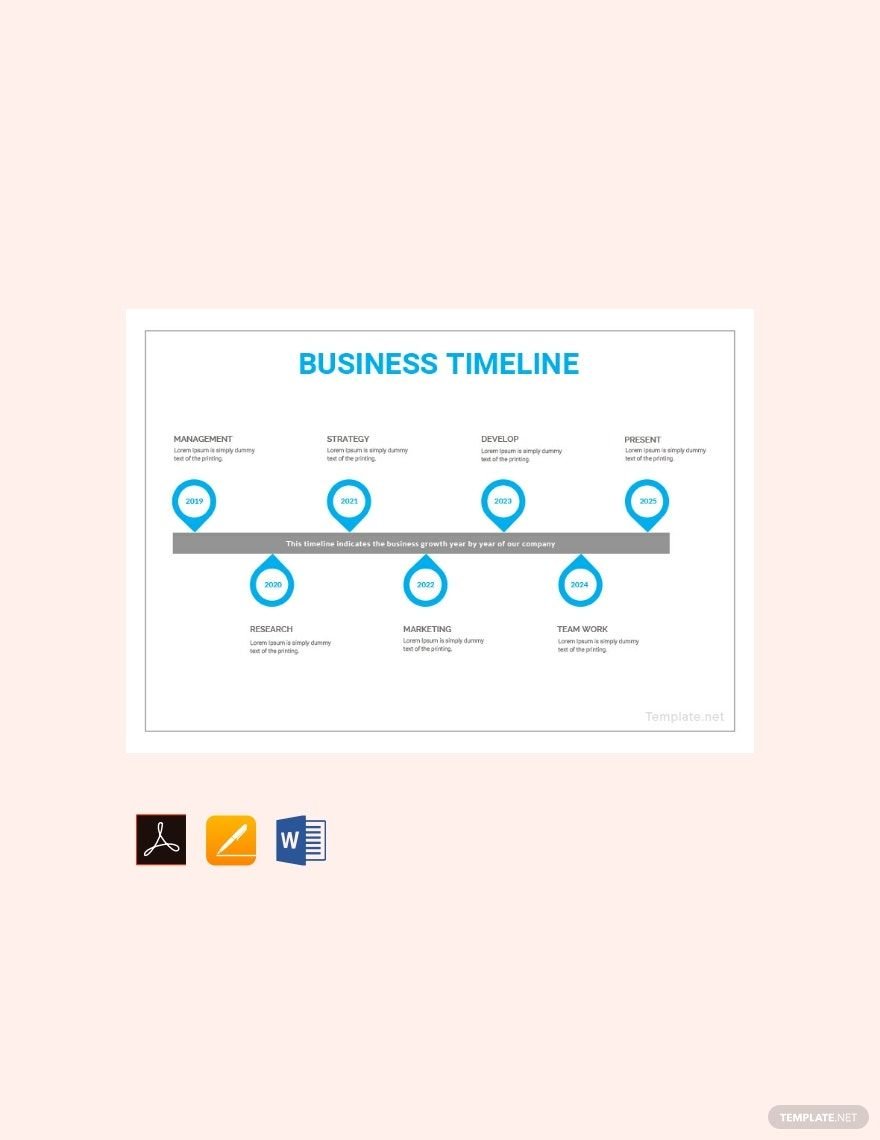
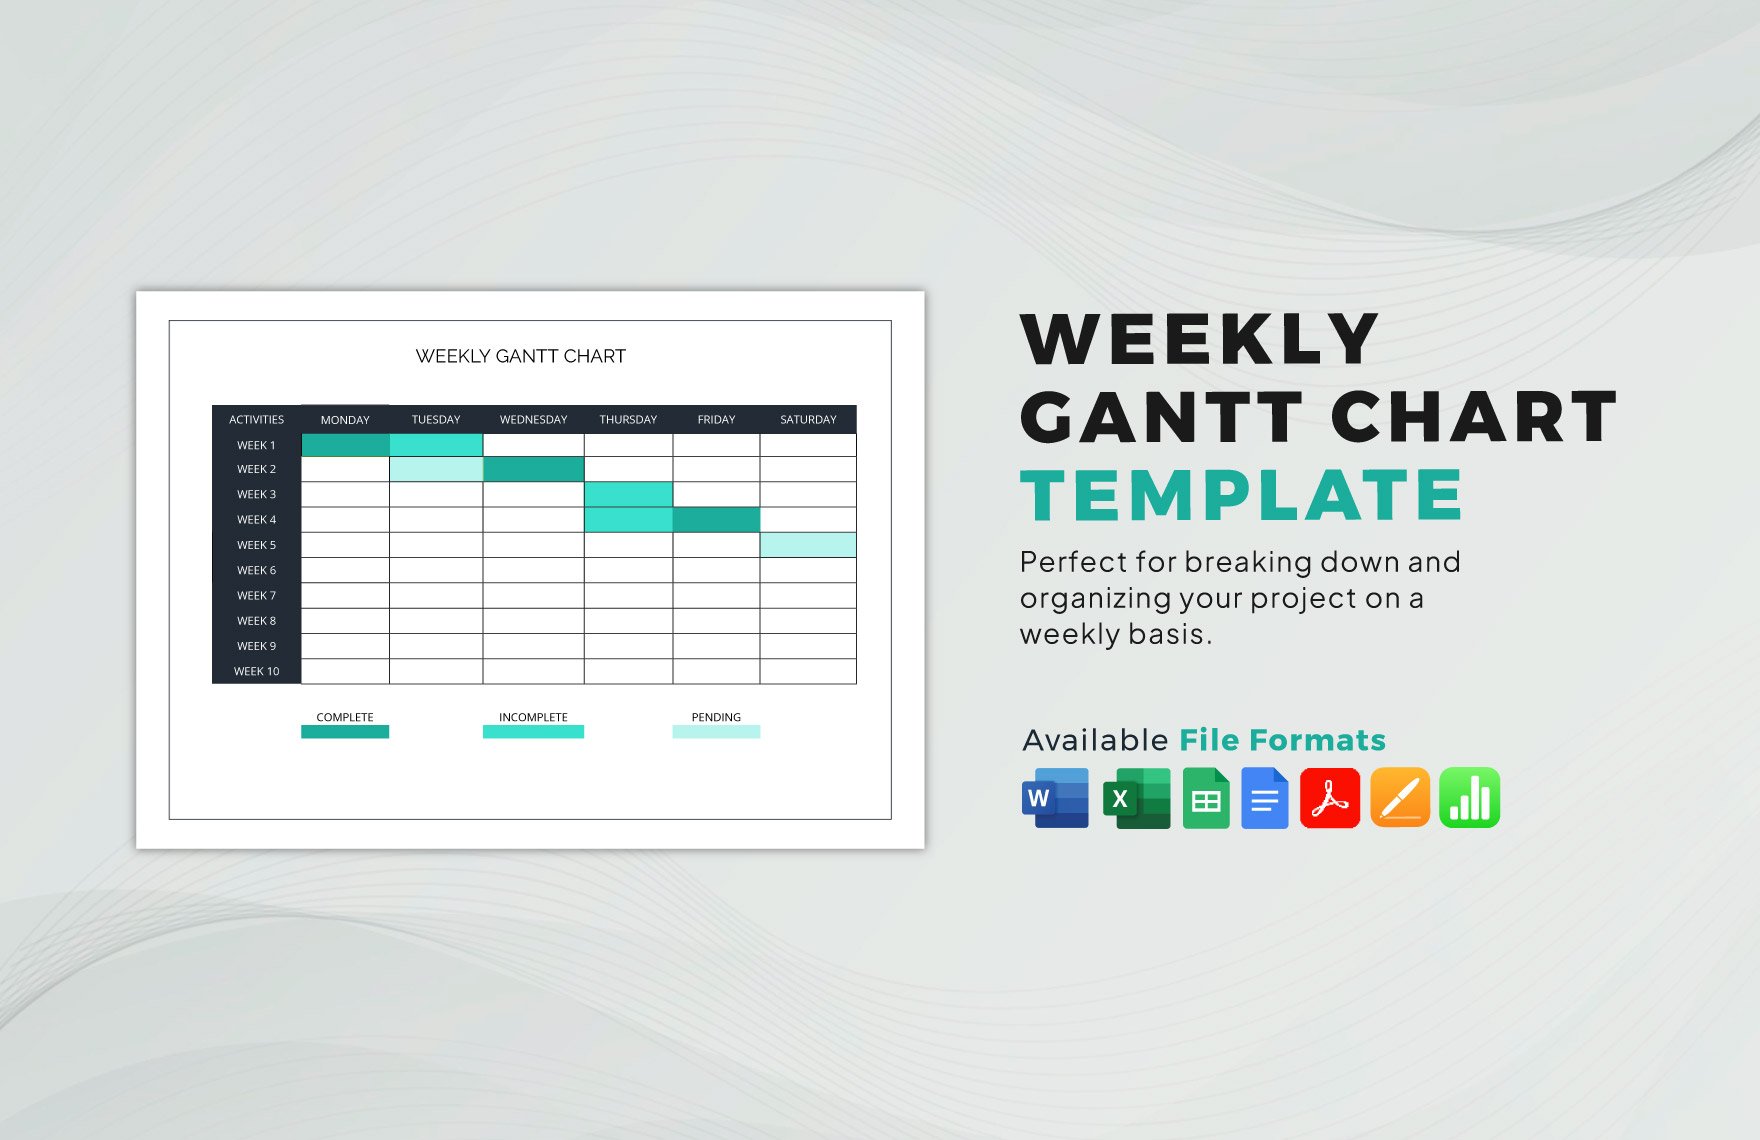
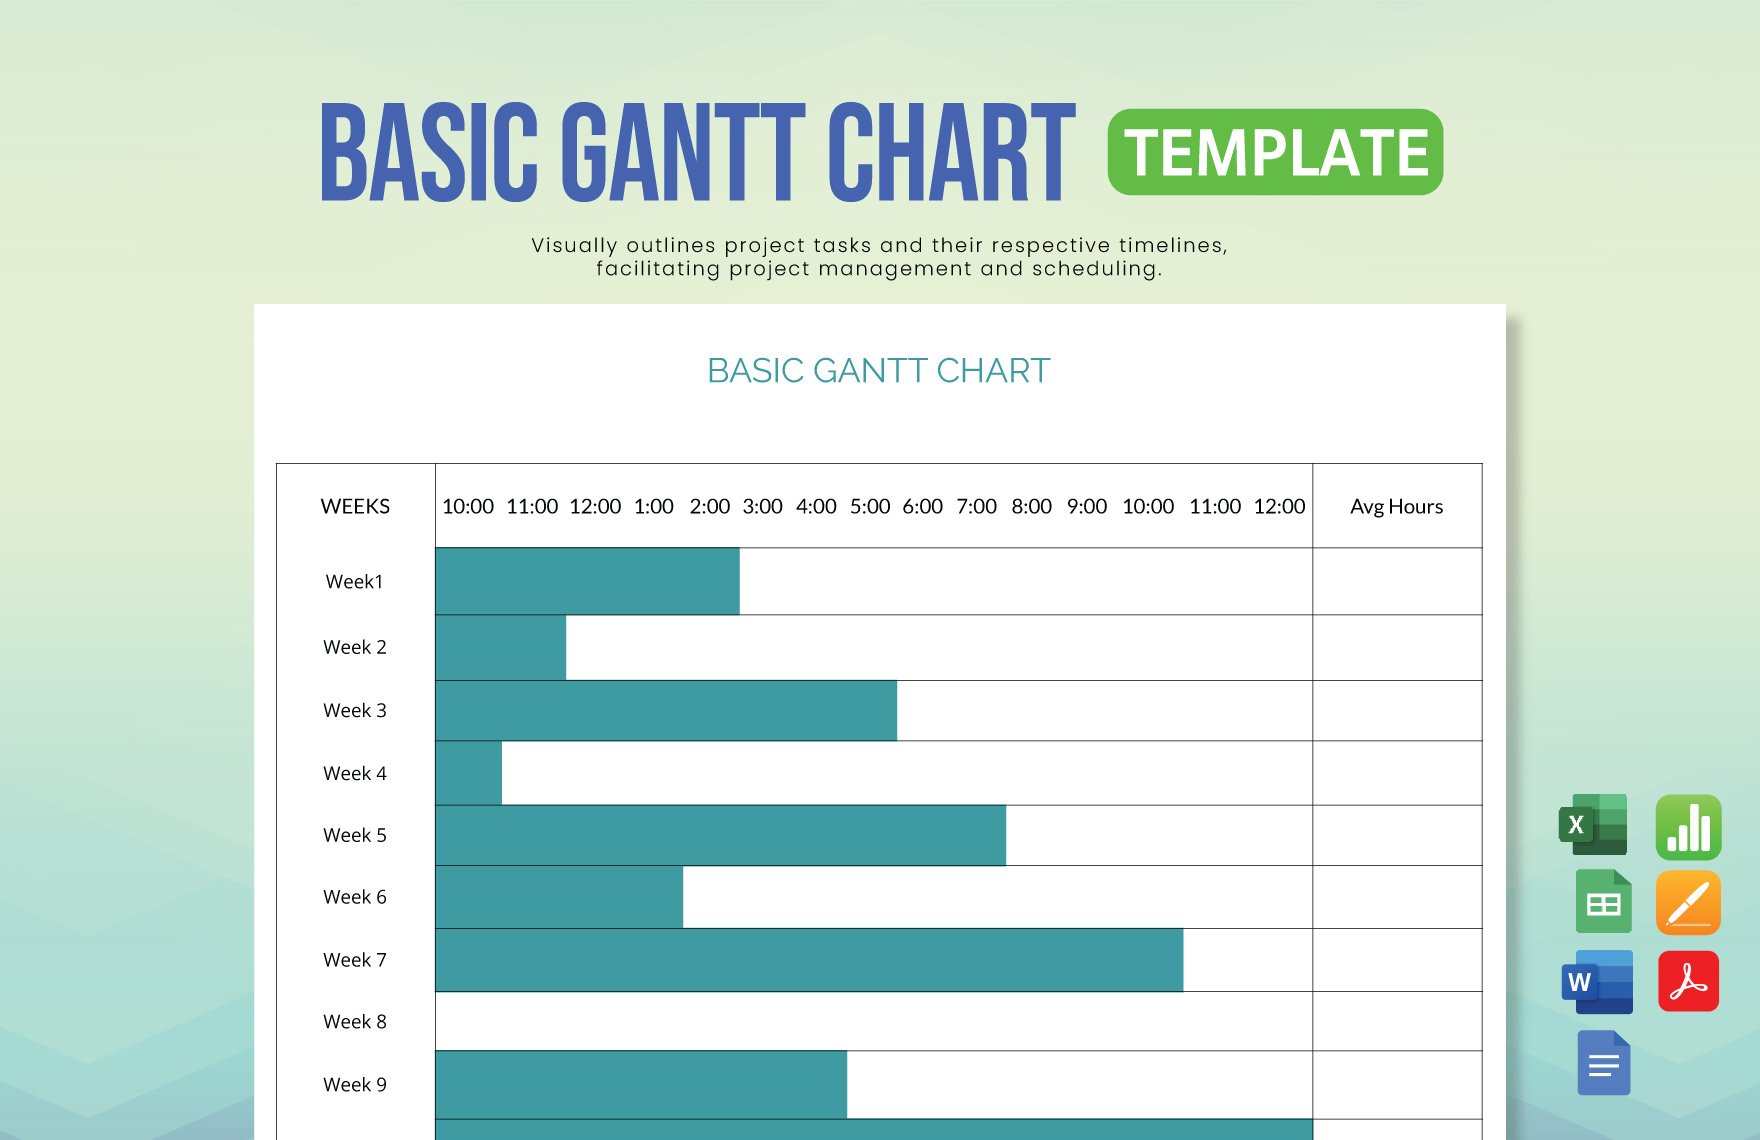
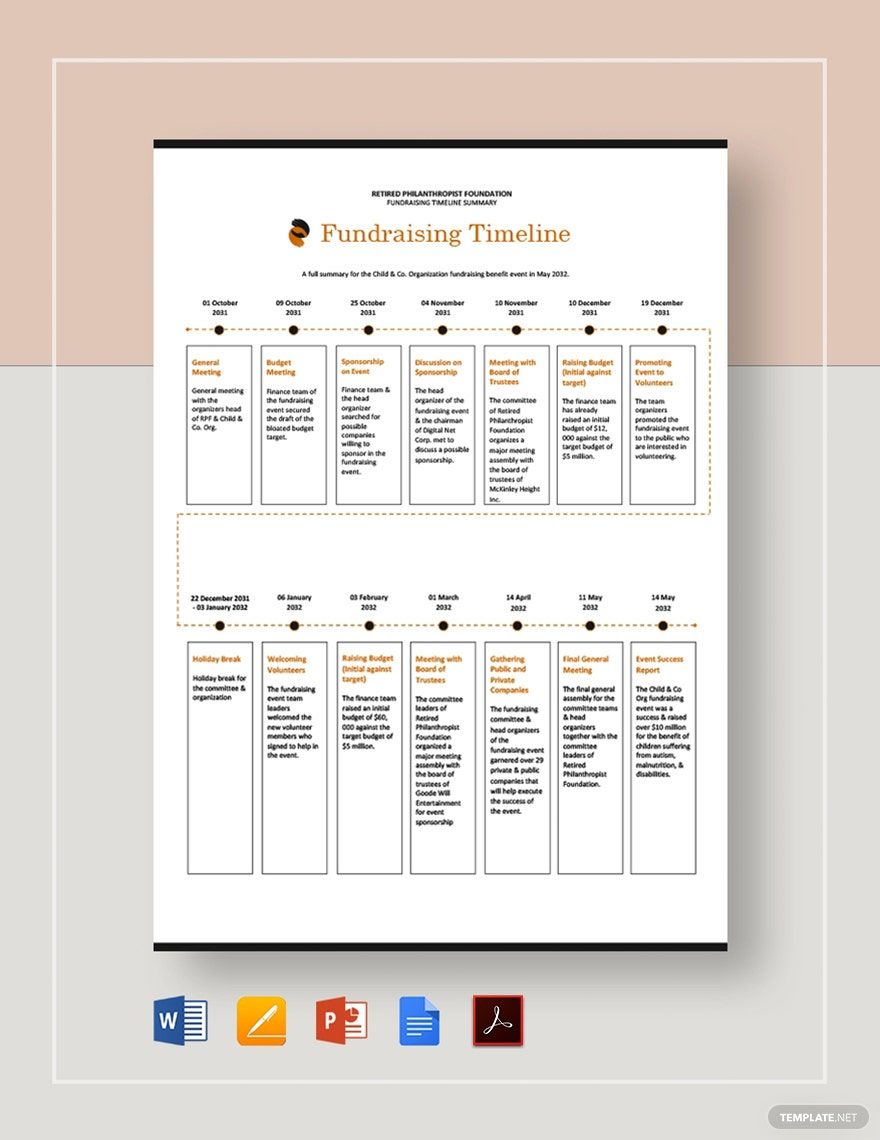
If you don't have enough time to create a chart from scratch, then you shouldn't worry. Here in Template.net, we have a wide variety of editable blank chart templates that might suit your needs. They're available in different file formats such as MS Word, MS Excel, MS Publisher, Google Docs, Numbers, and MS Powerpoint. We have pie charts, Gantt charts, bar charts, and timeline charts. With their help, the only process you have to do is inject the necessary stats and data.


