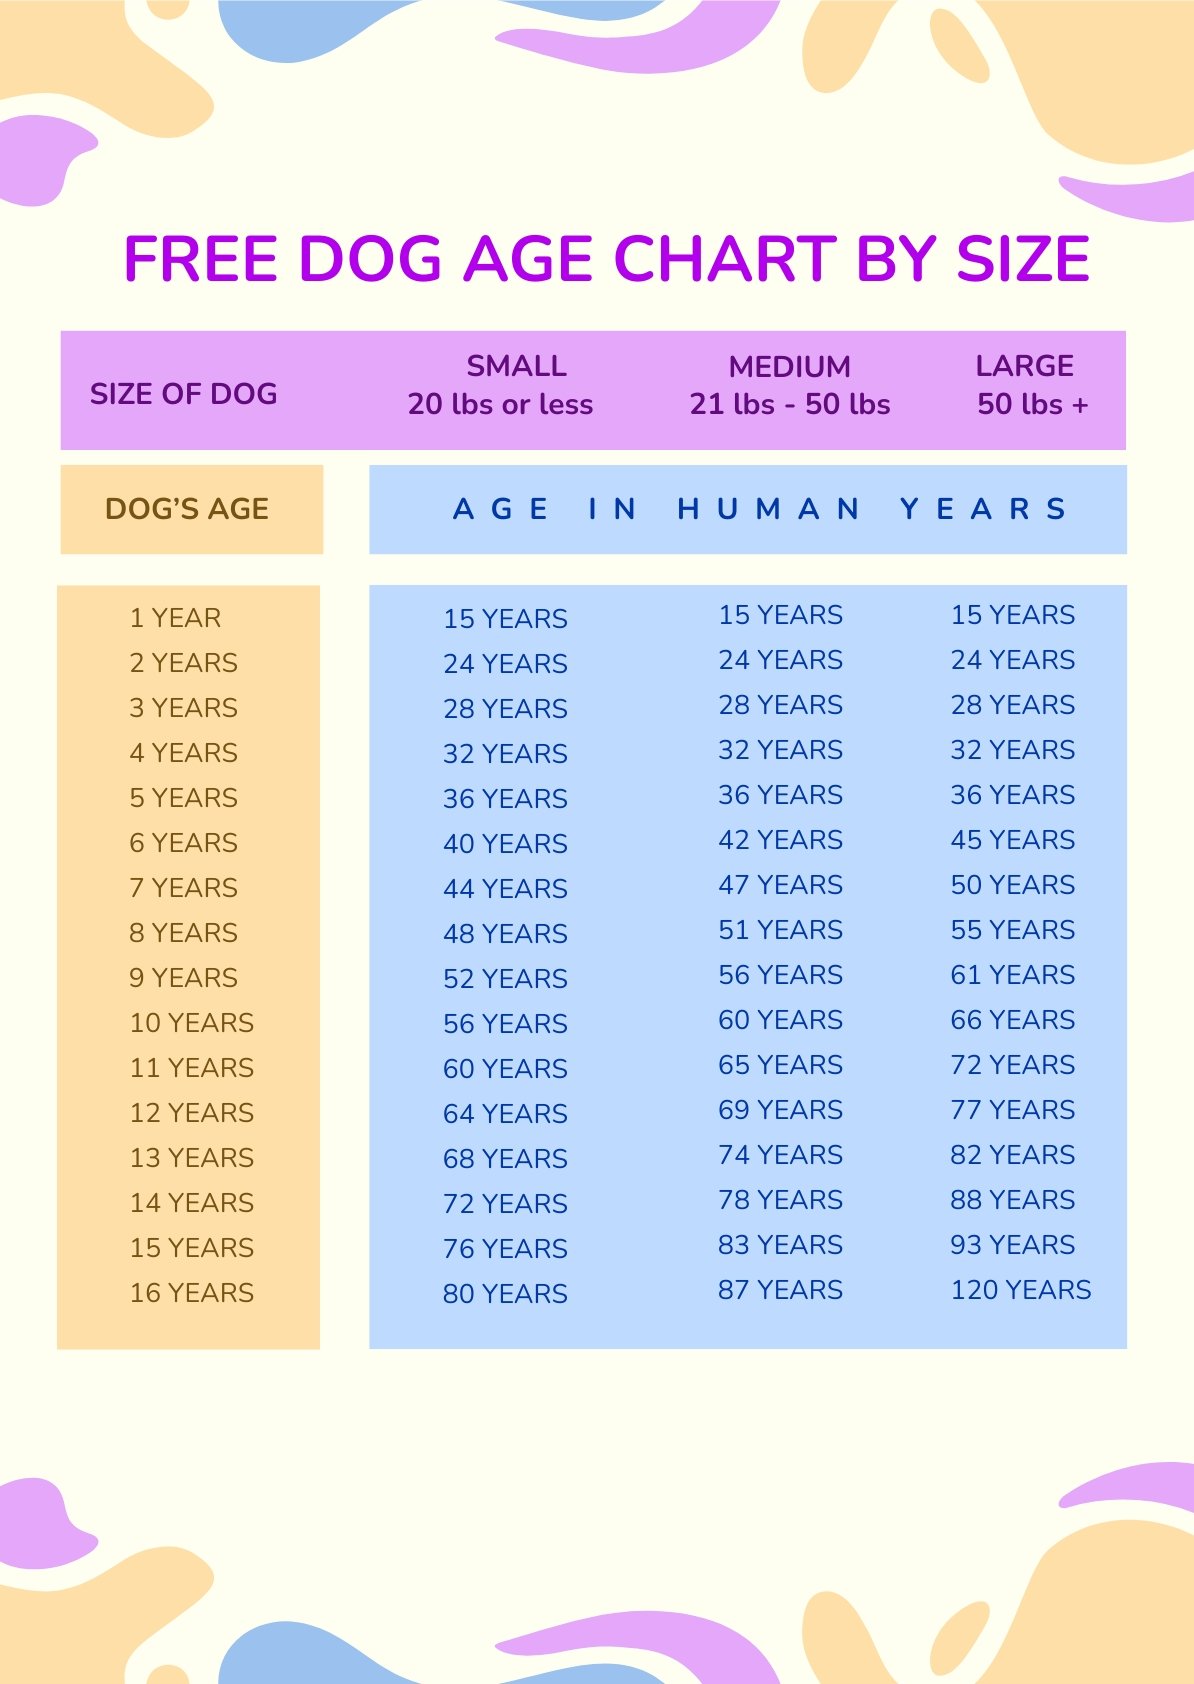
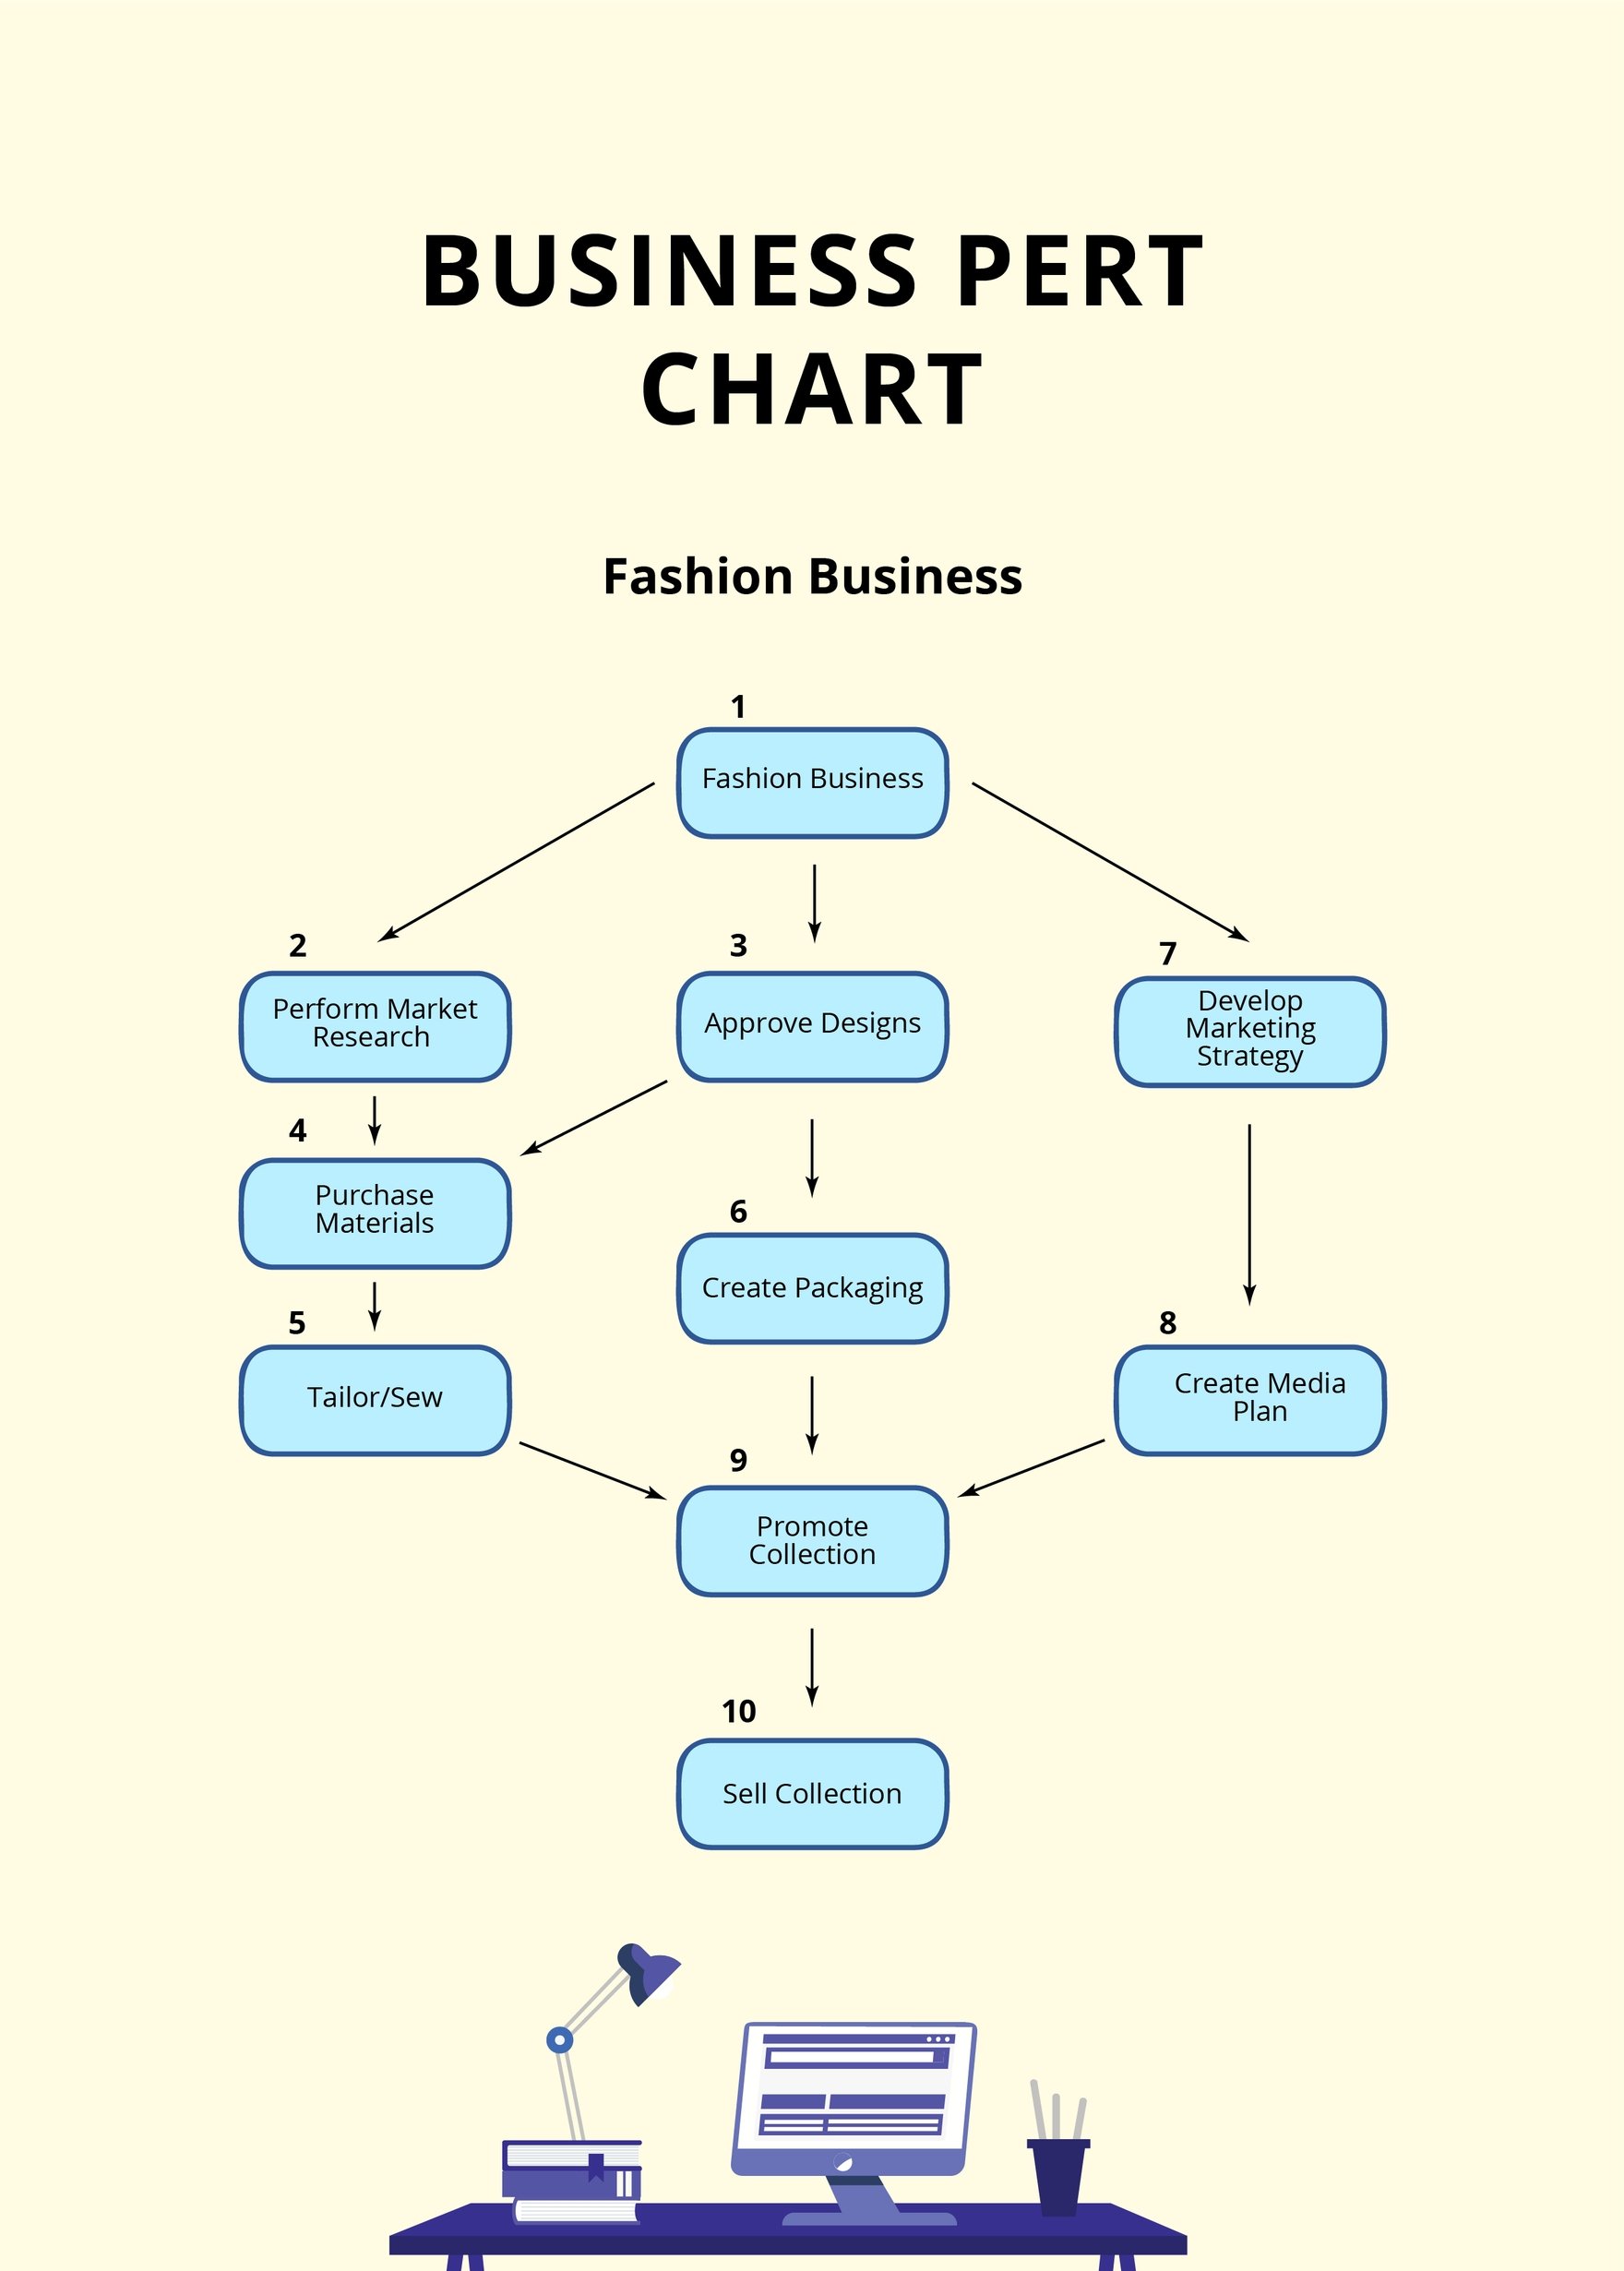
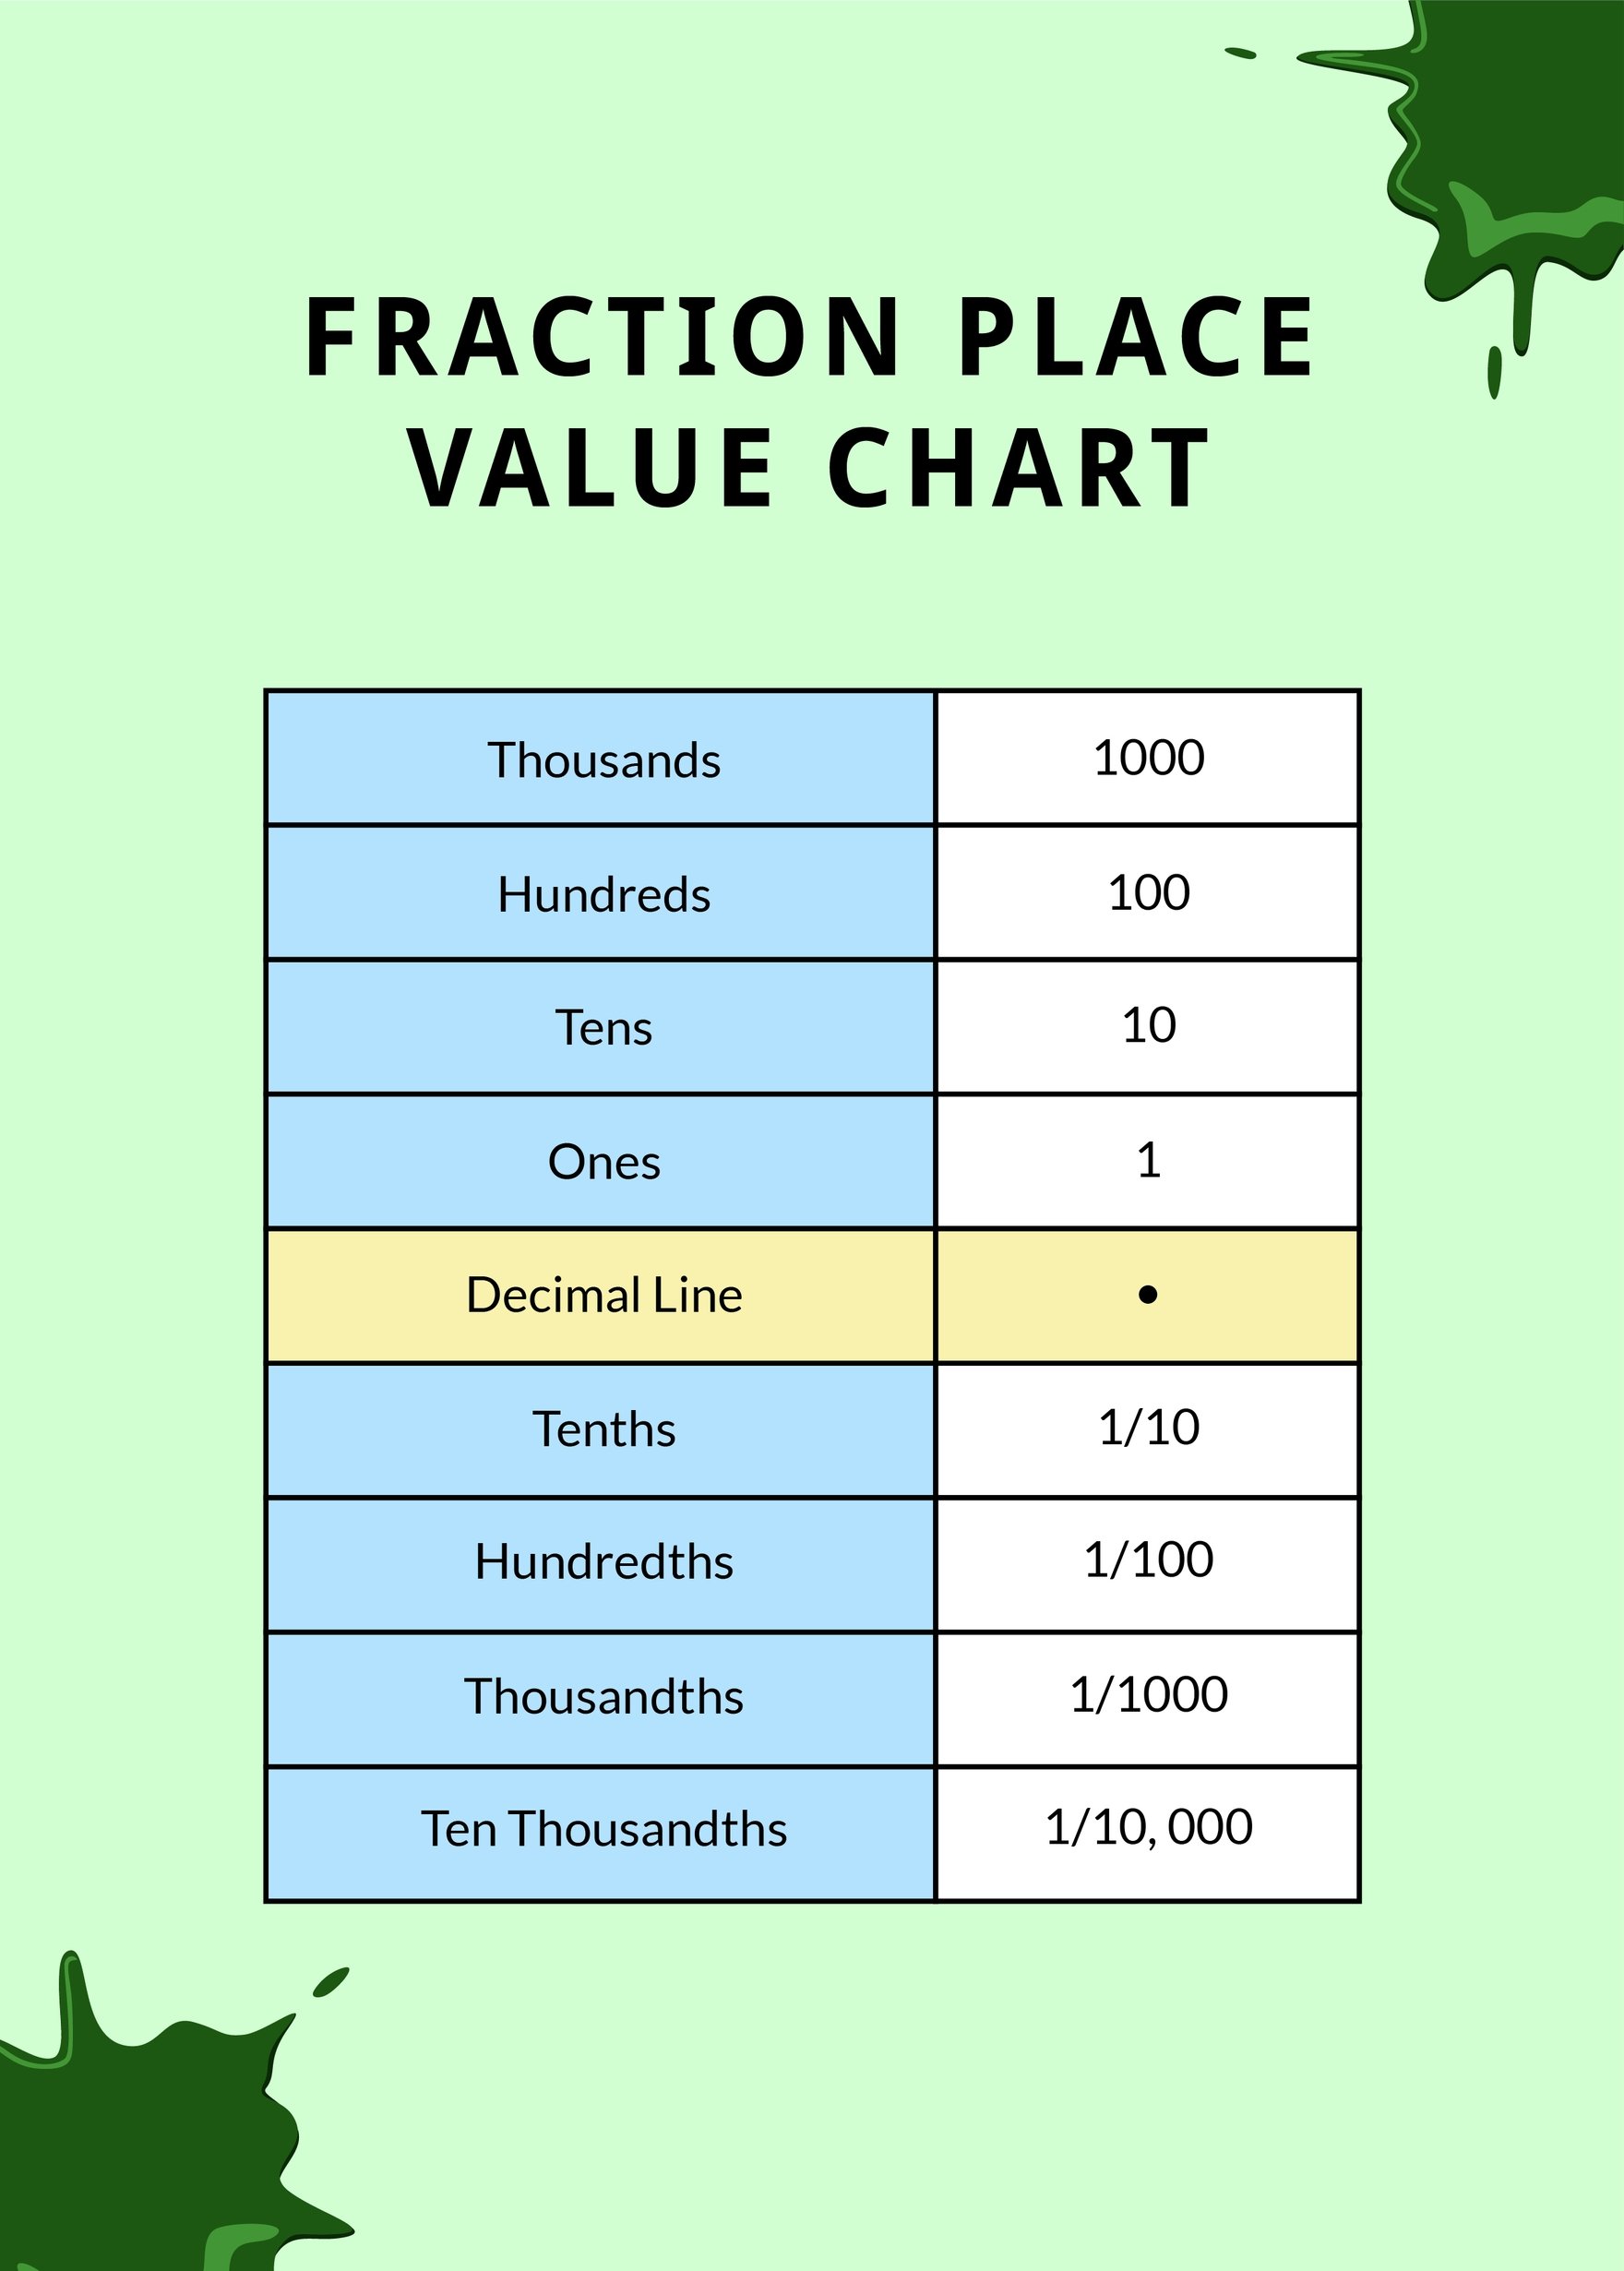
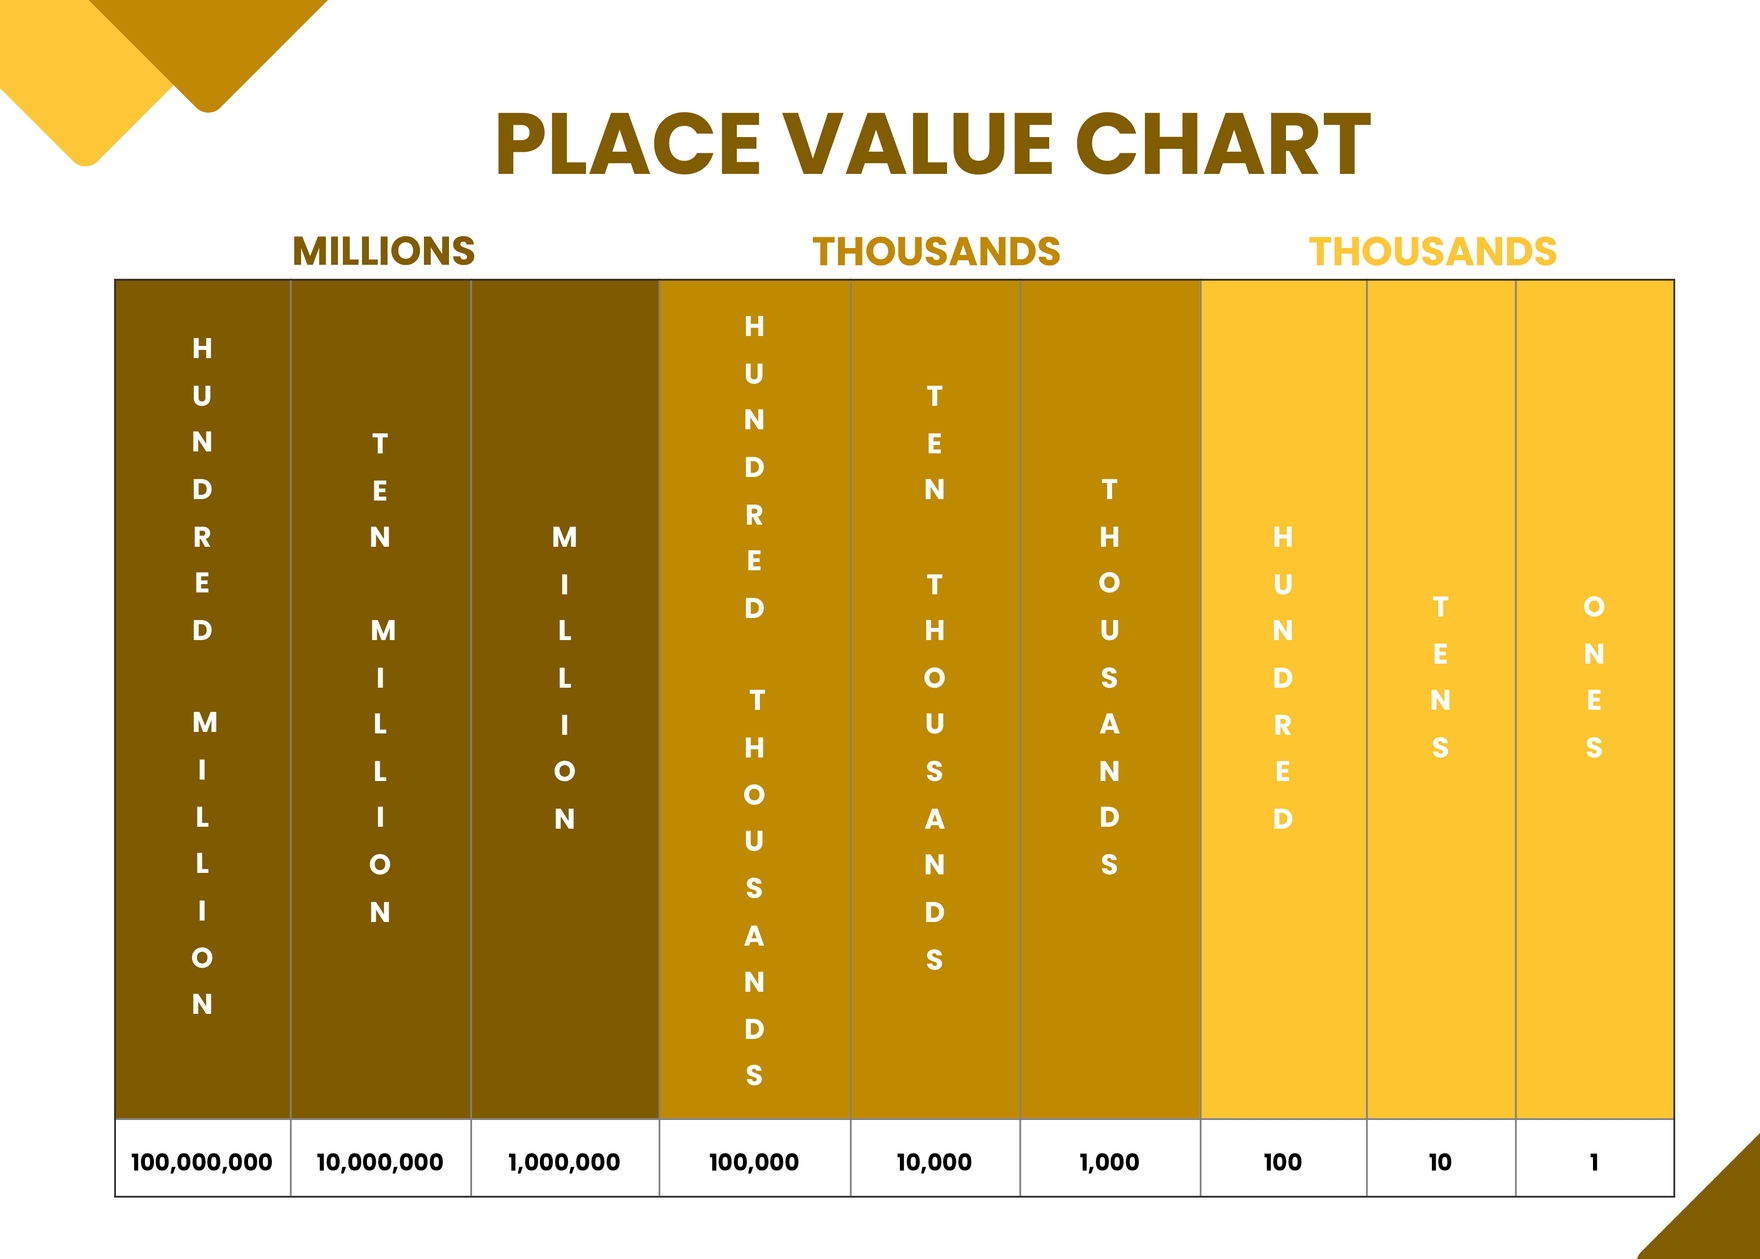
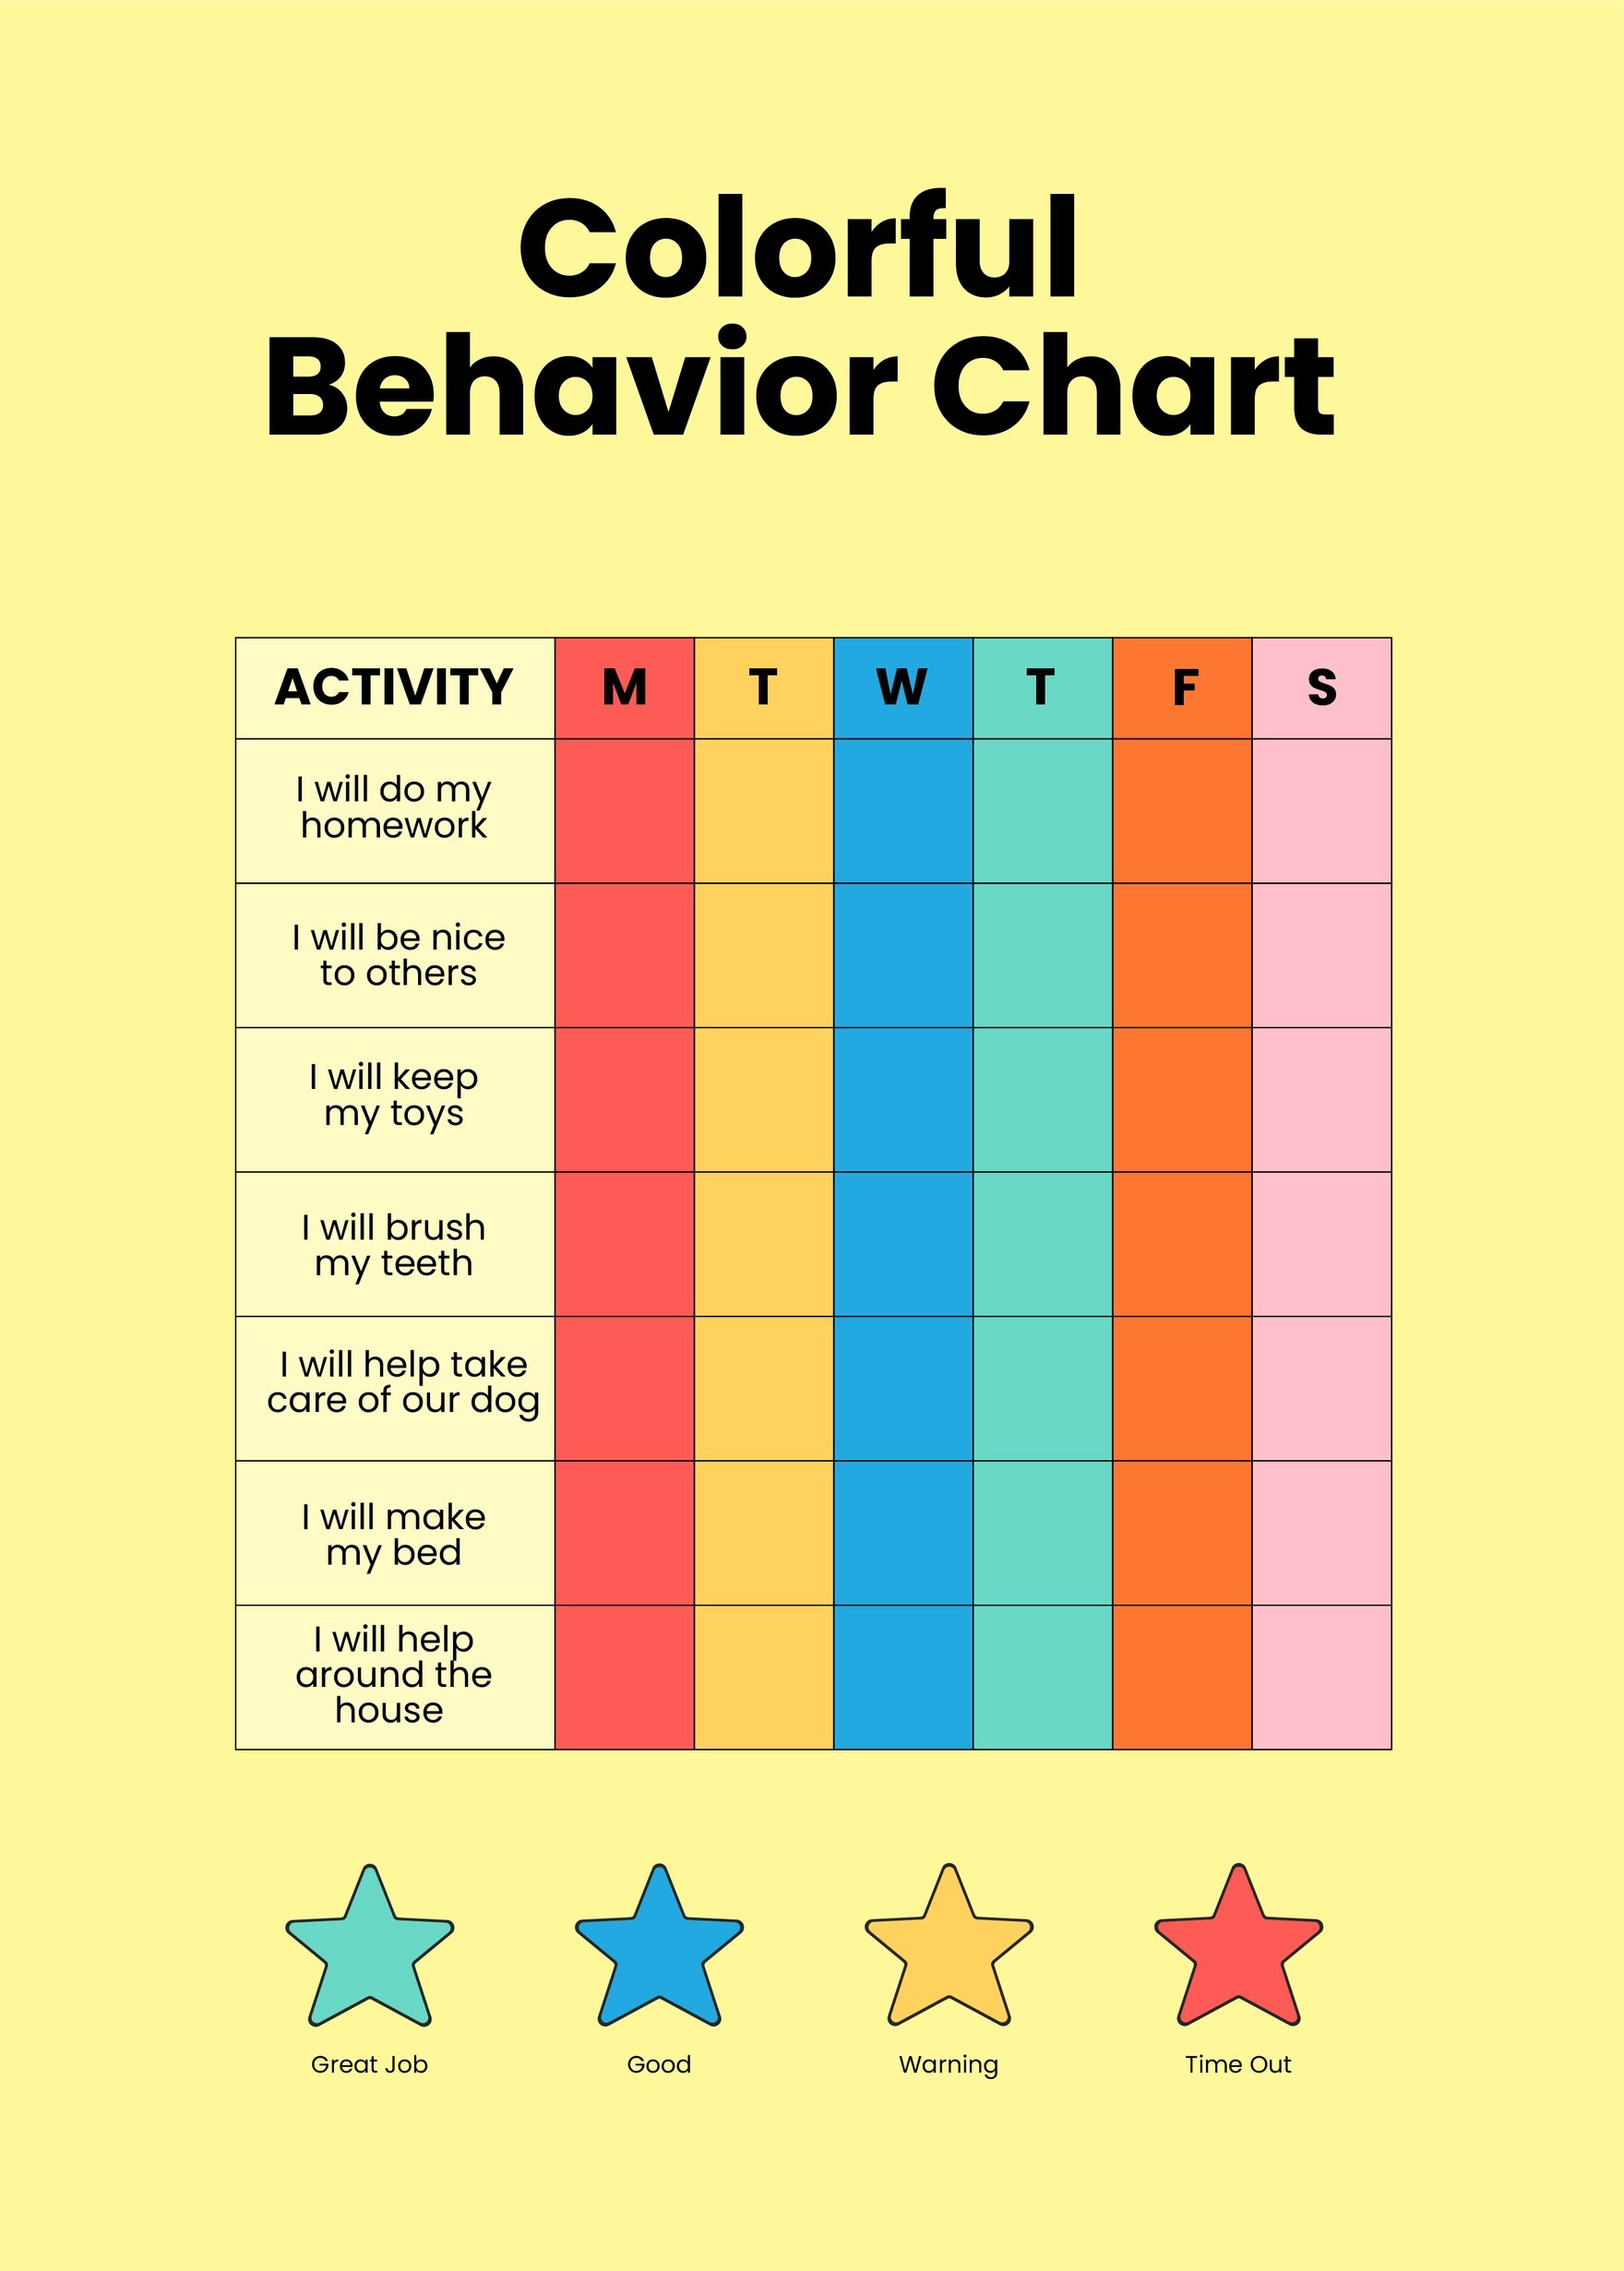
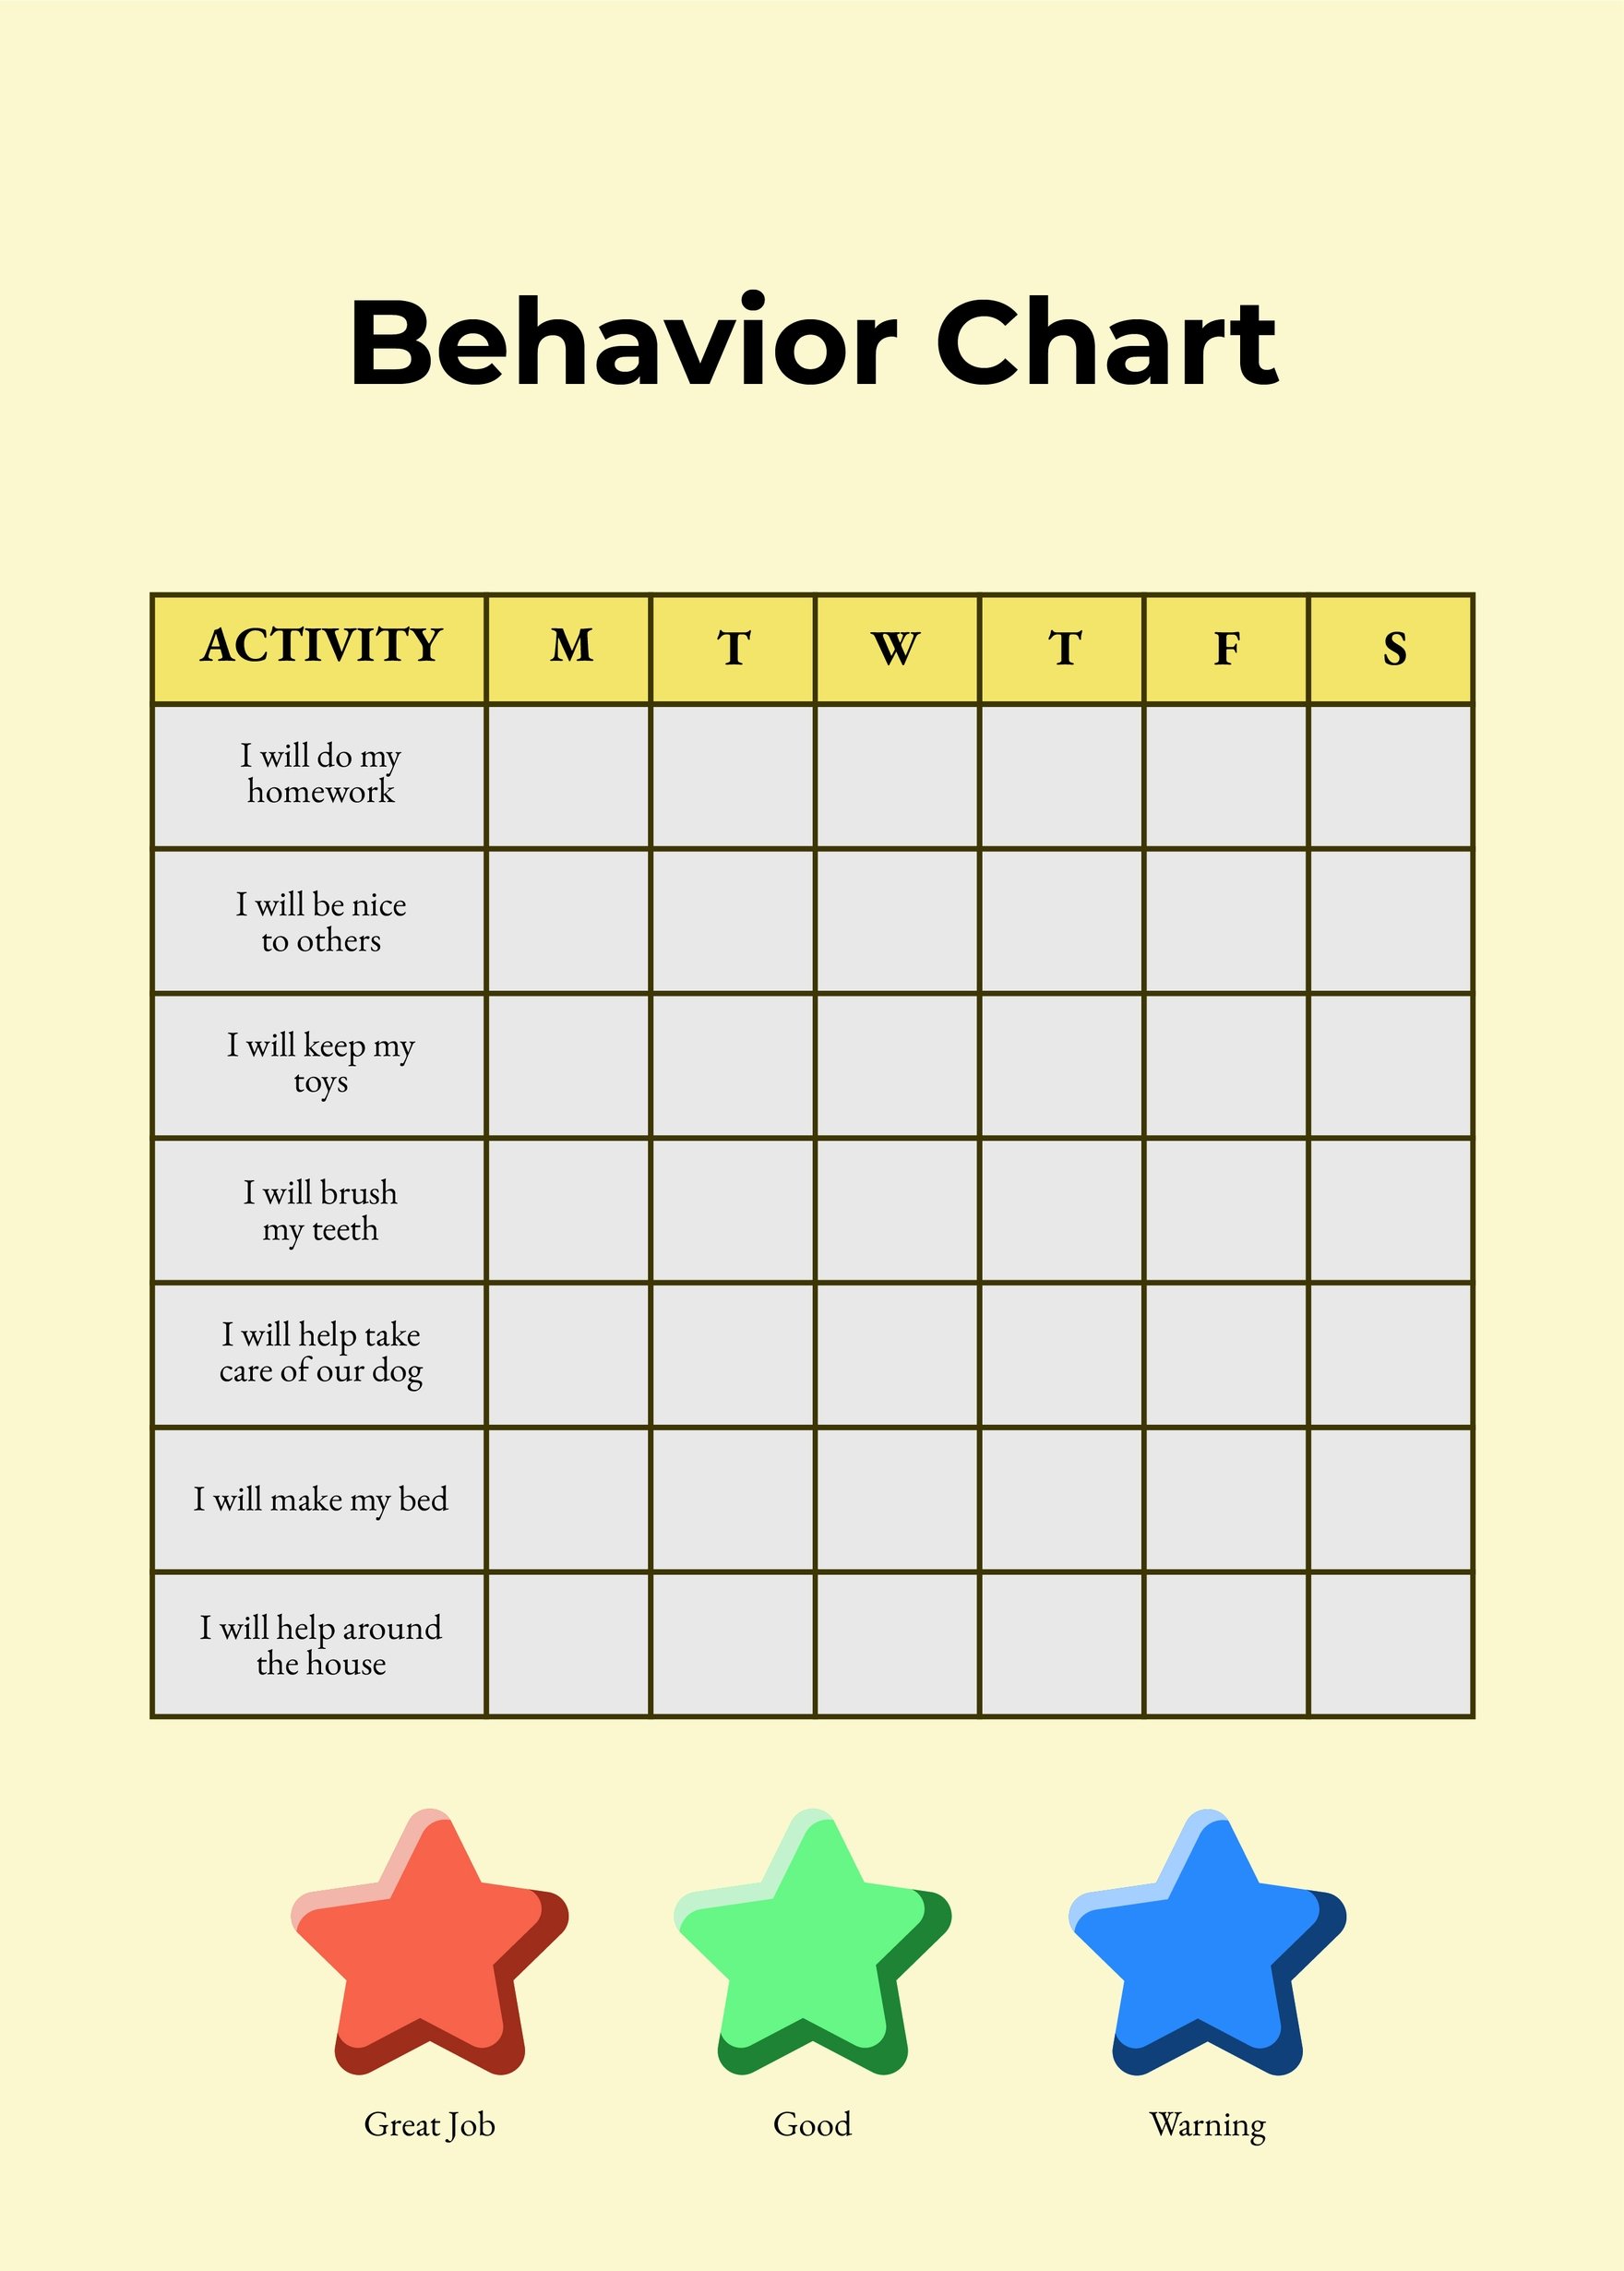
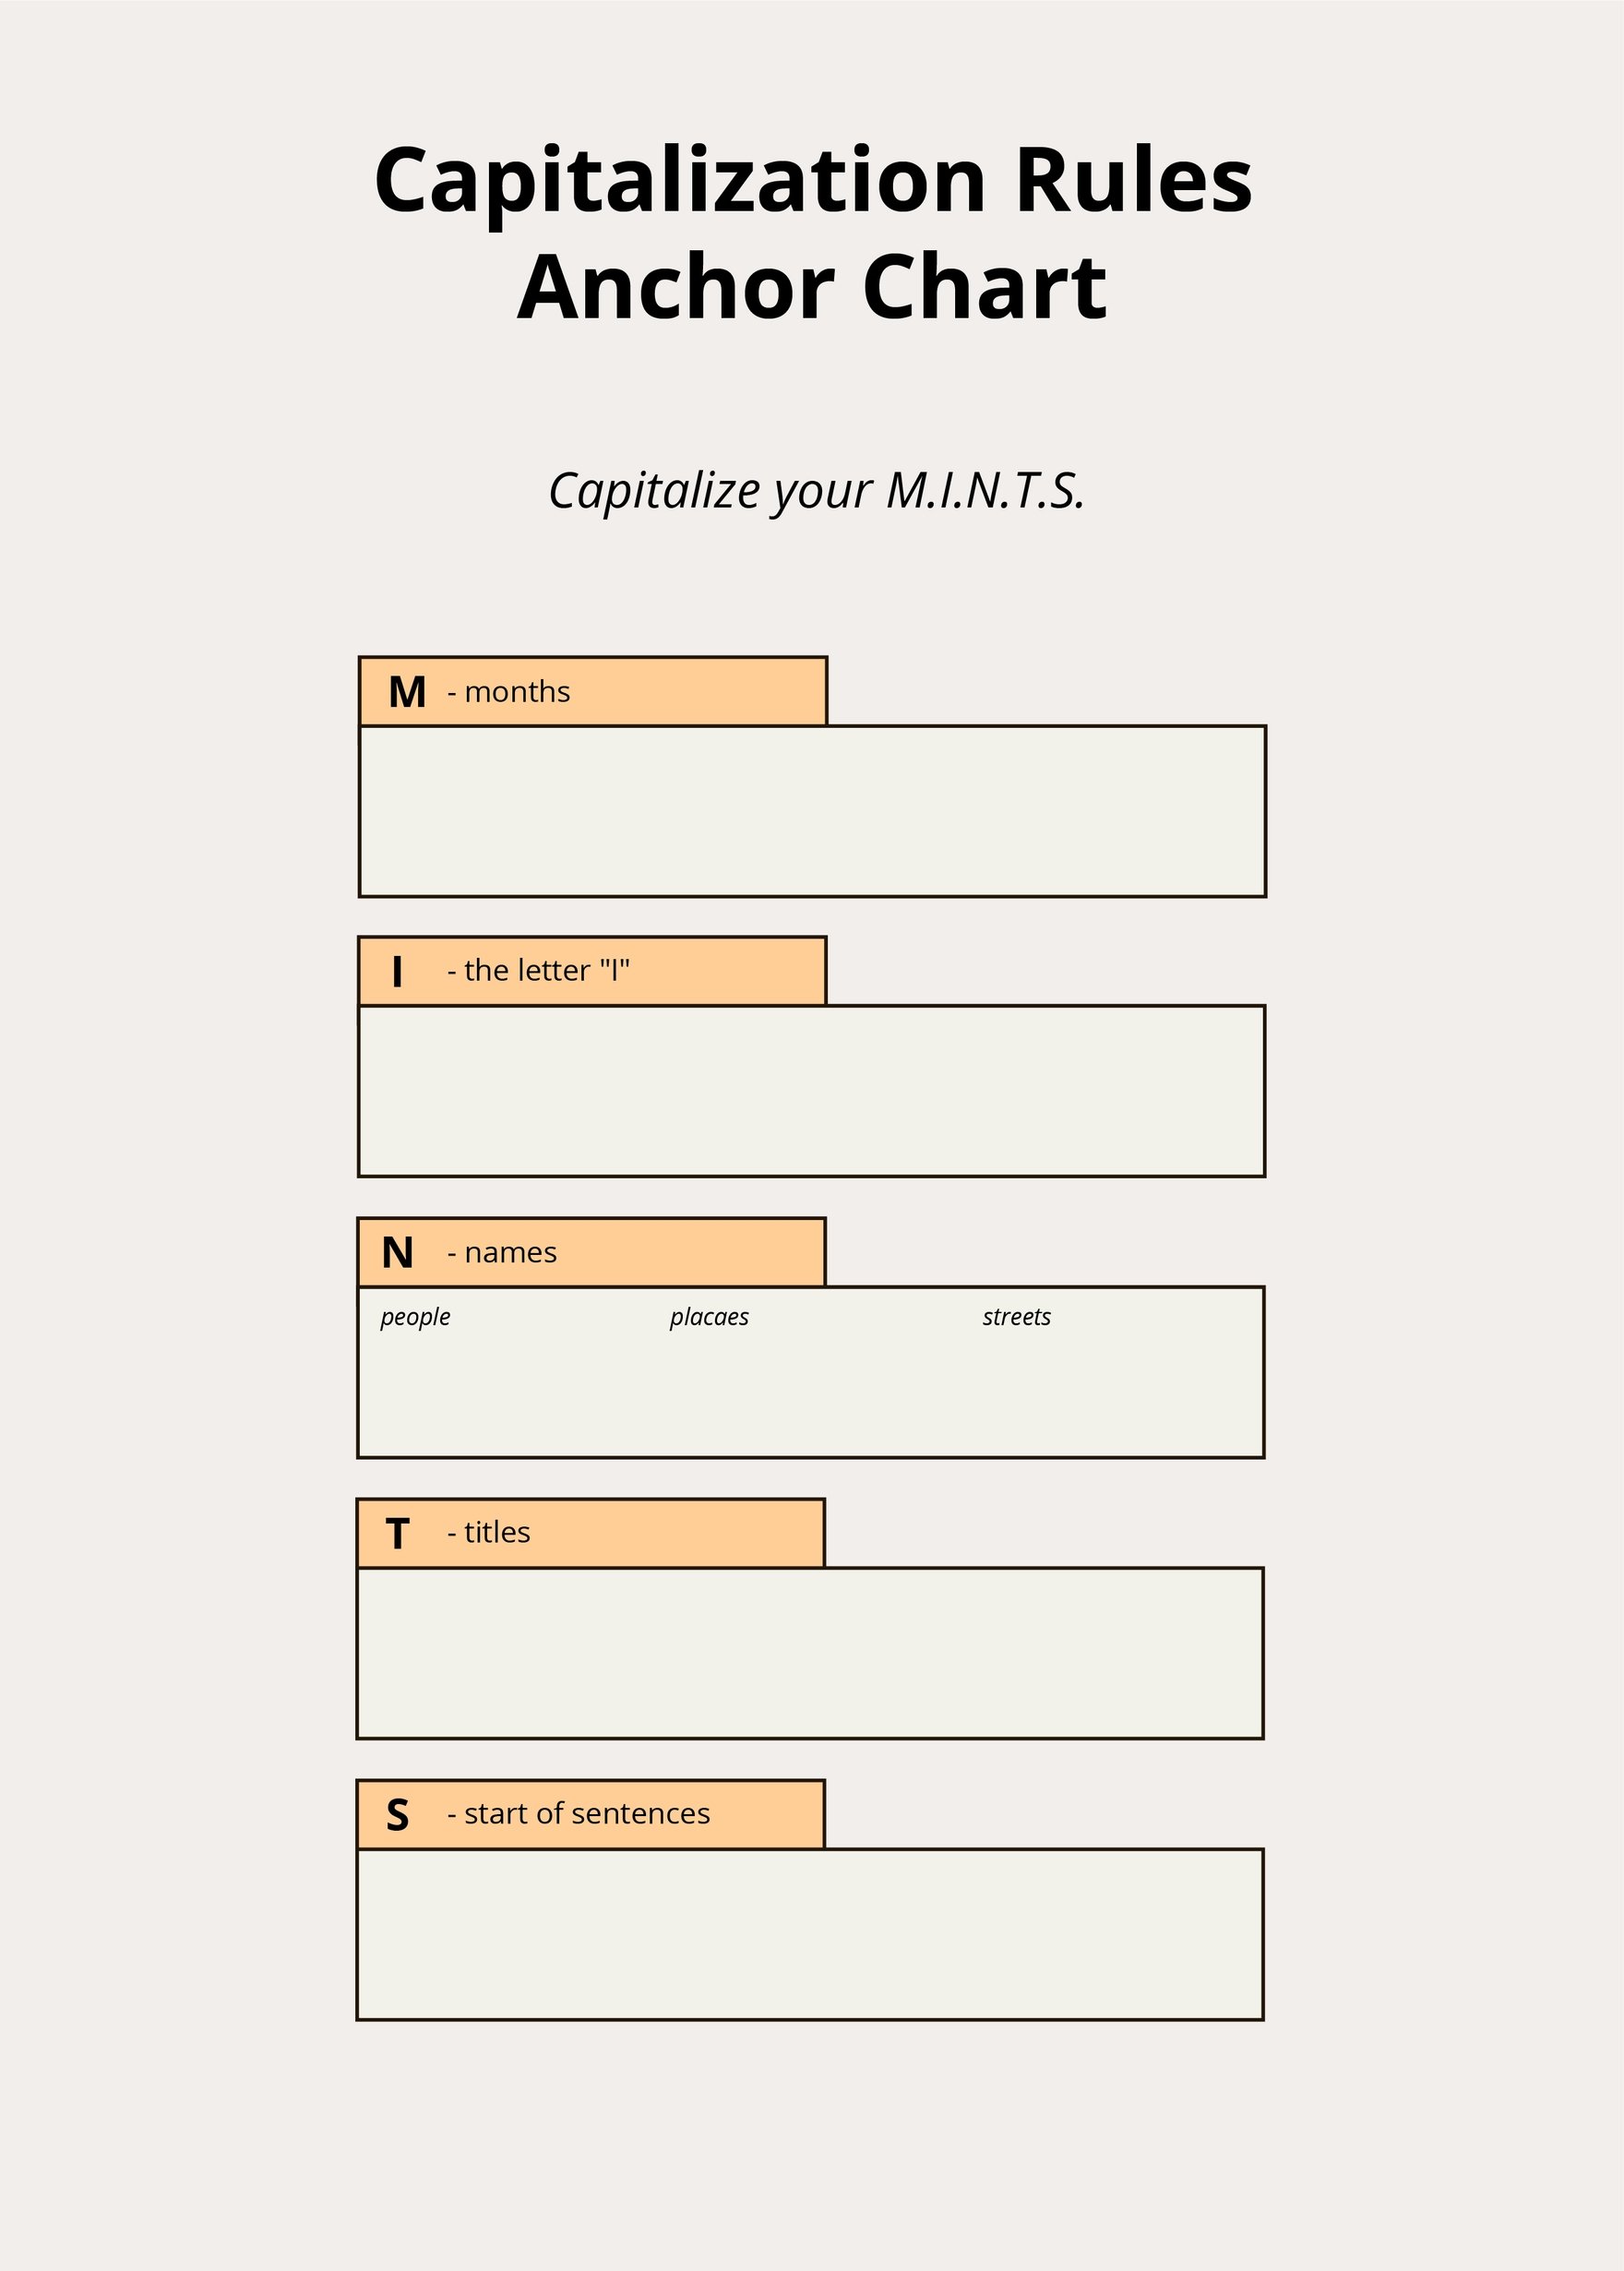
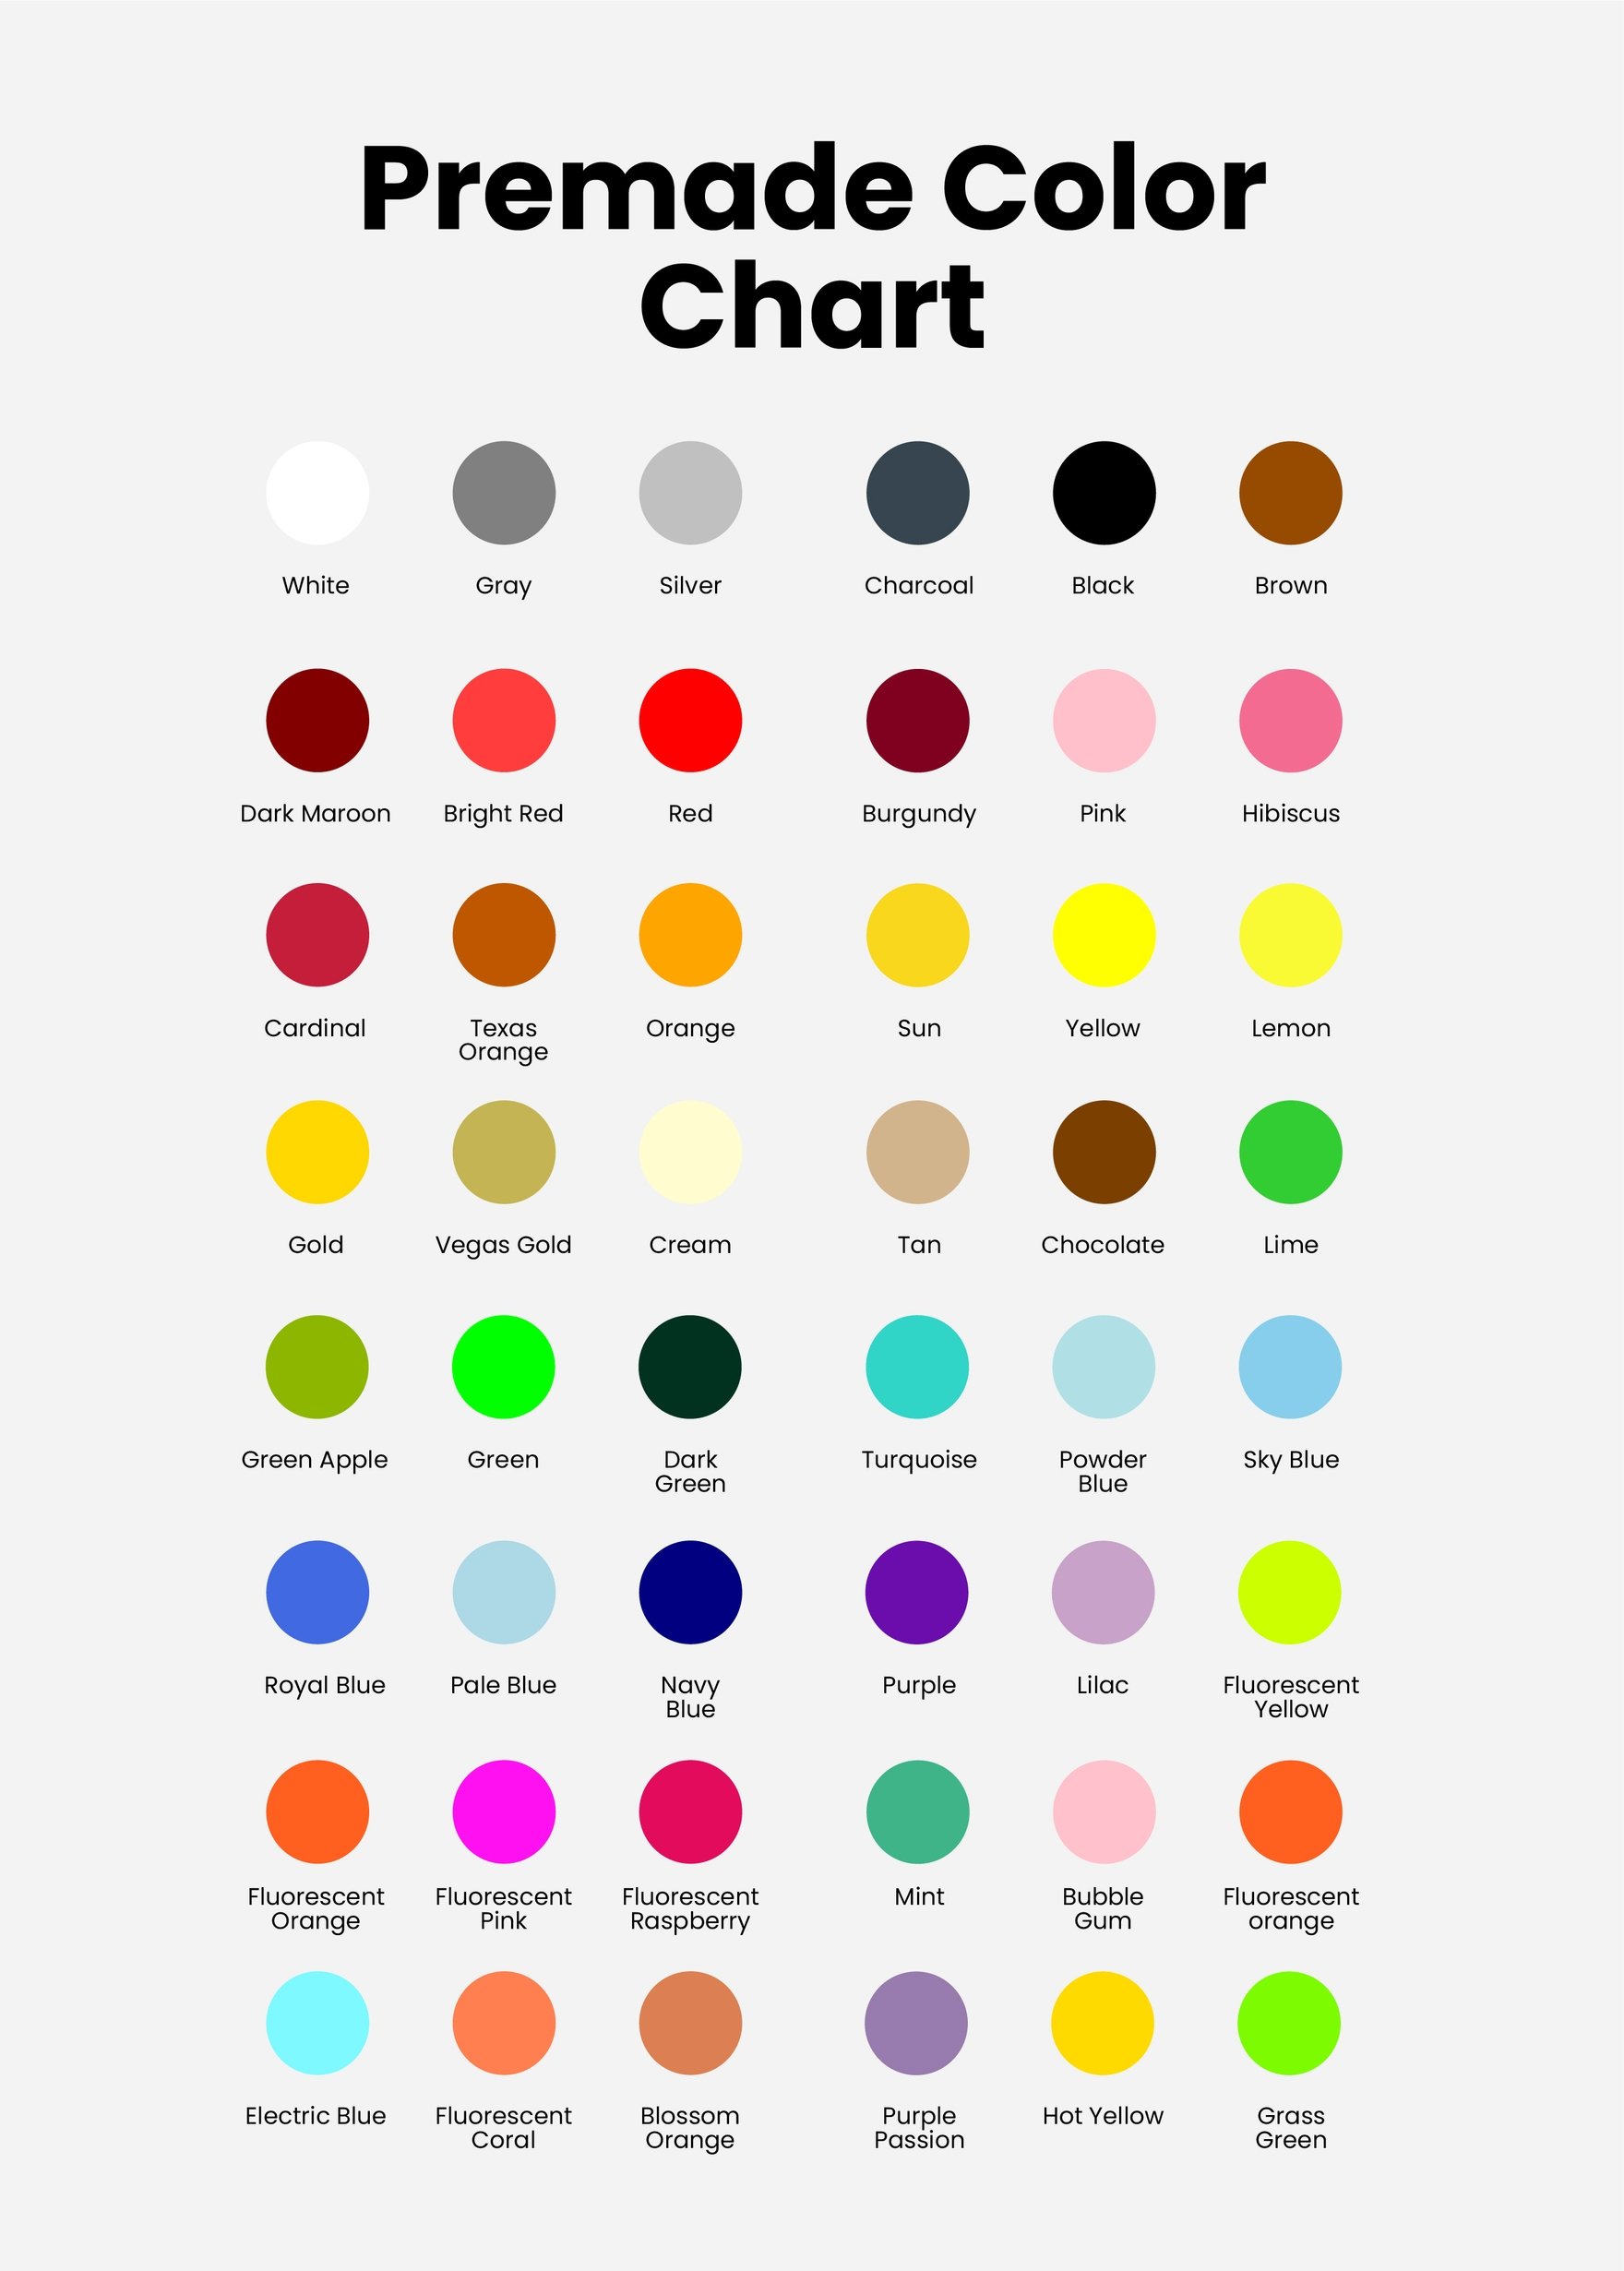
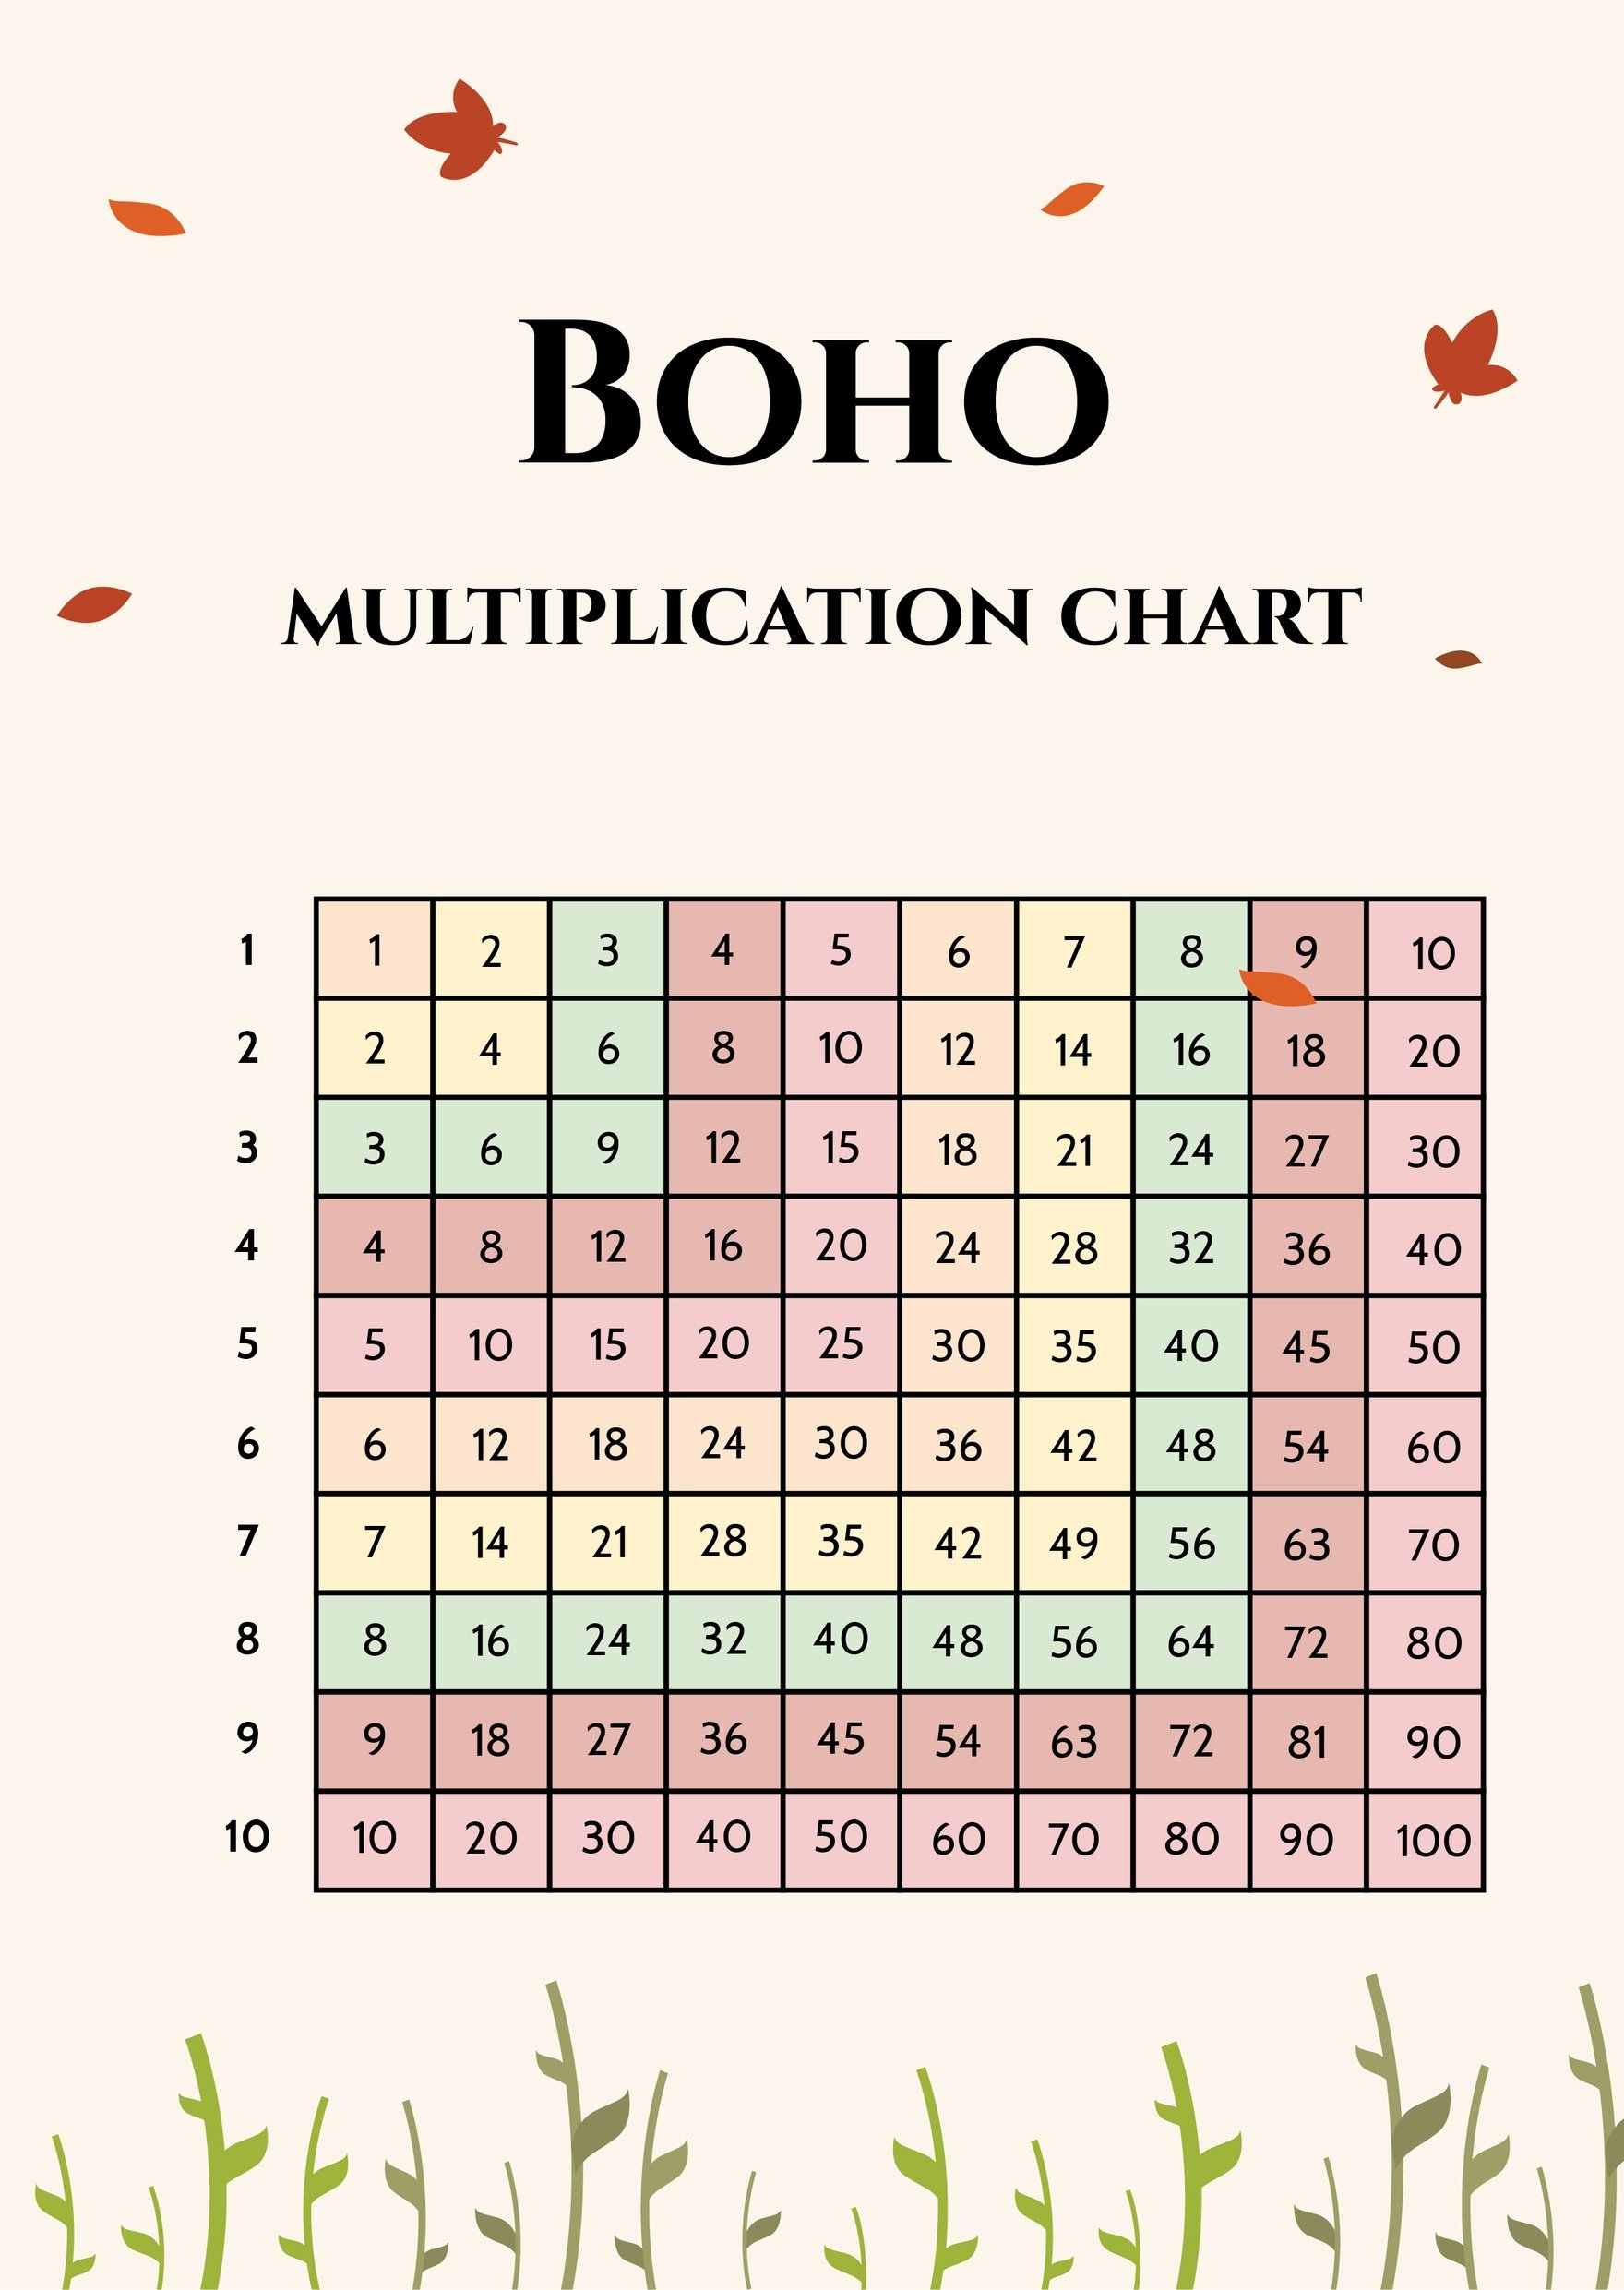
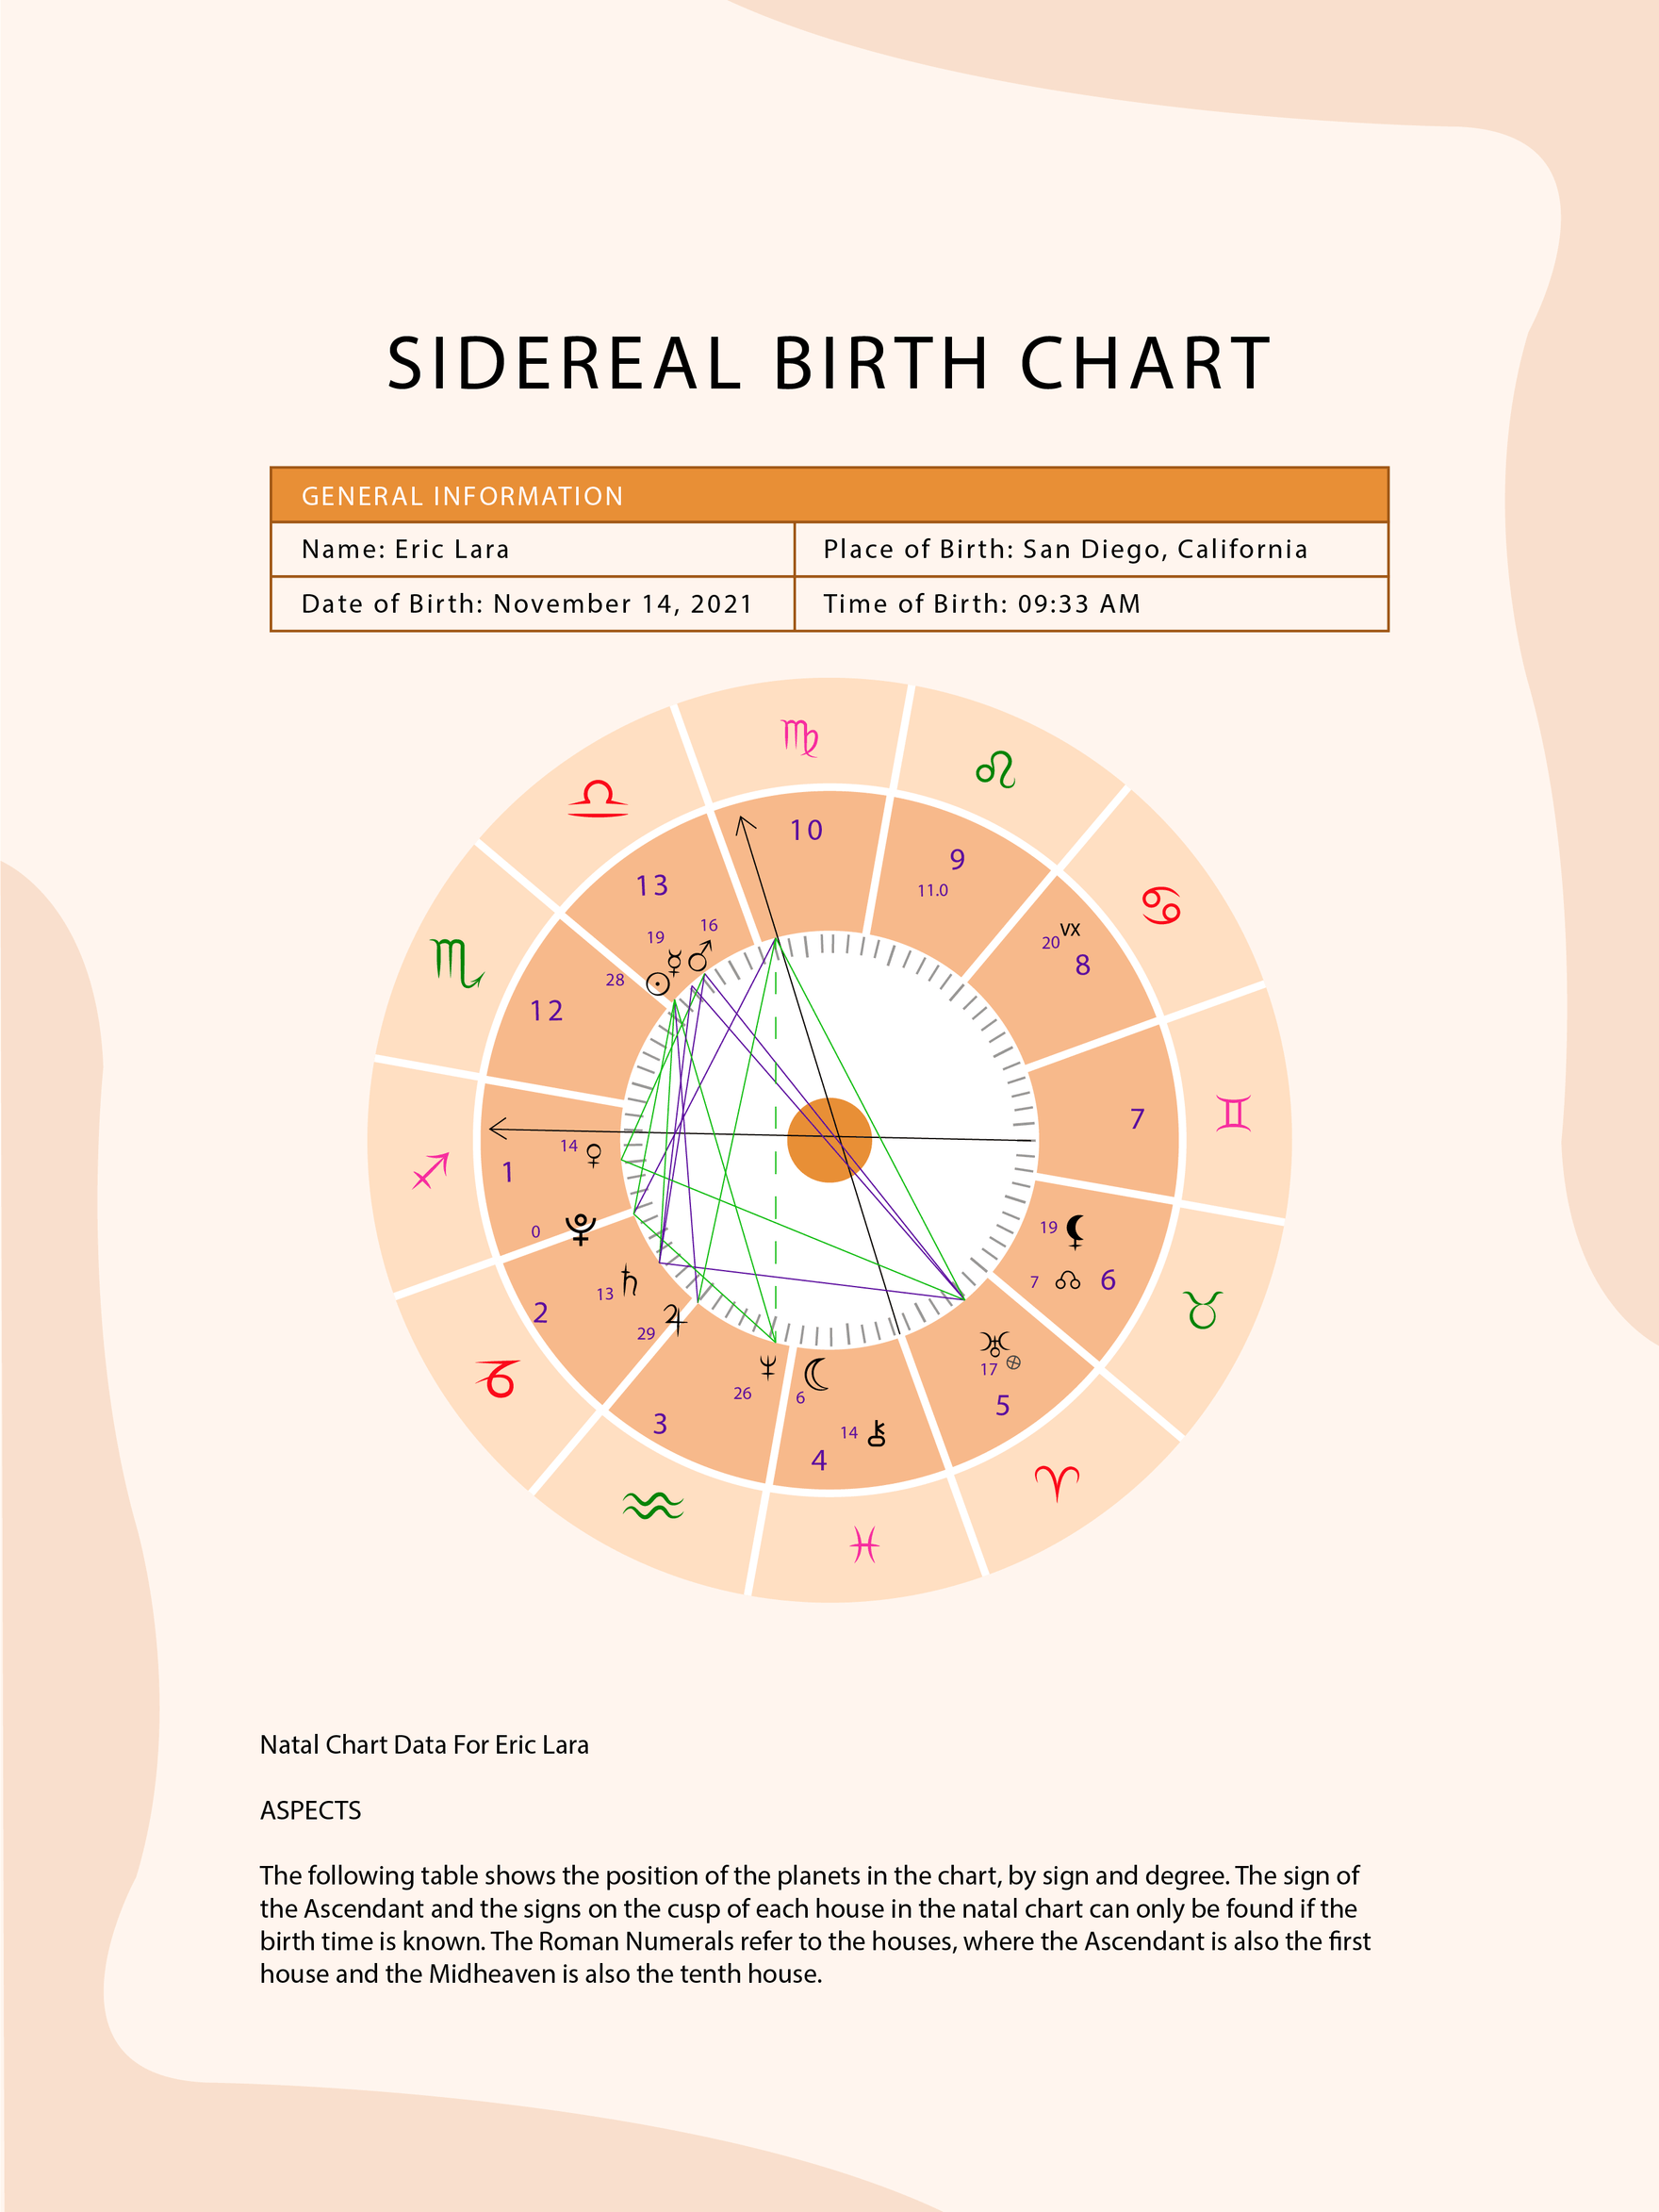
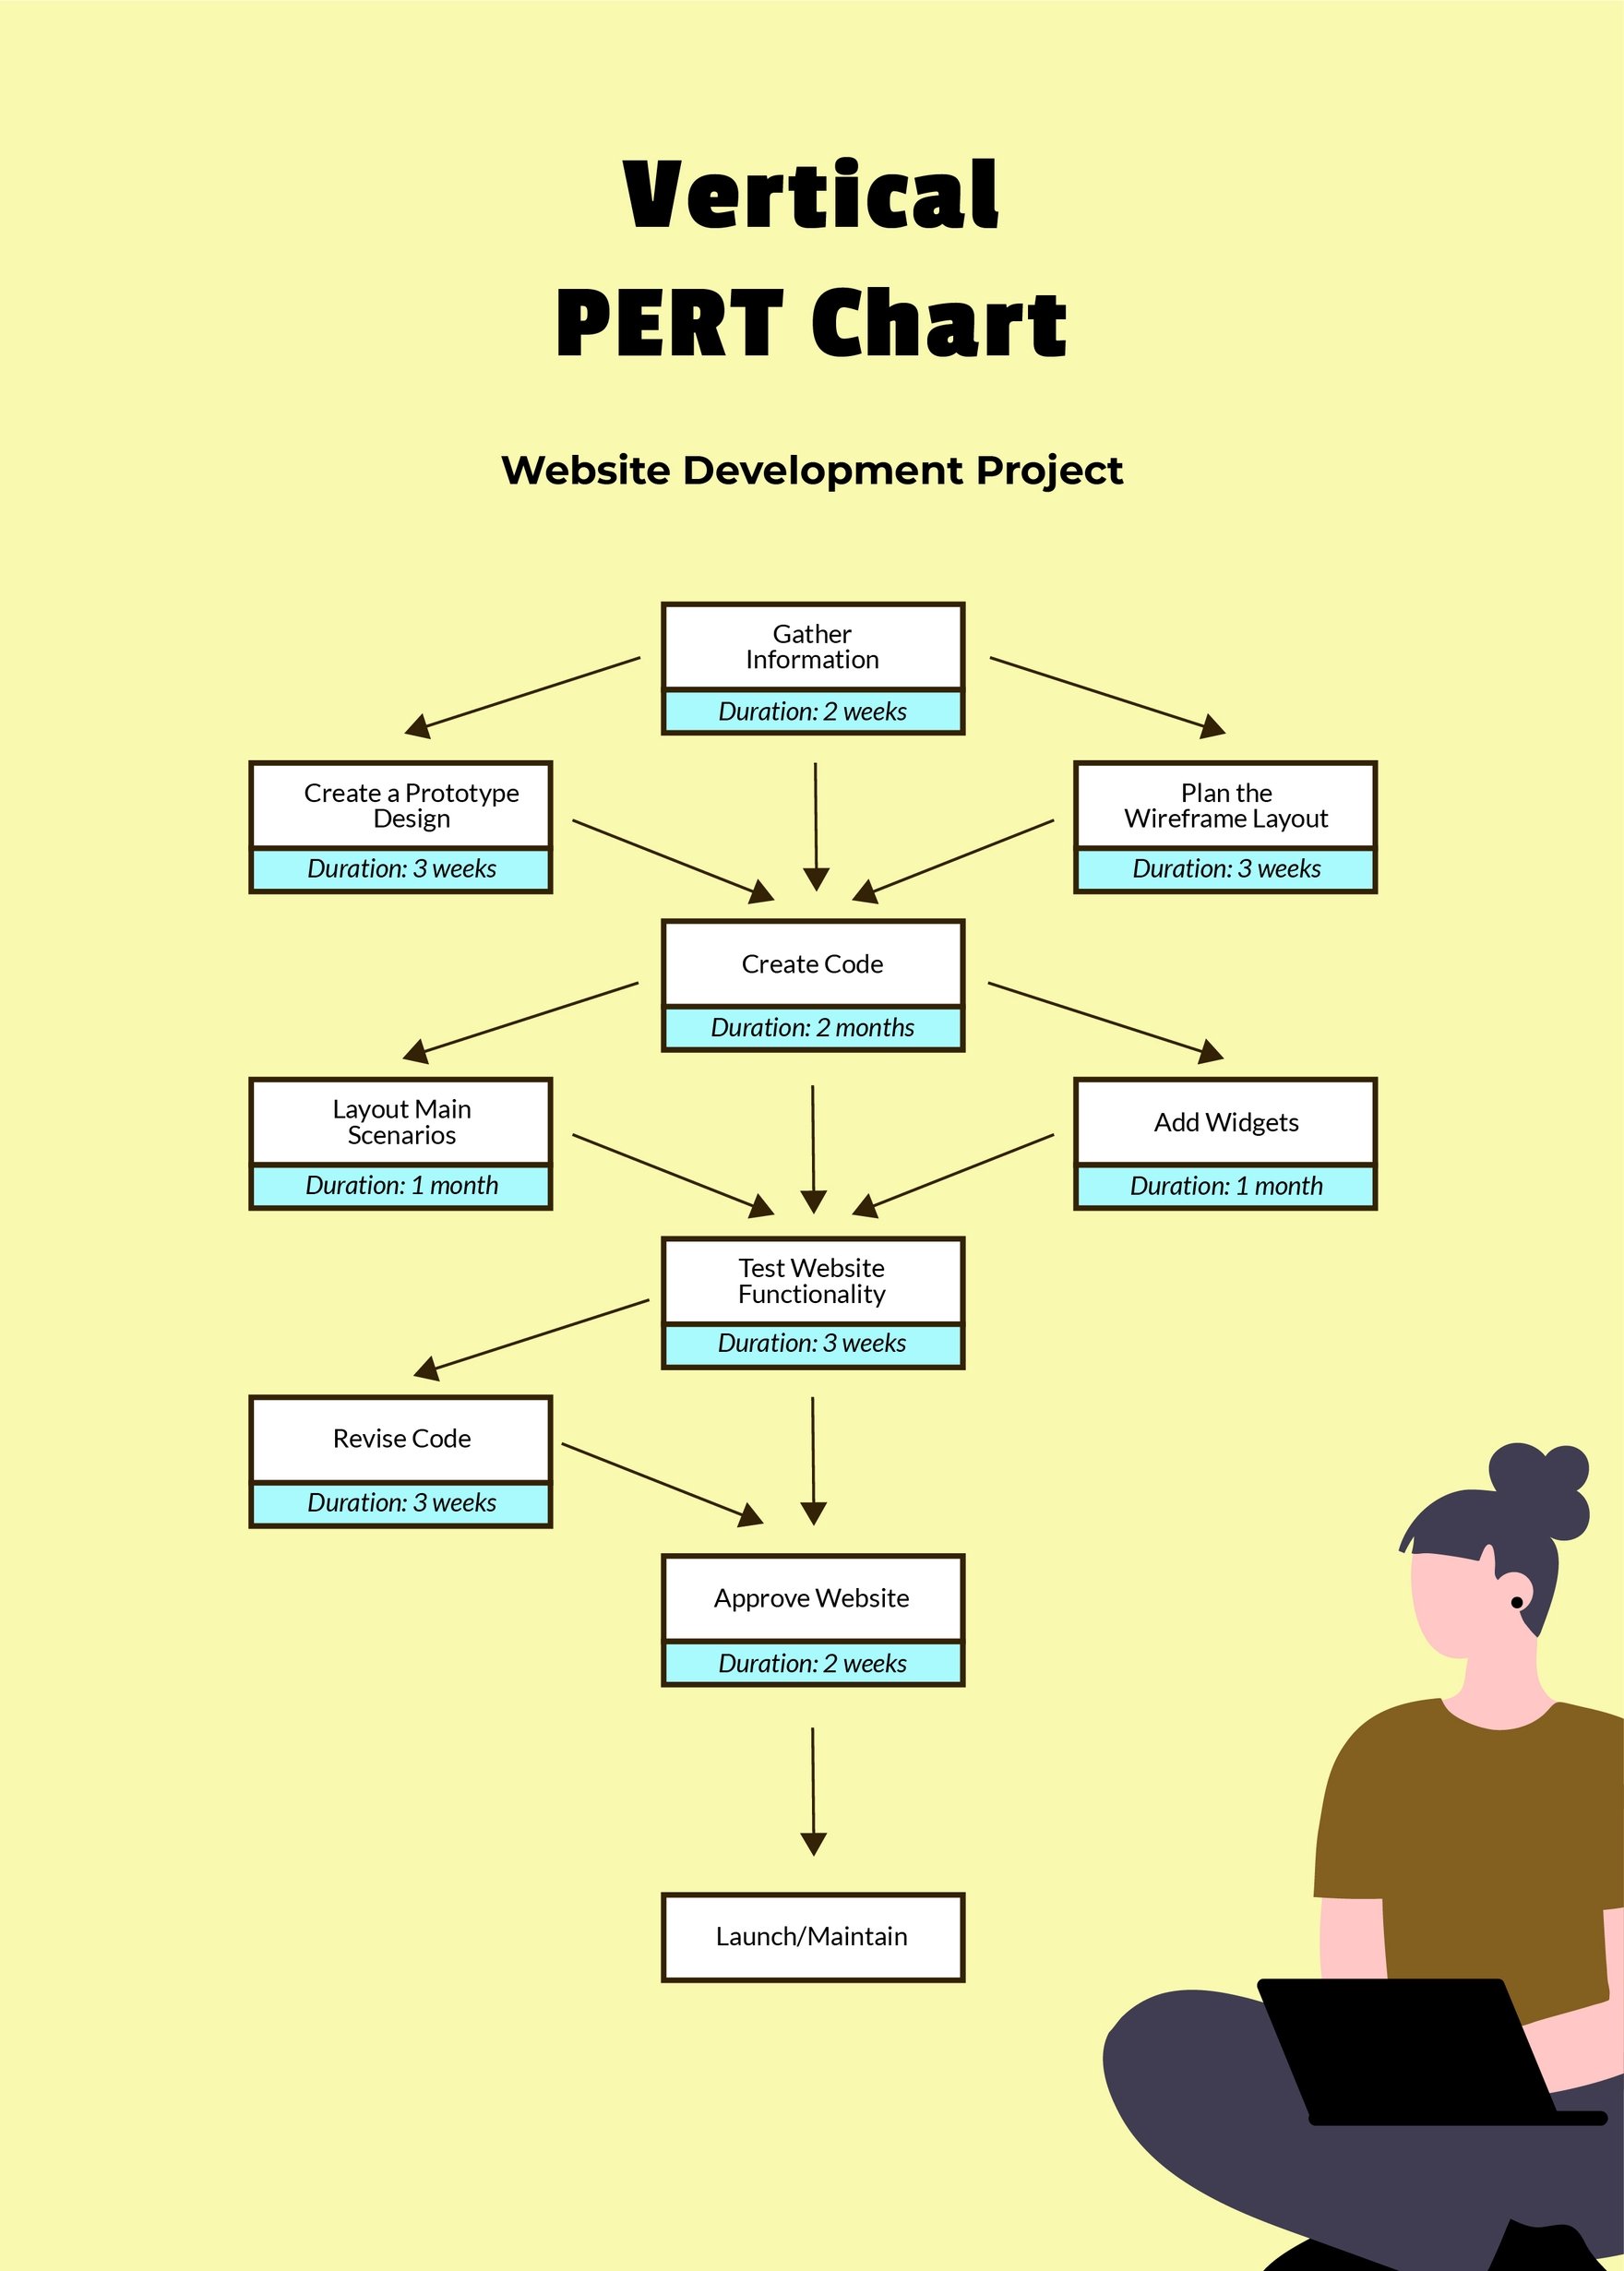
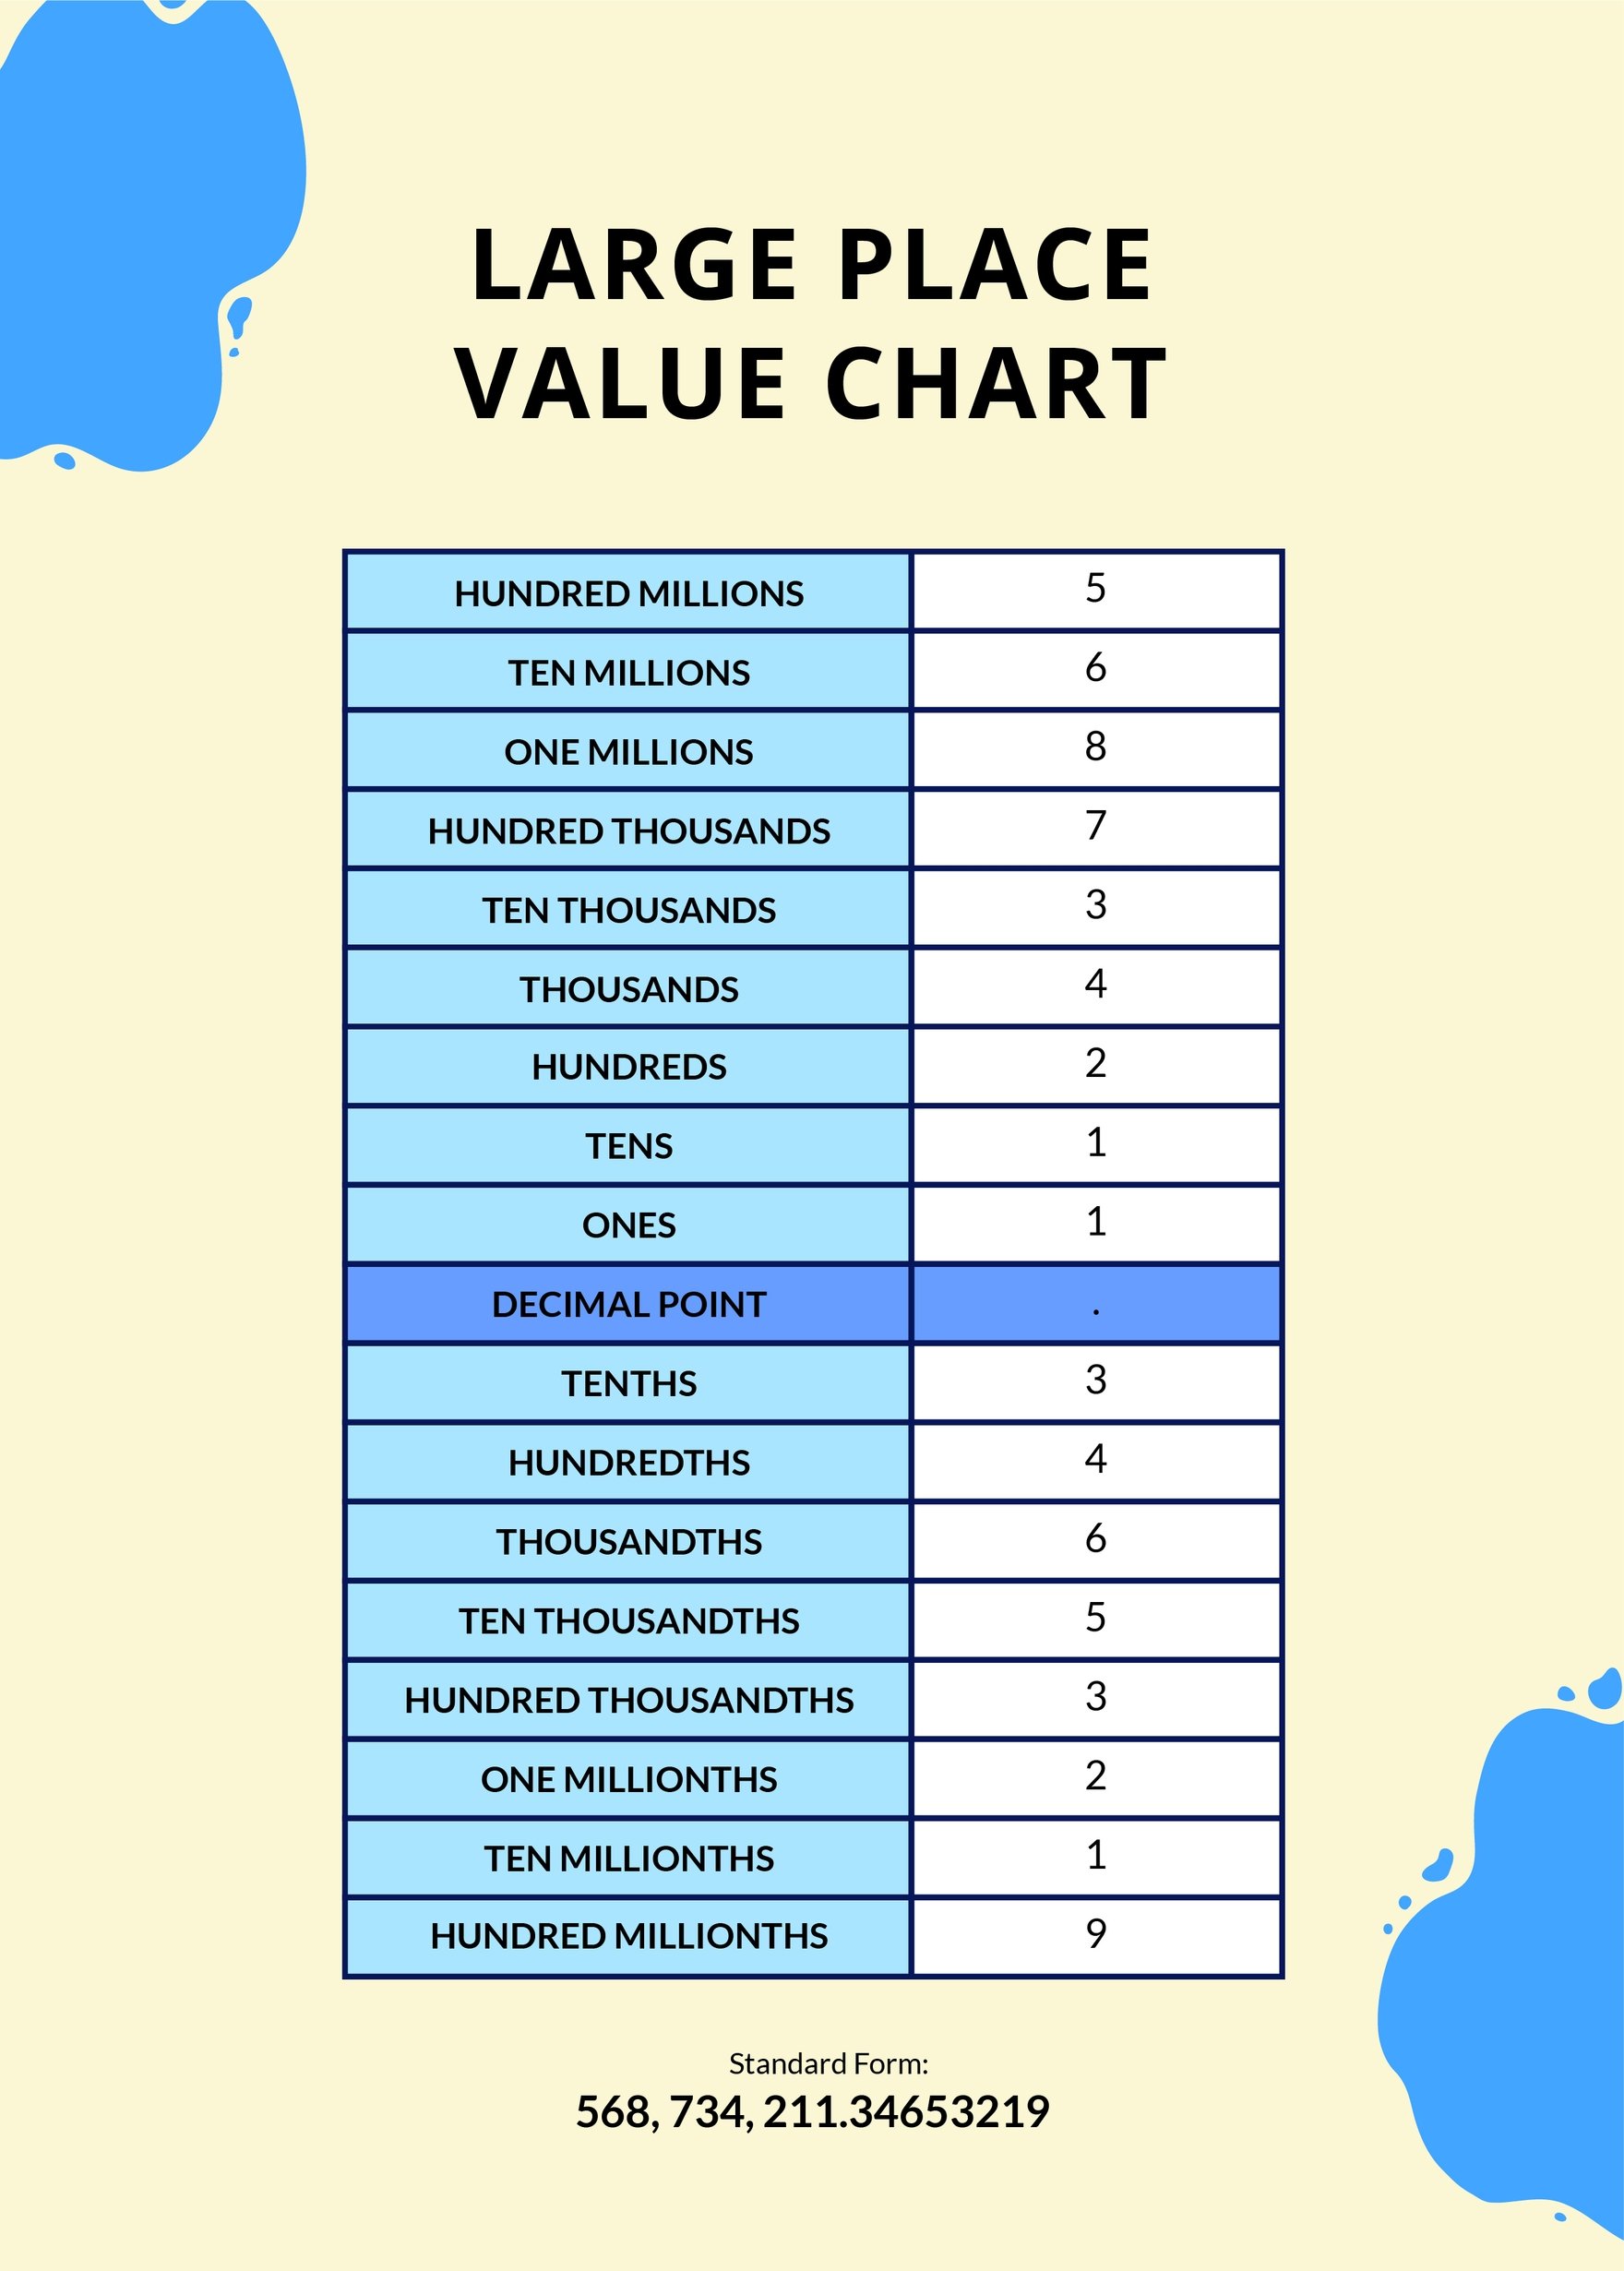
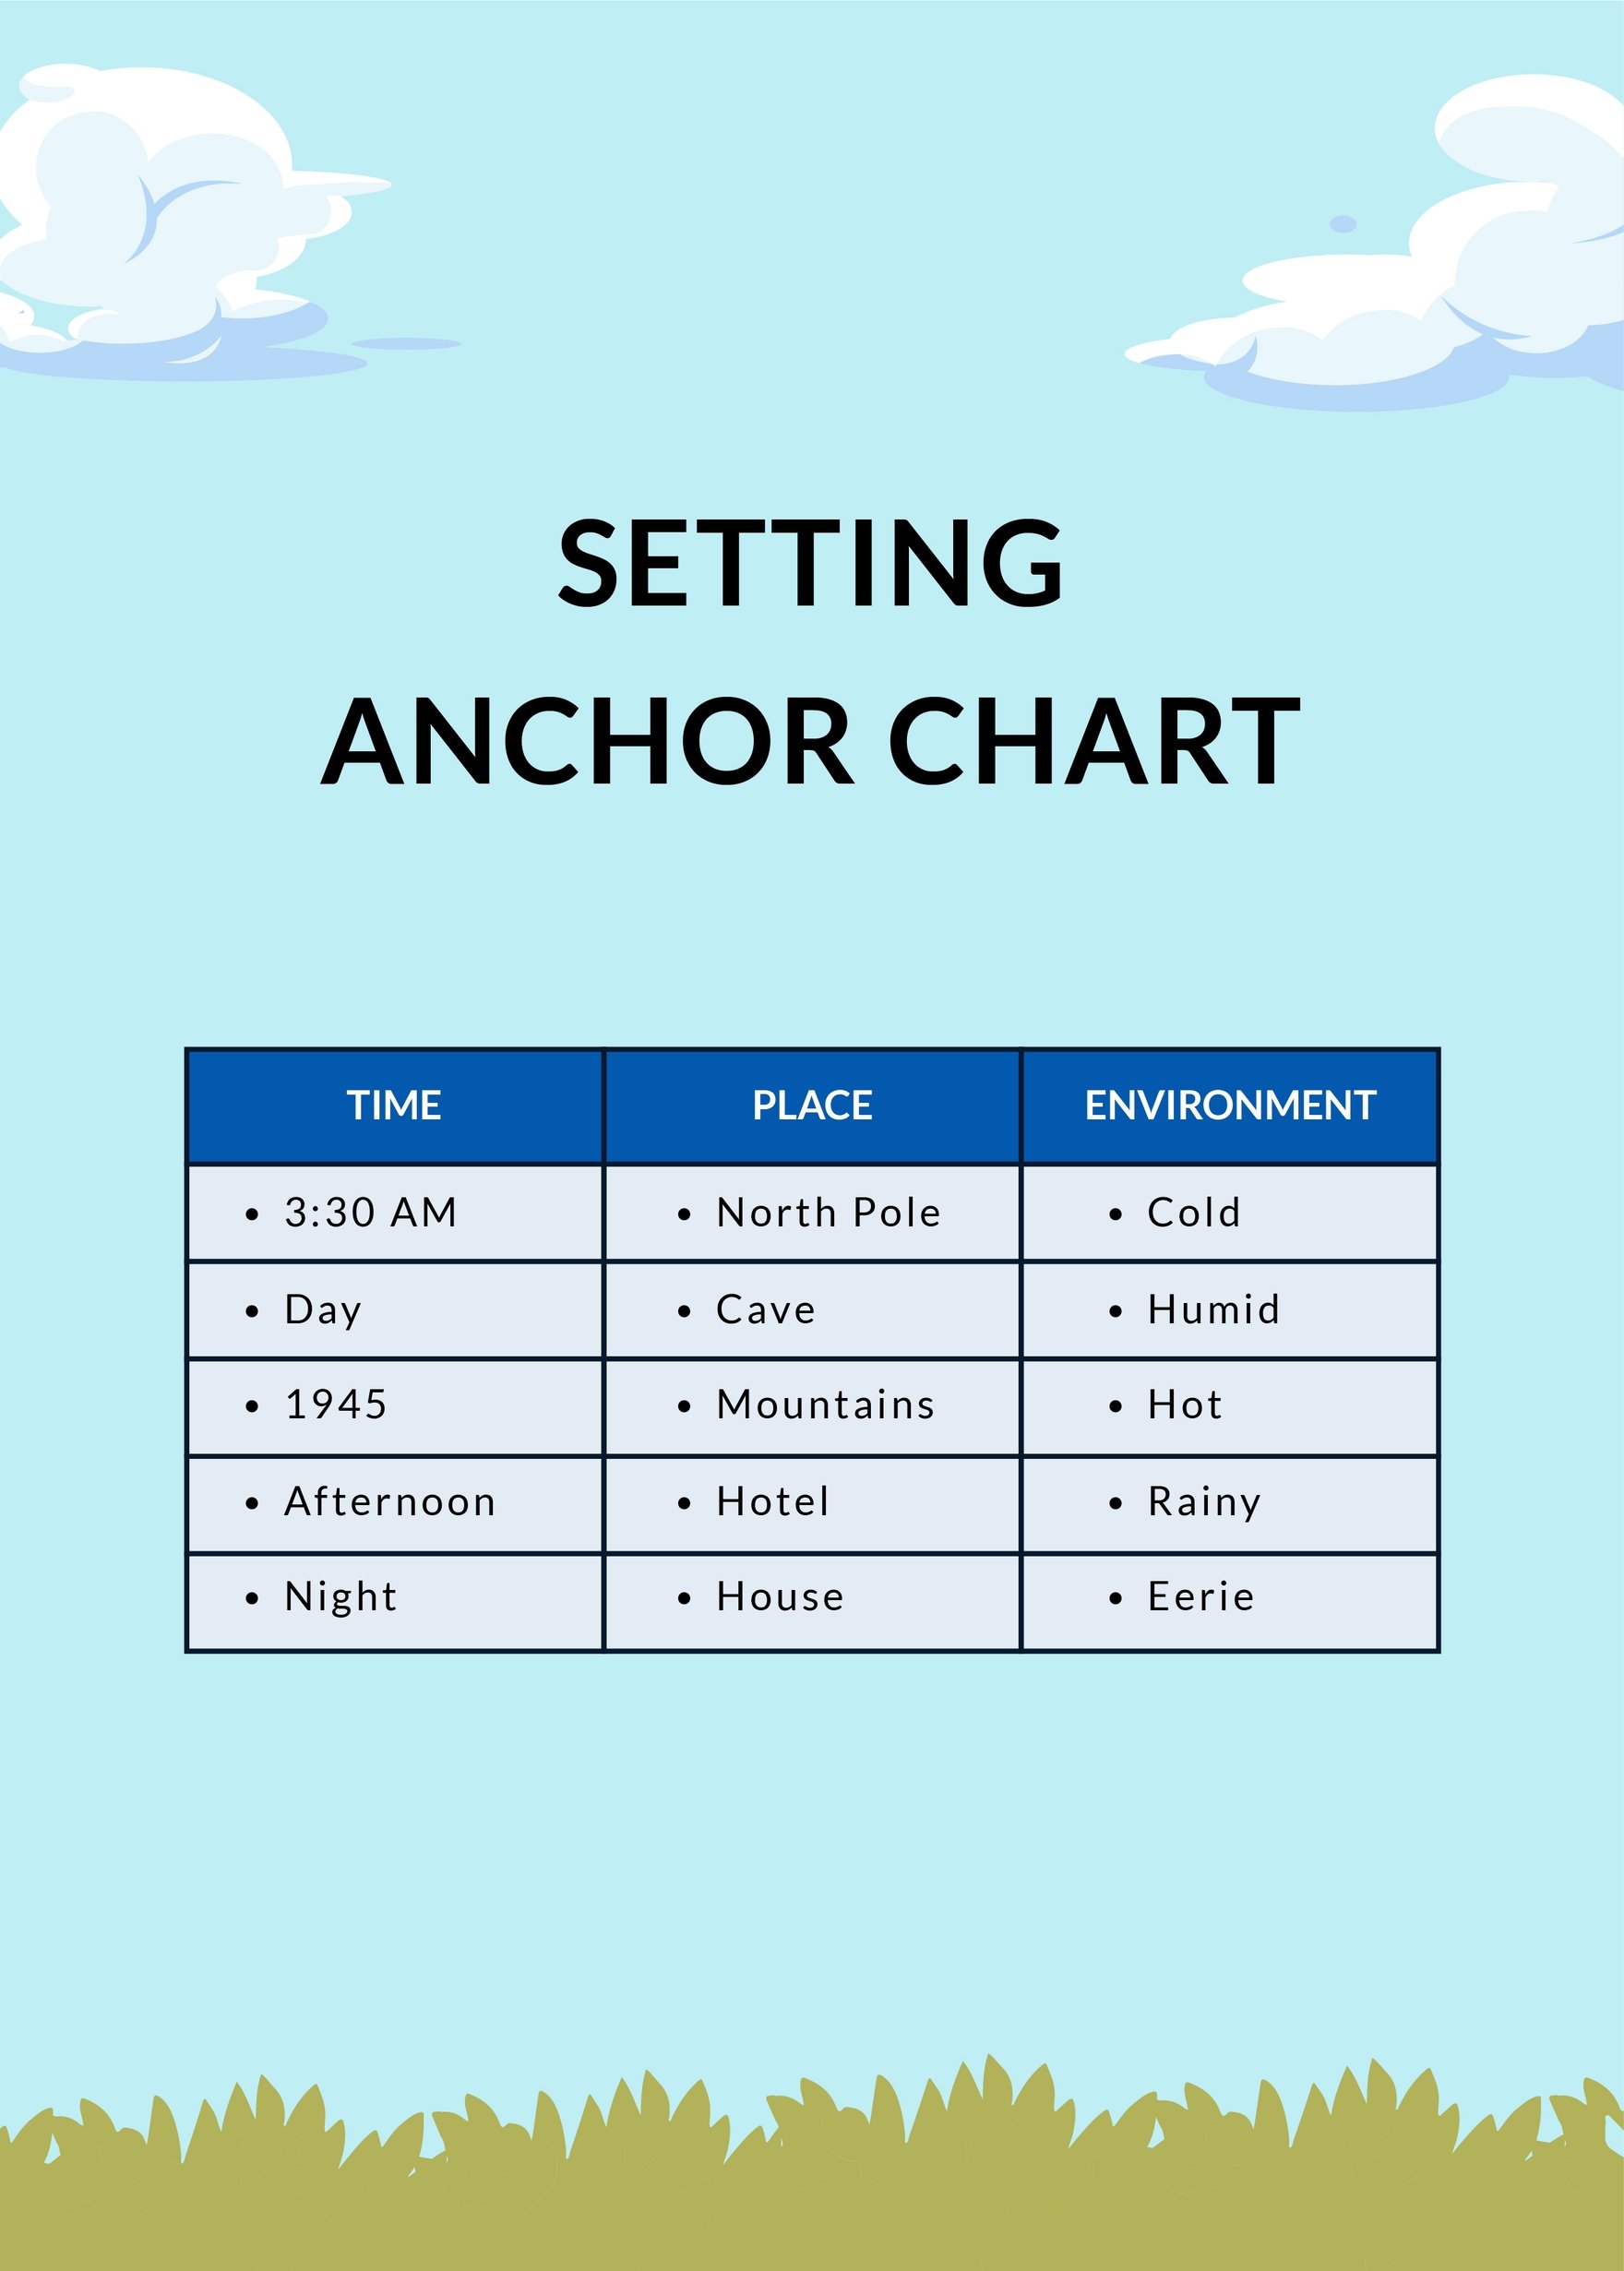
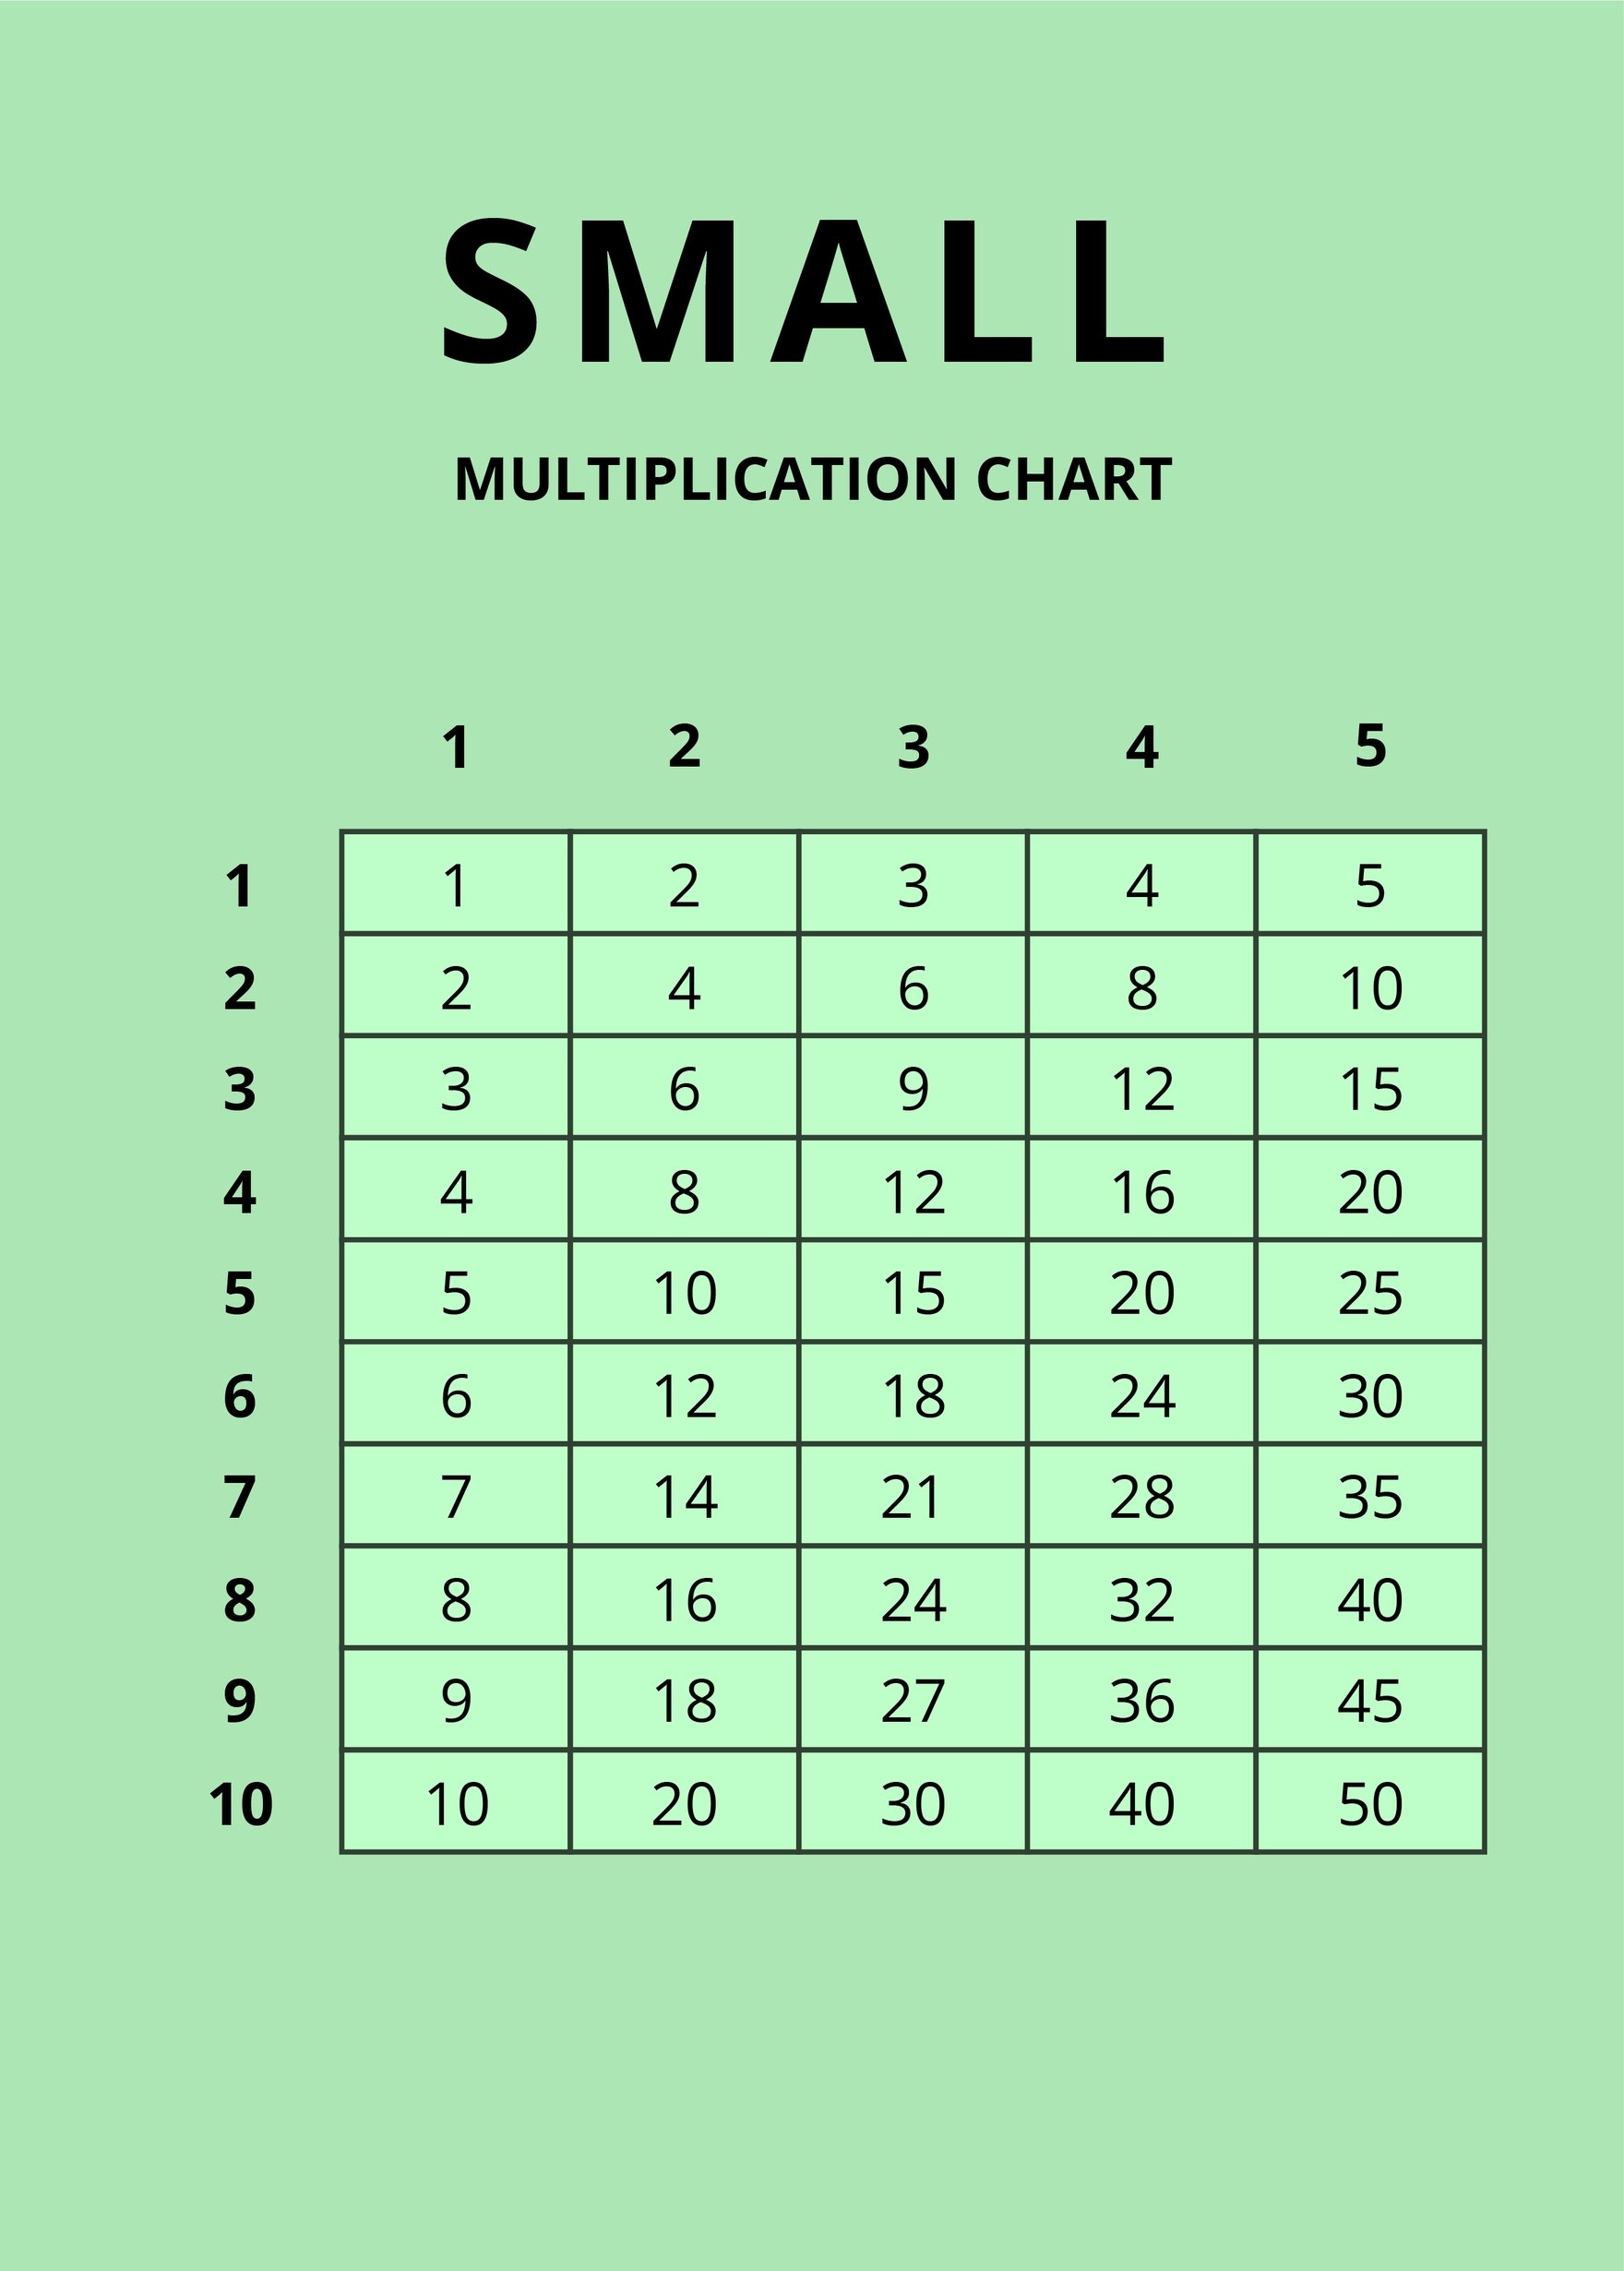
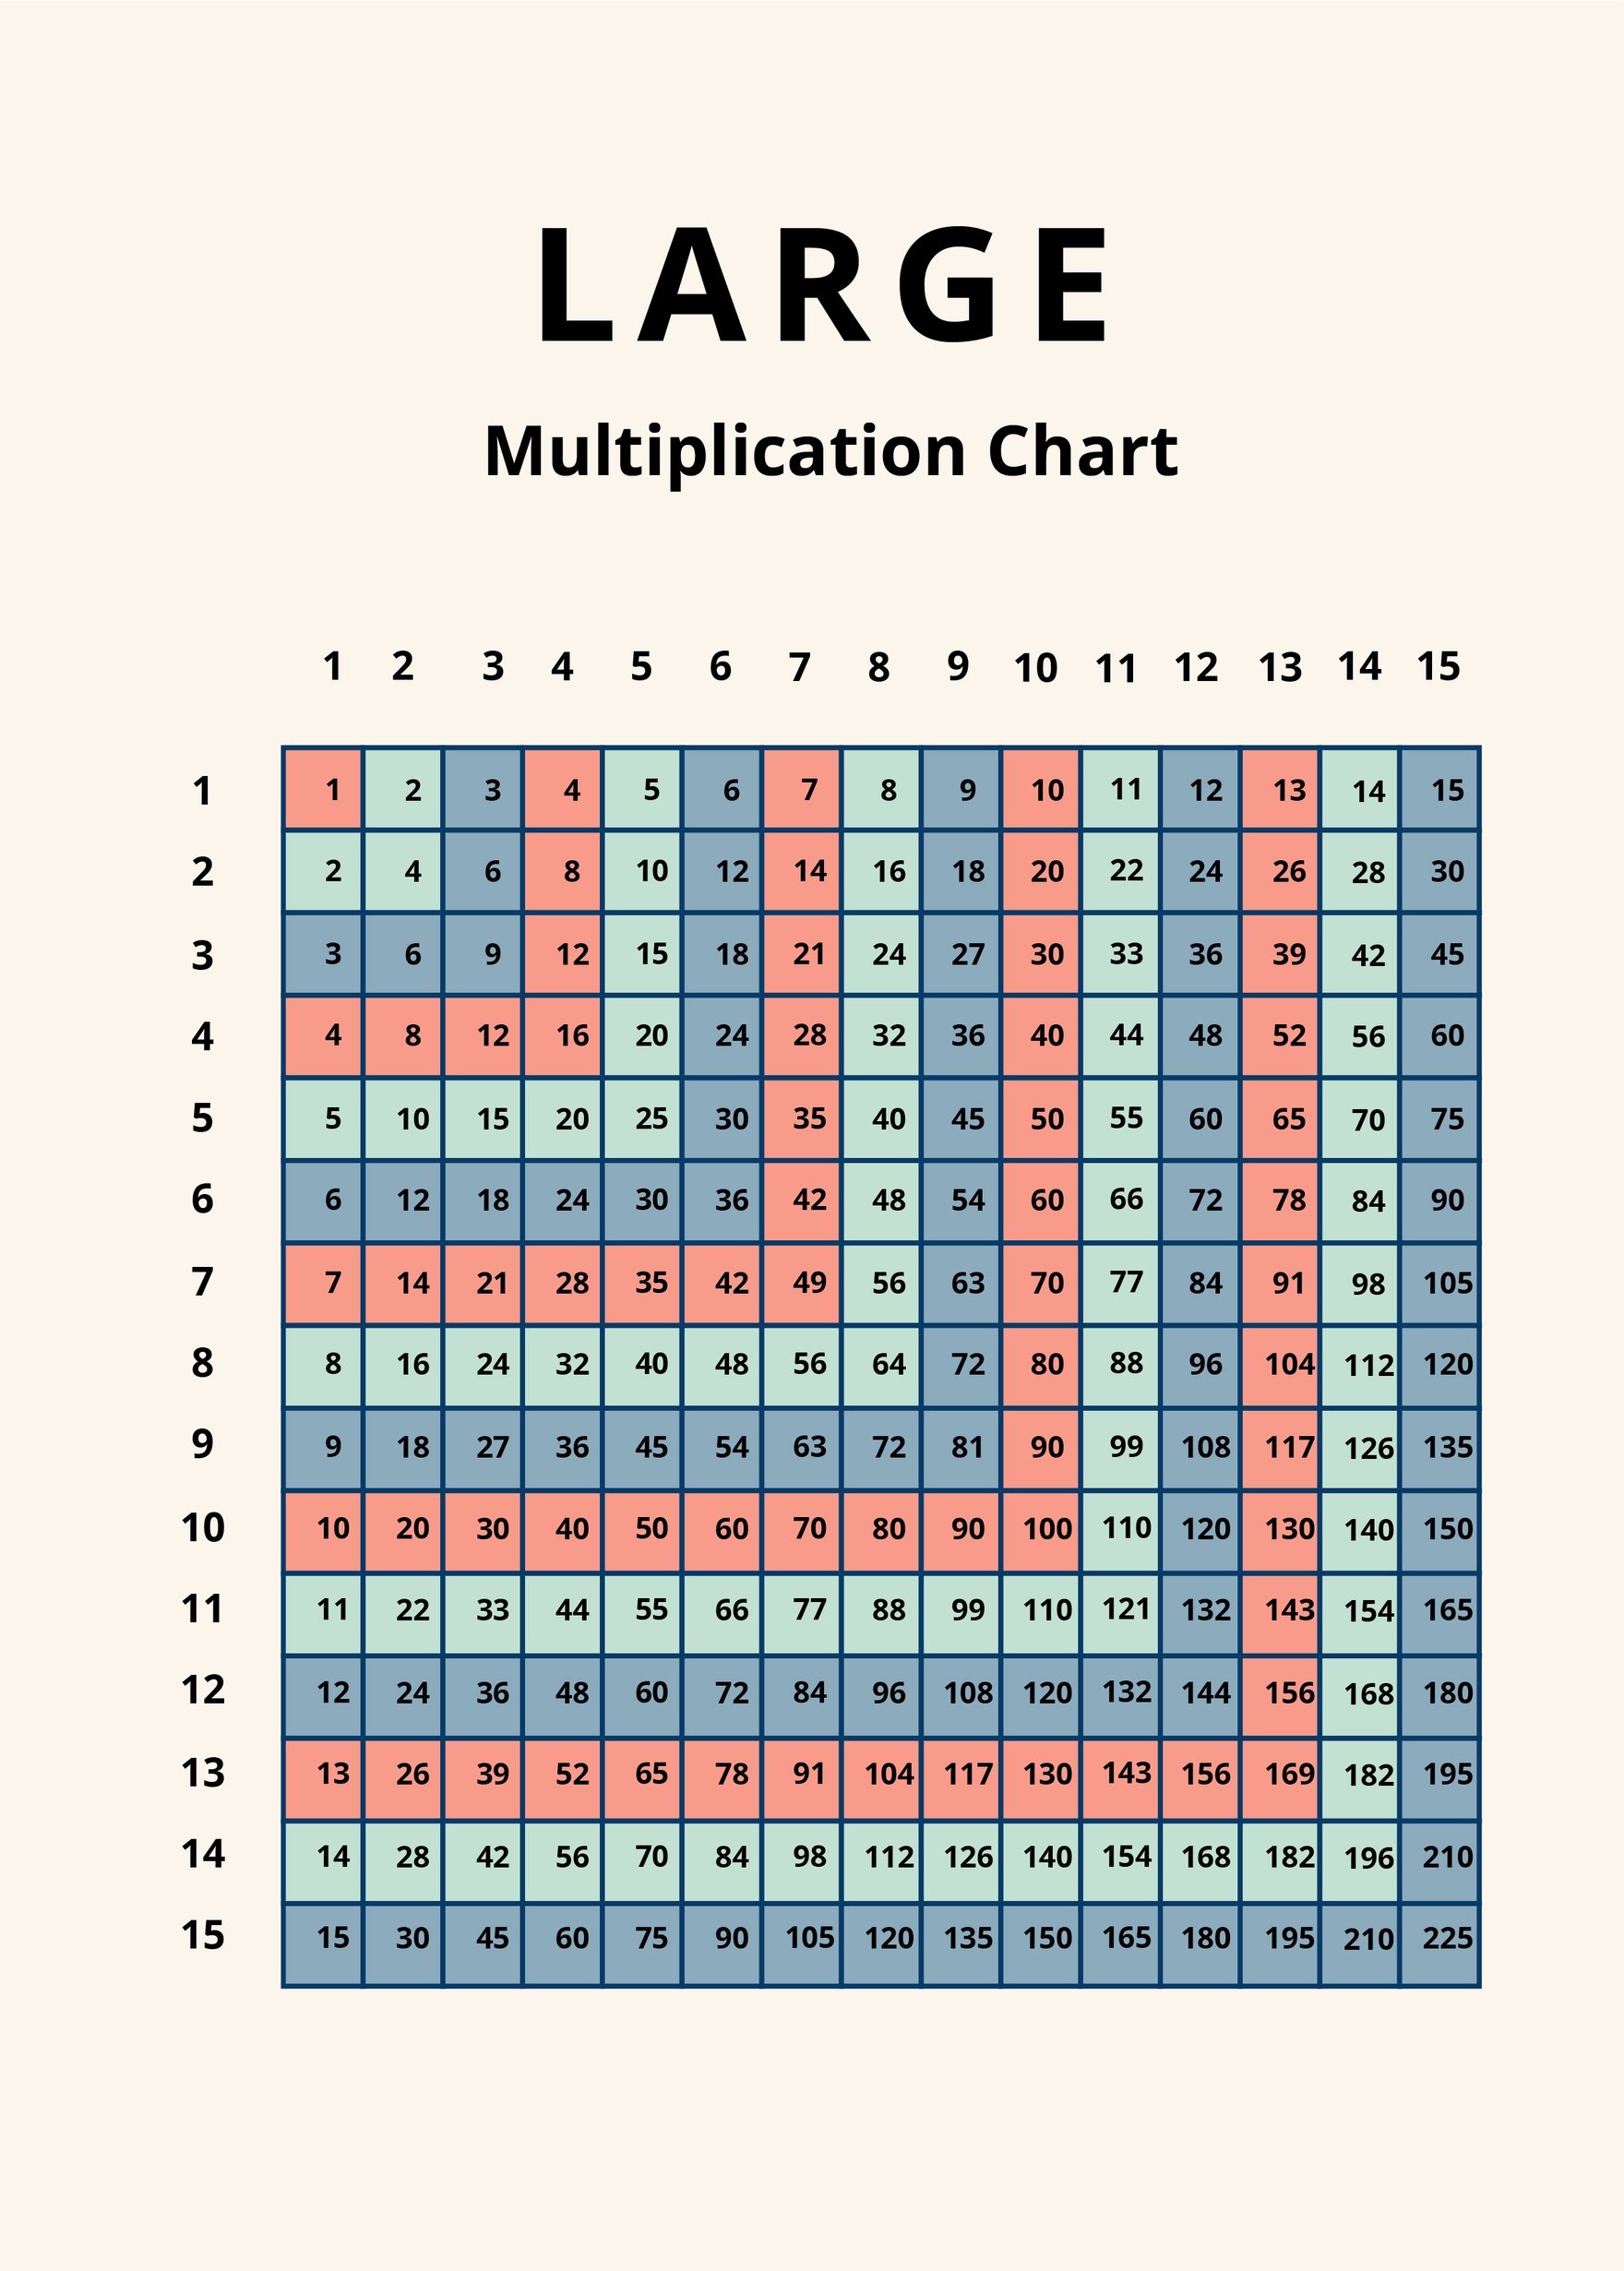
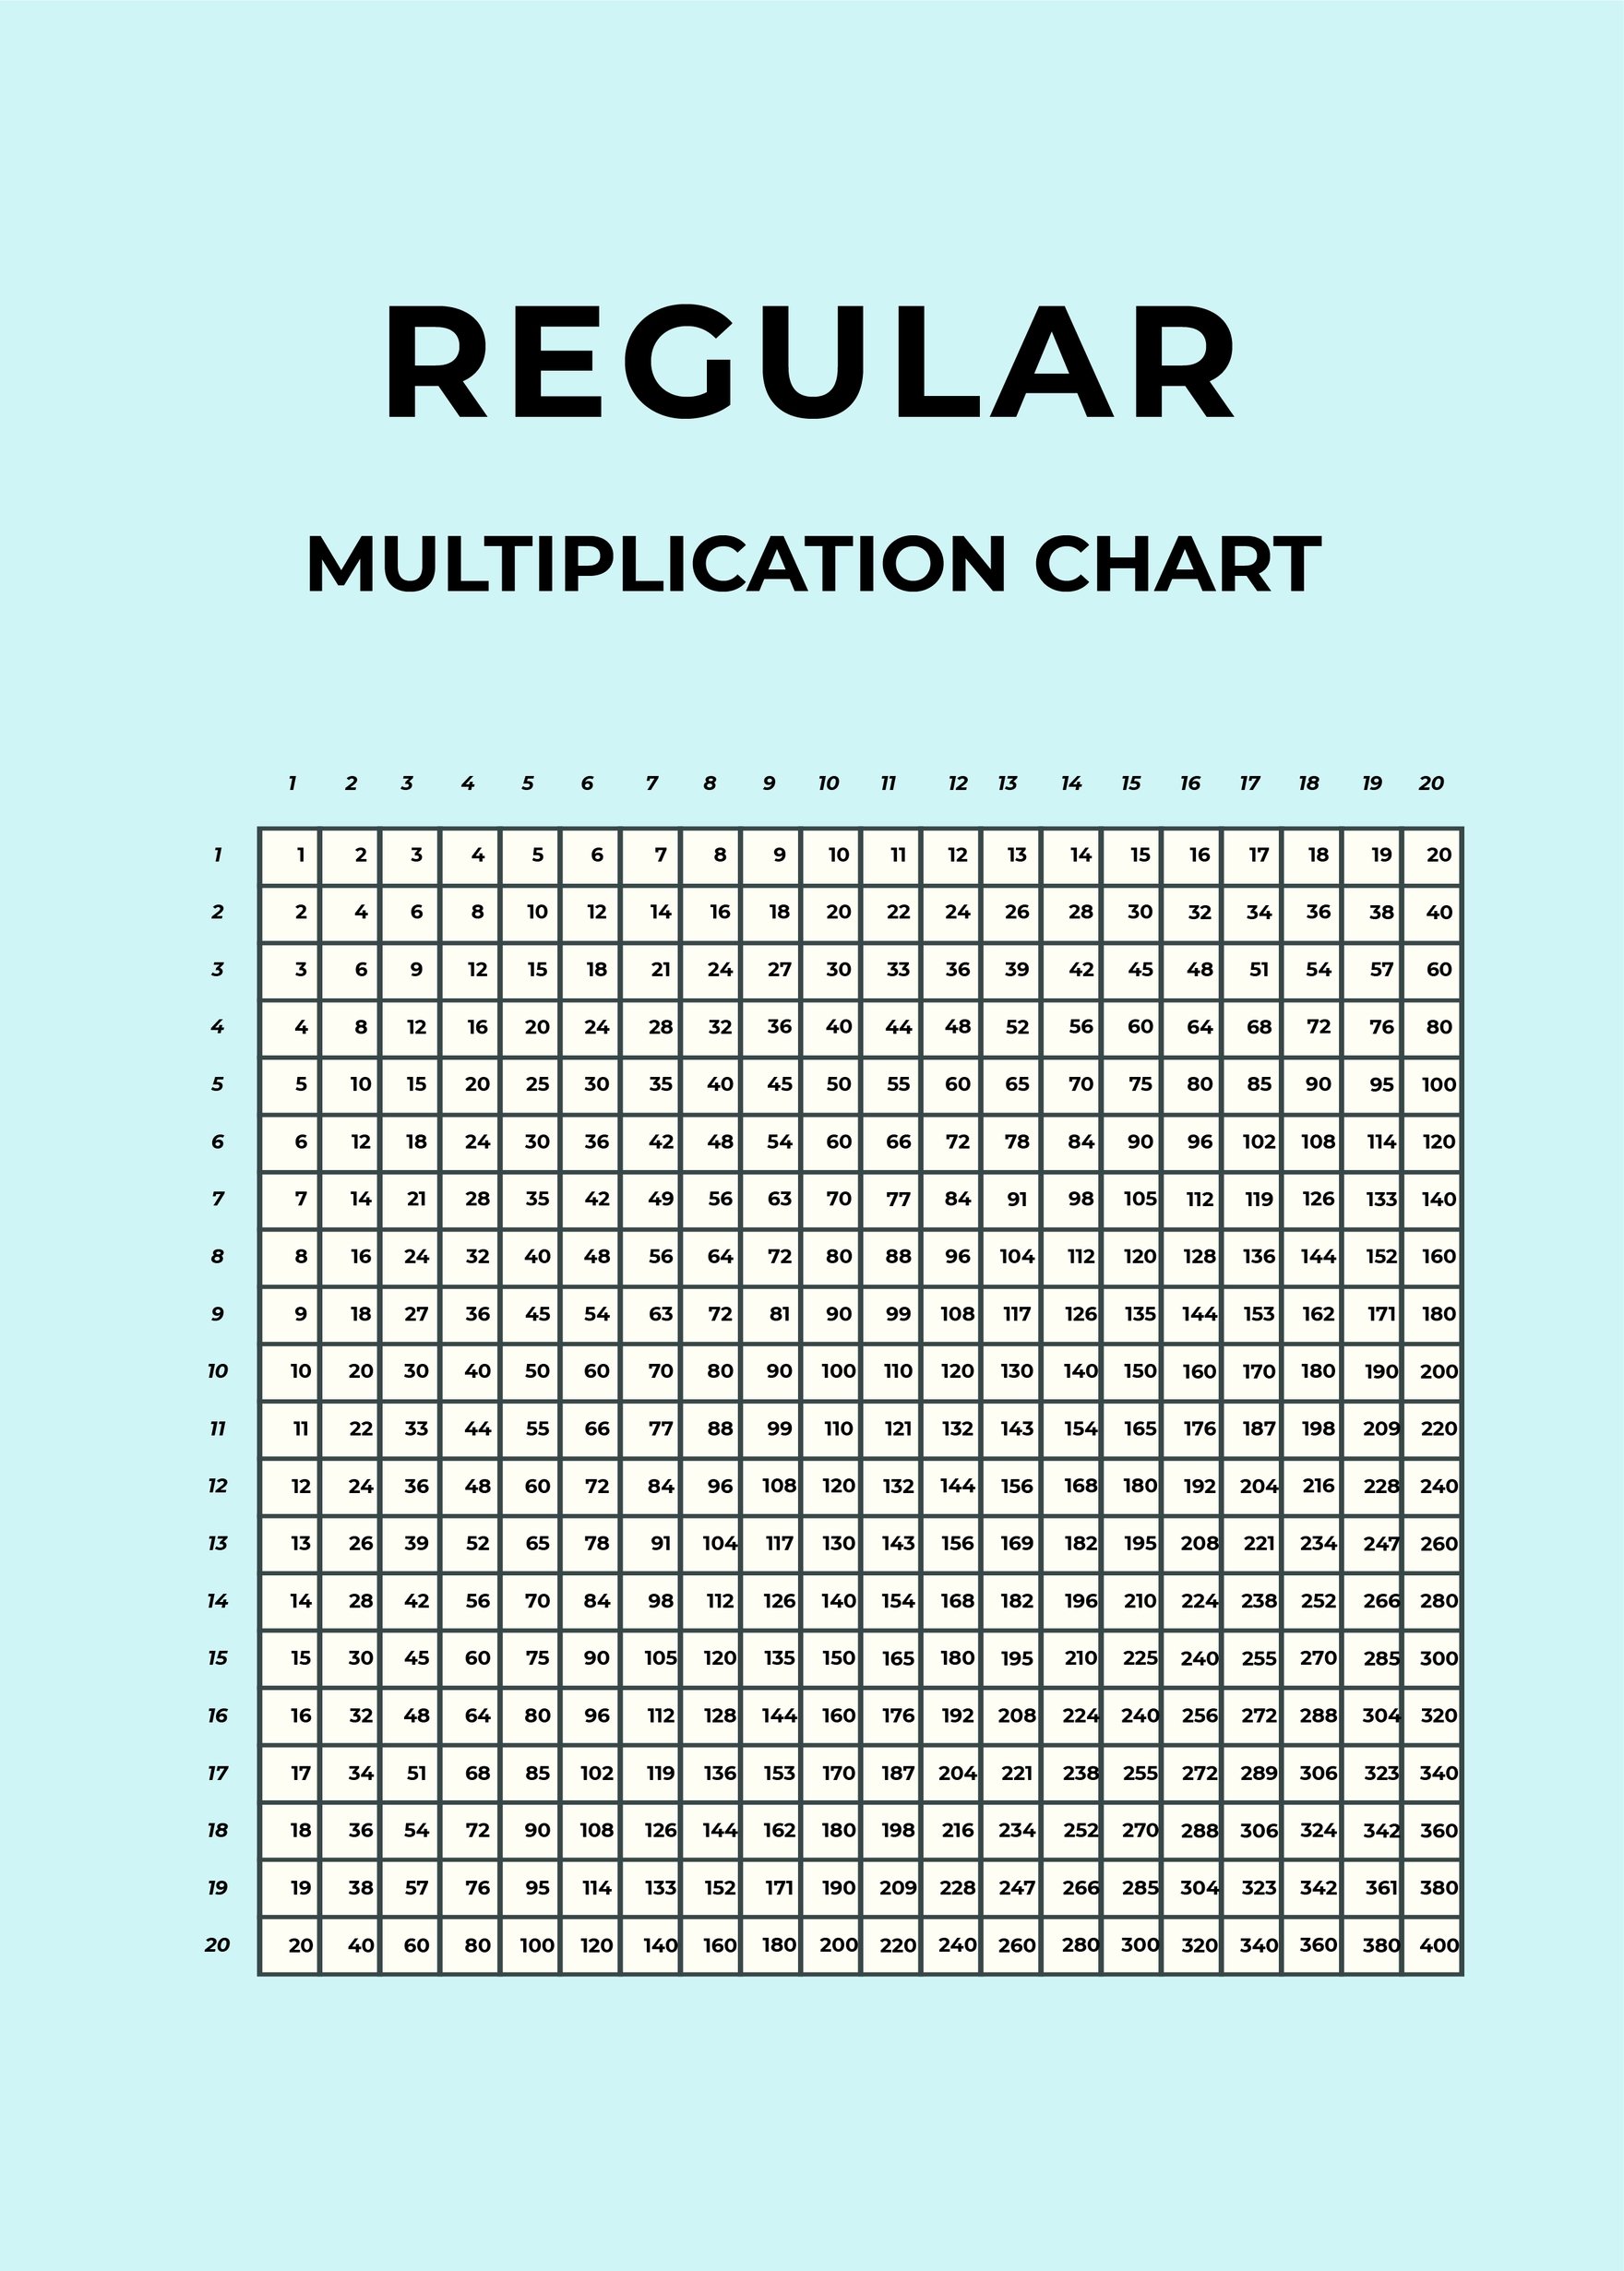
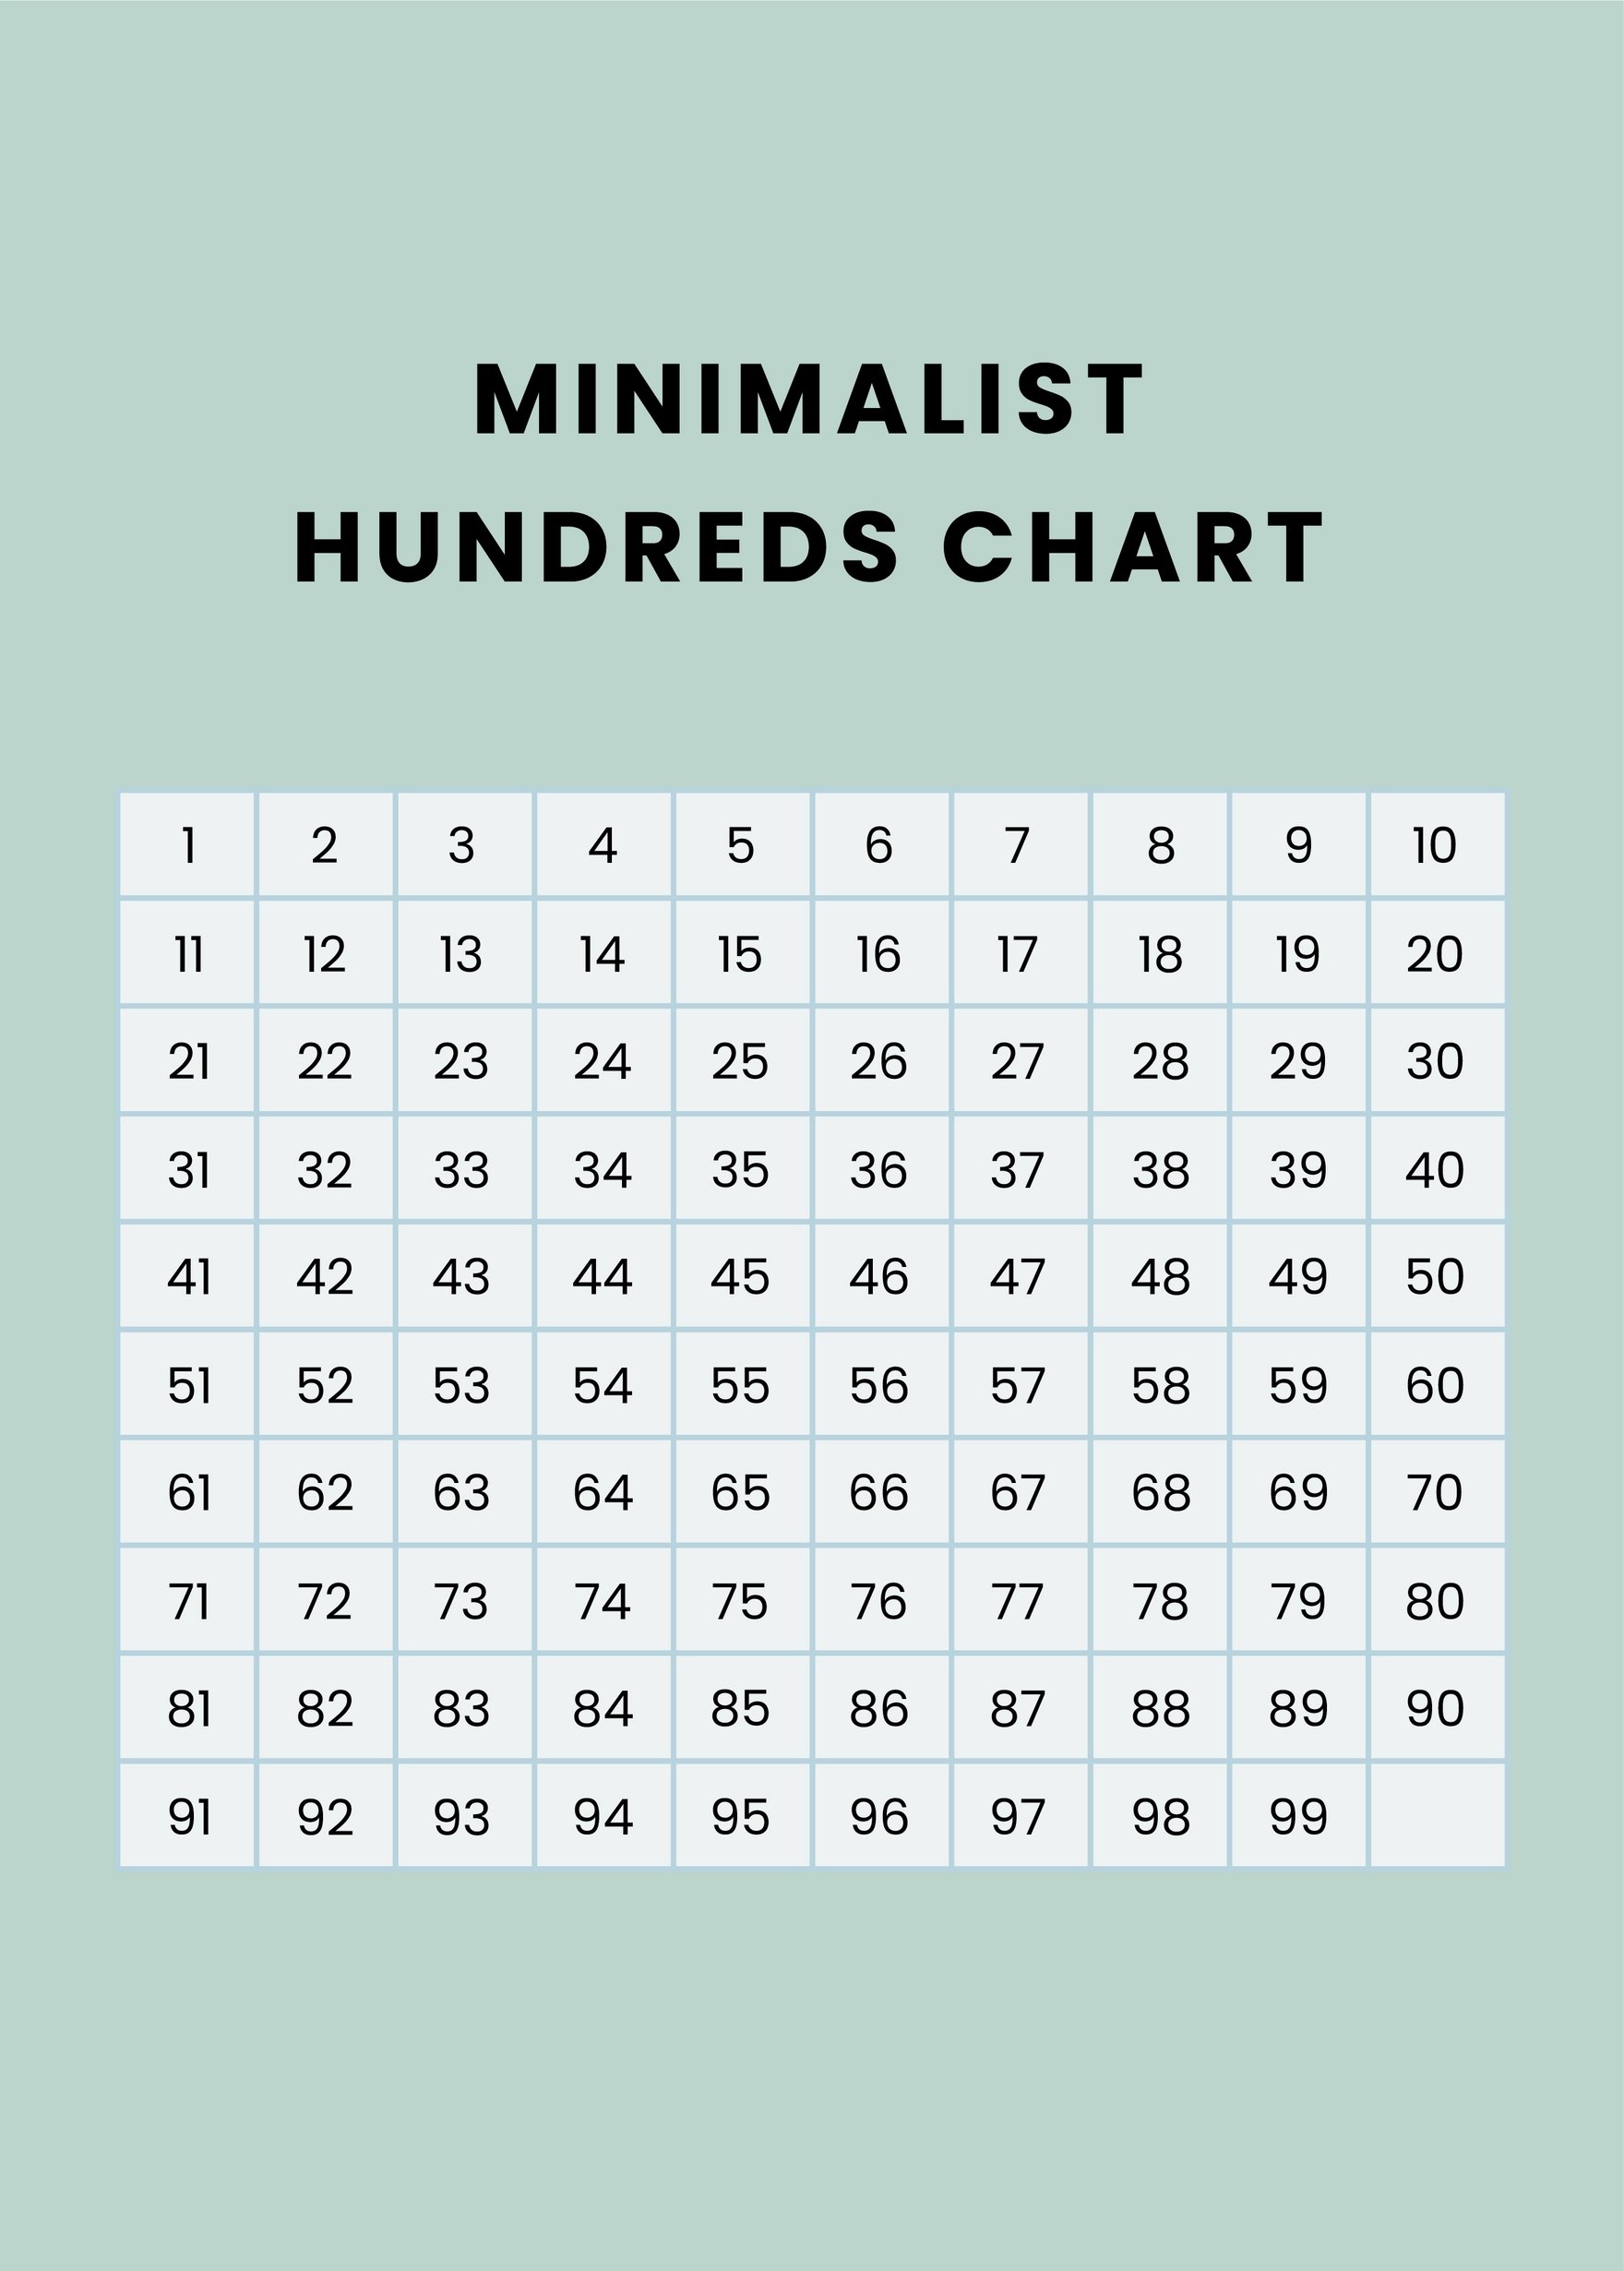
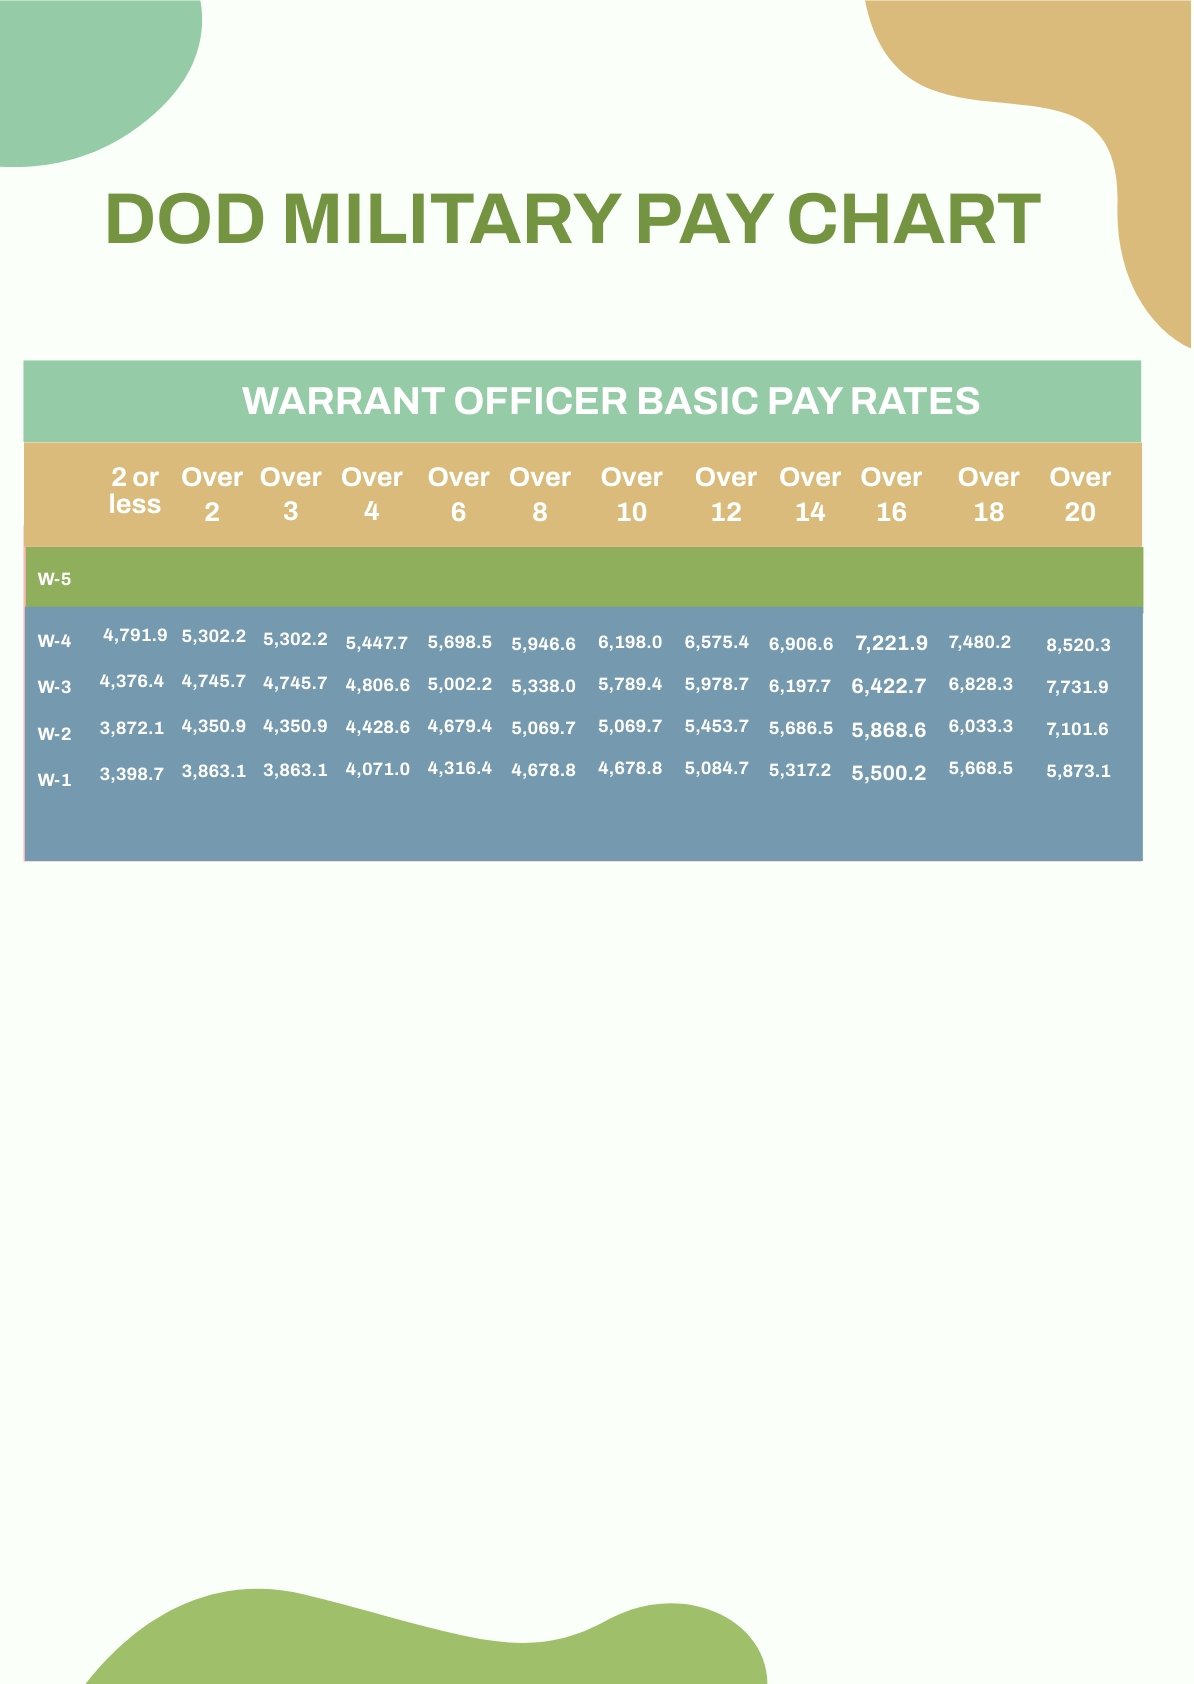
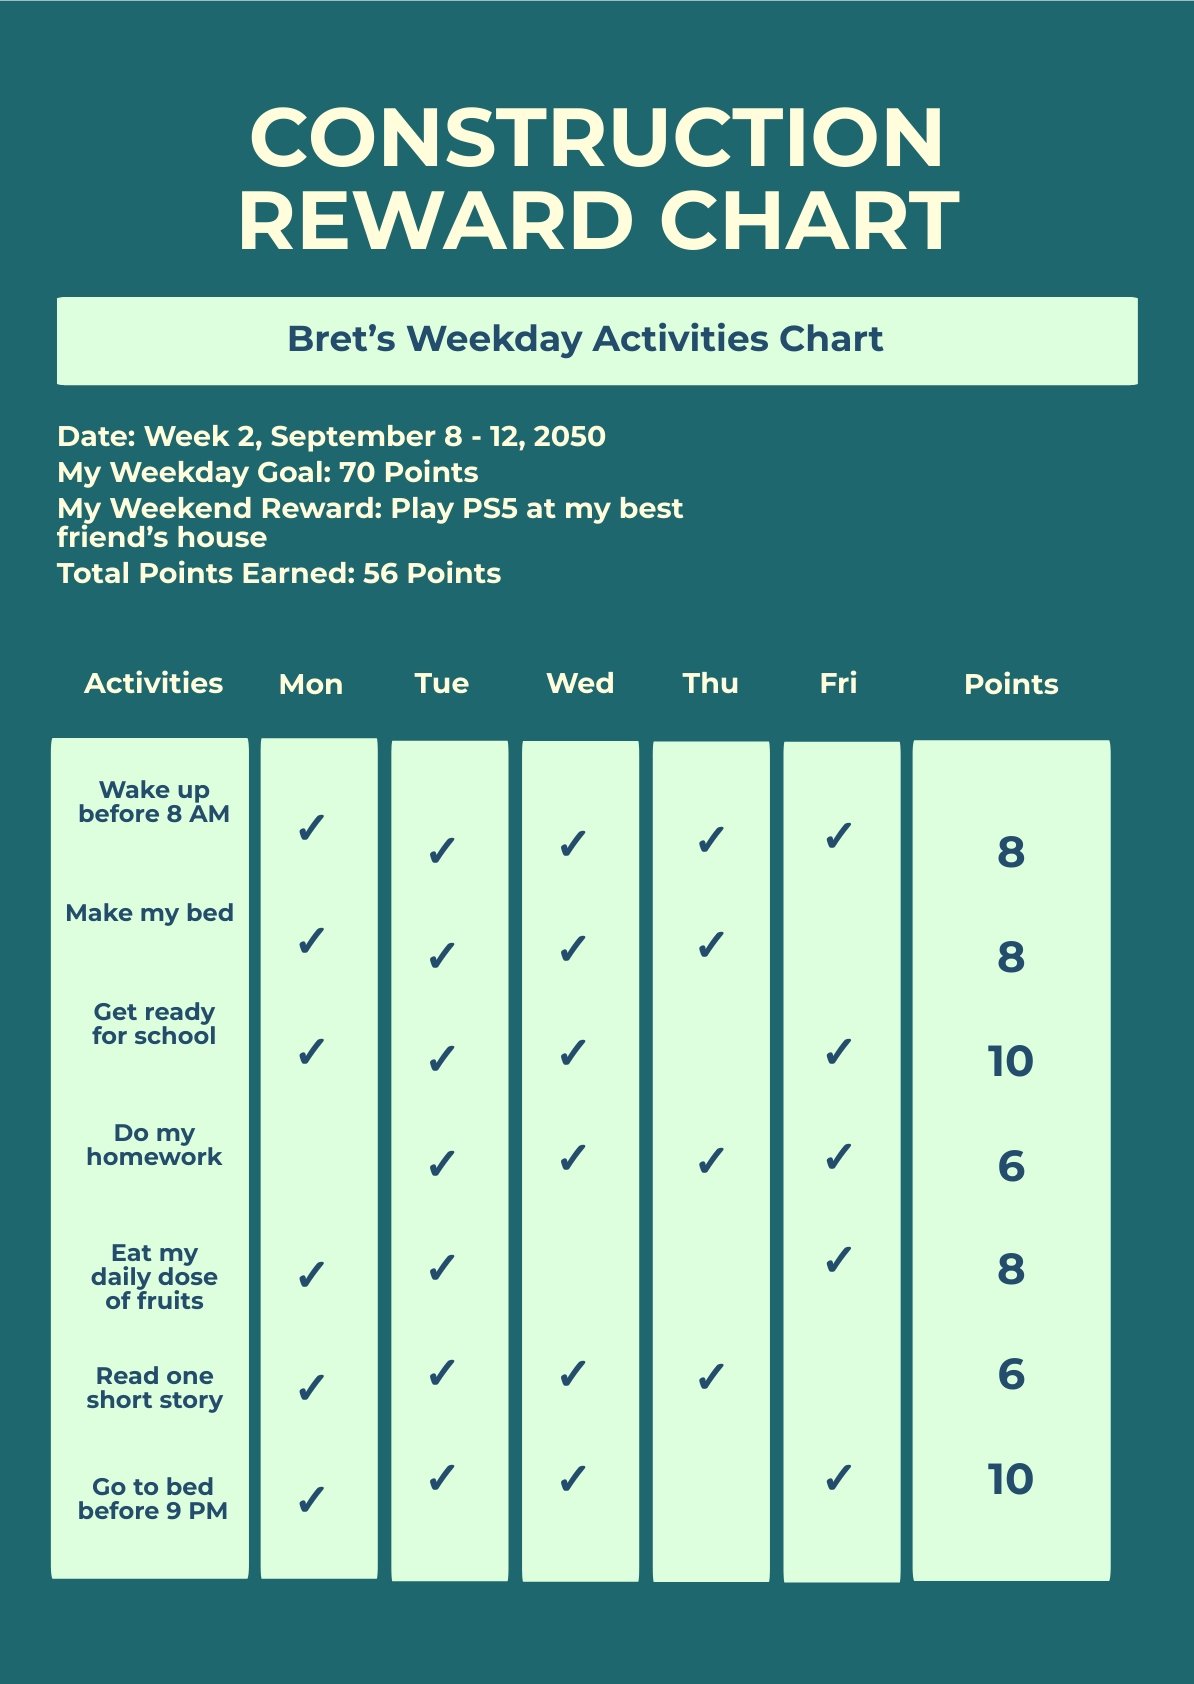
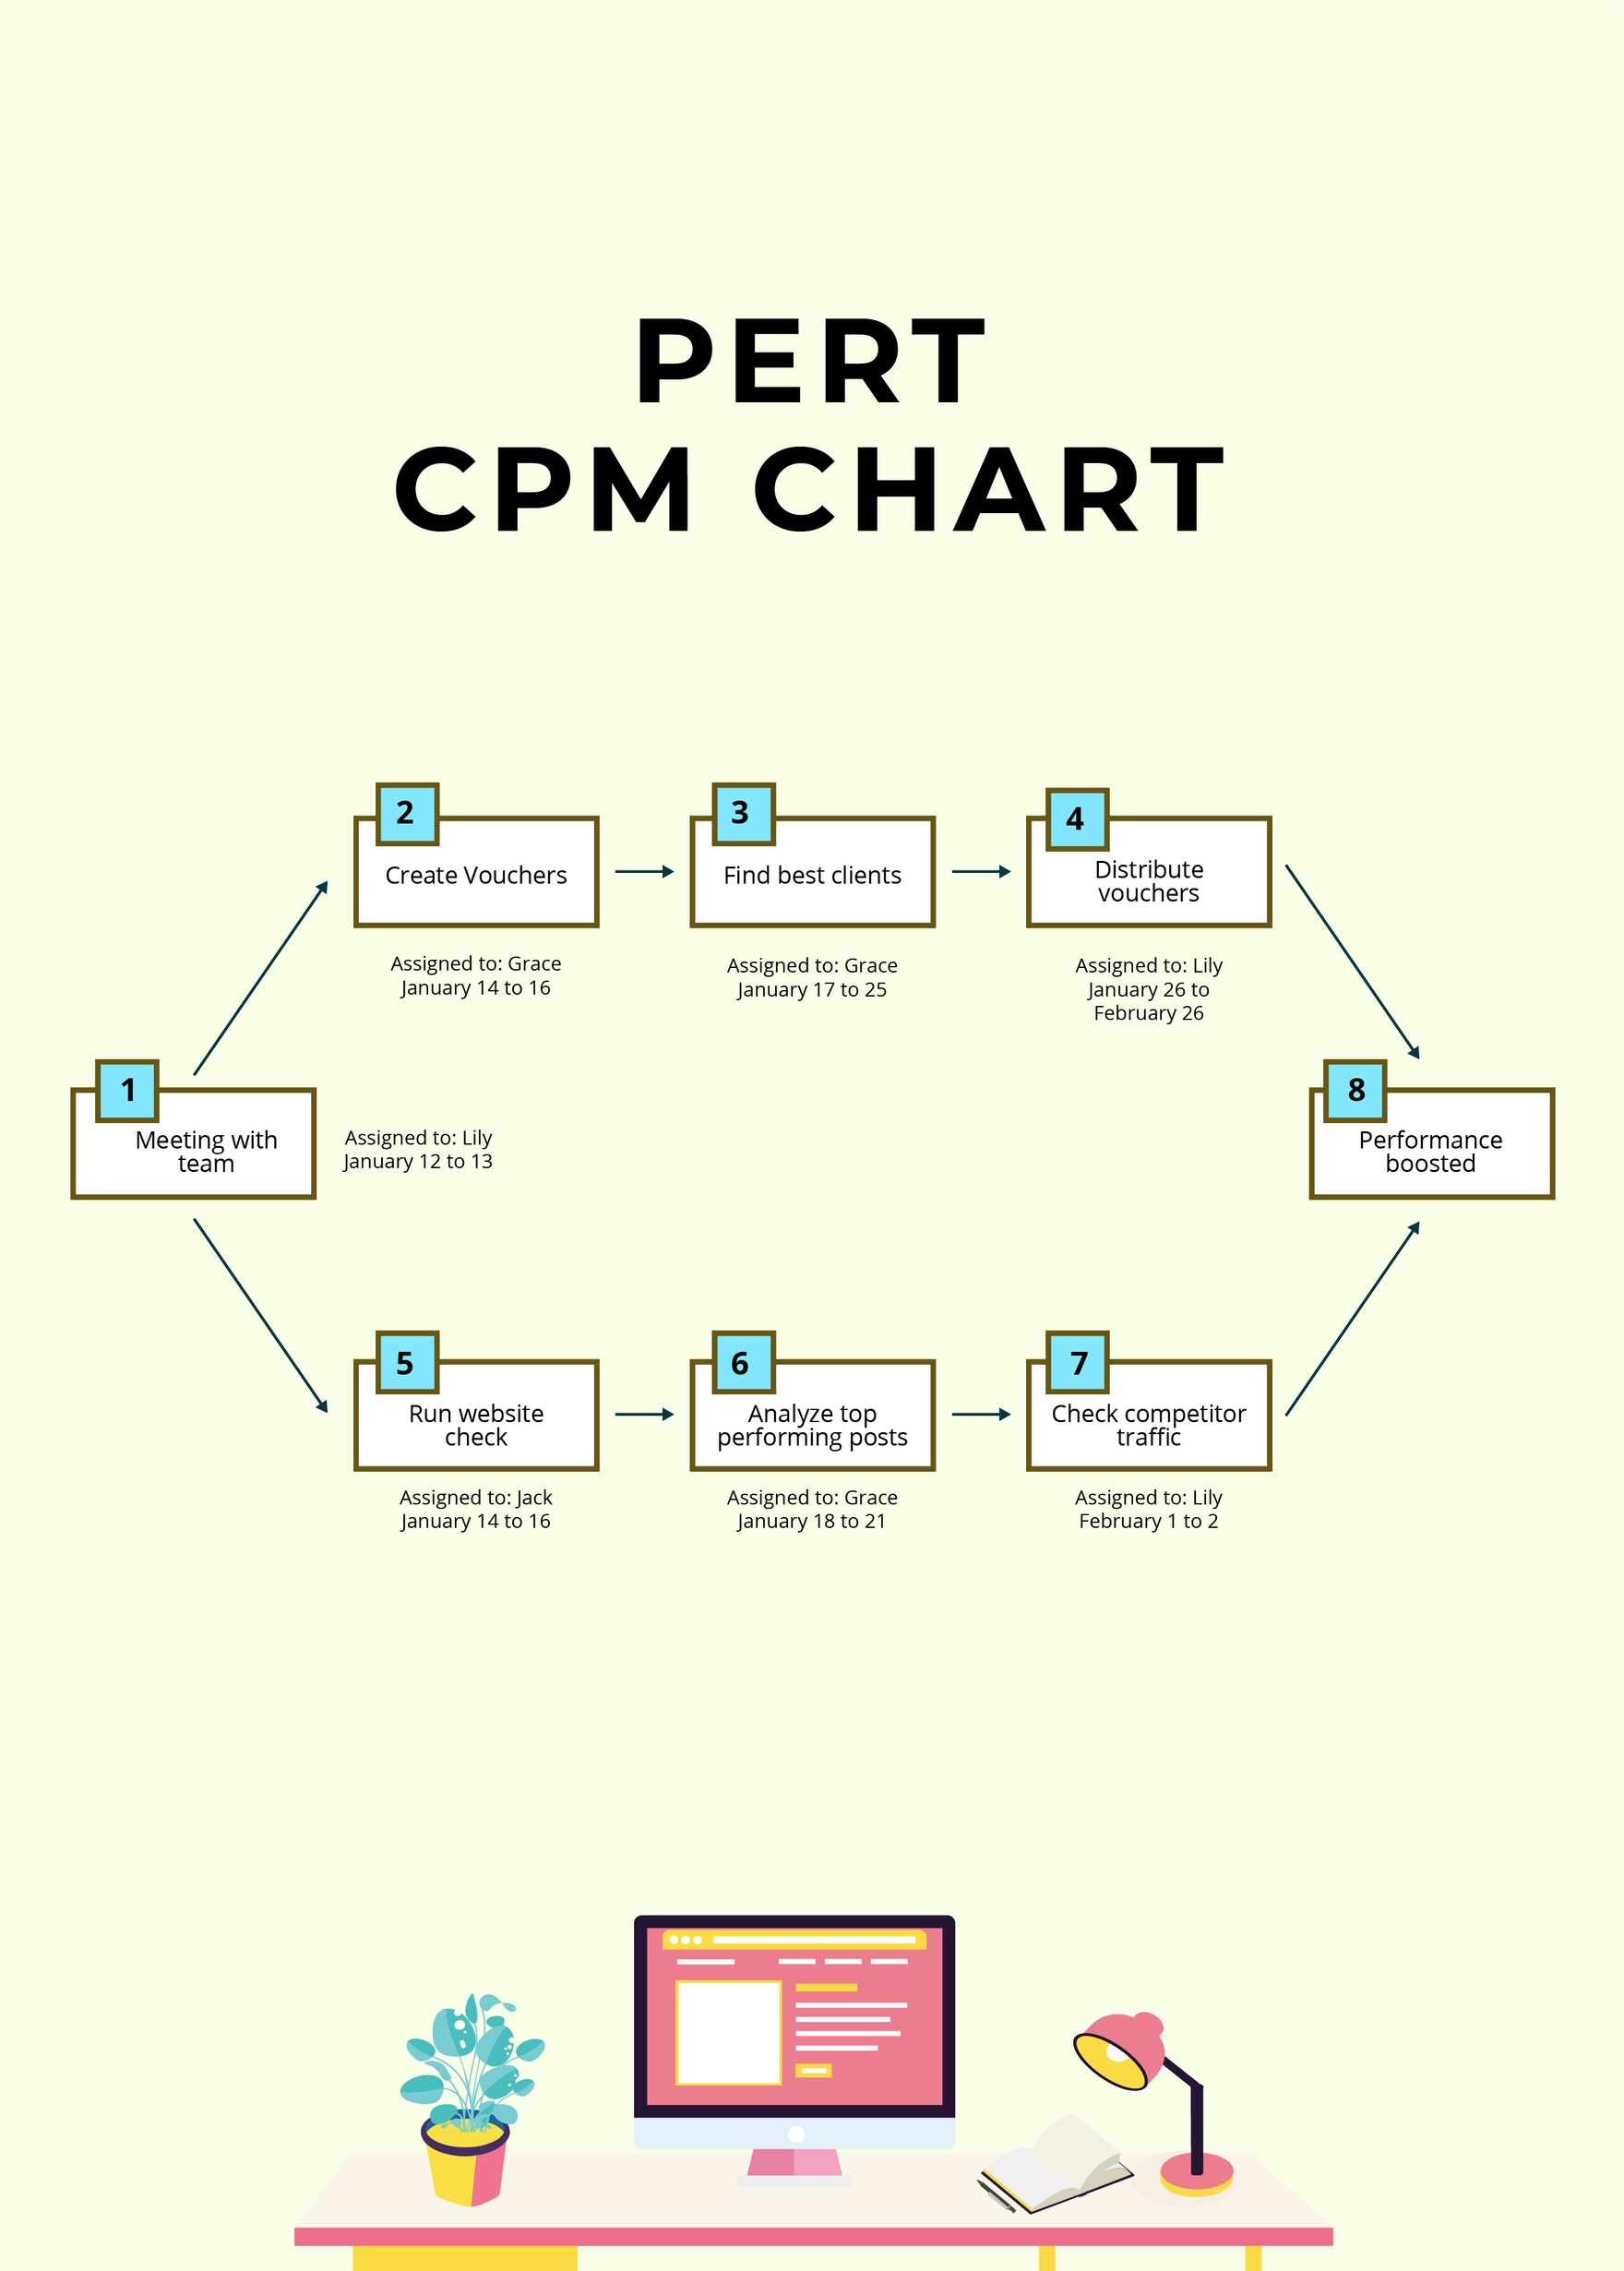
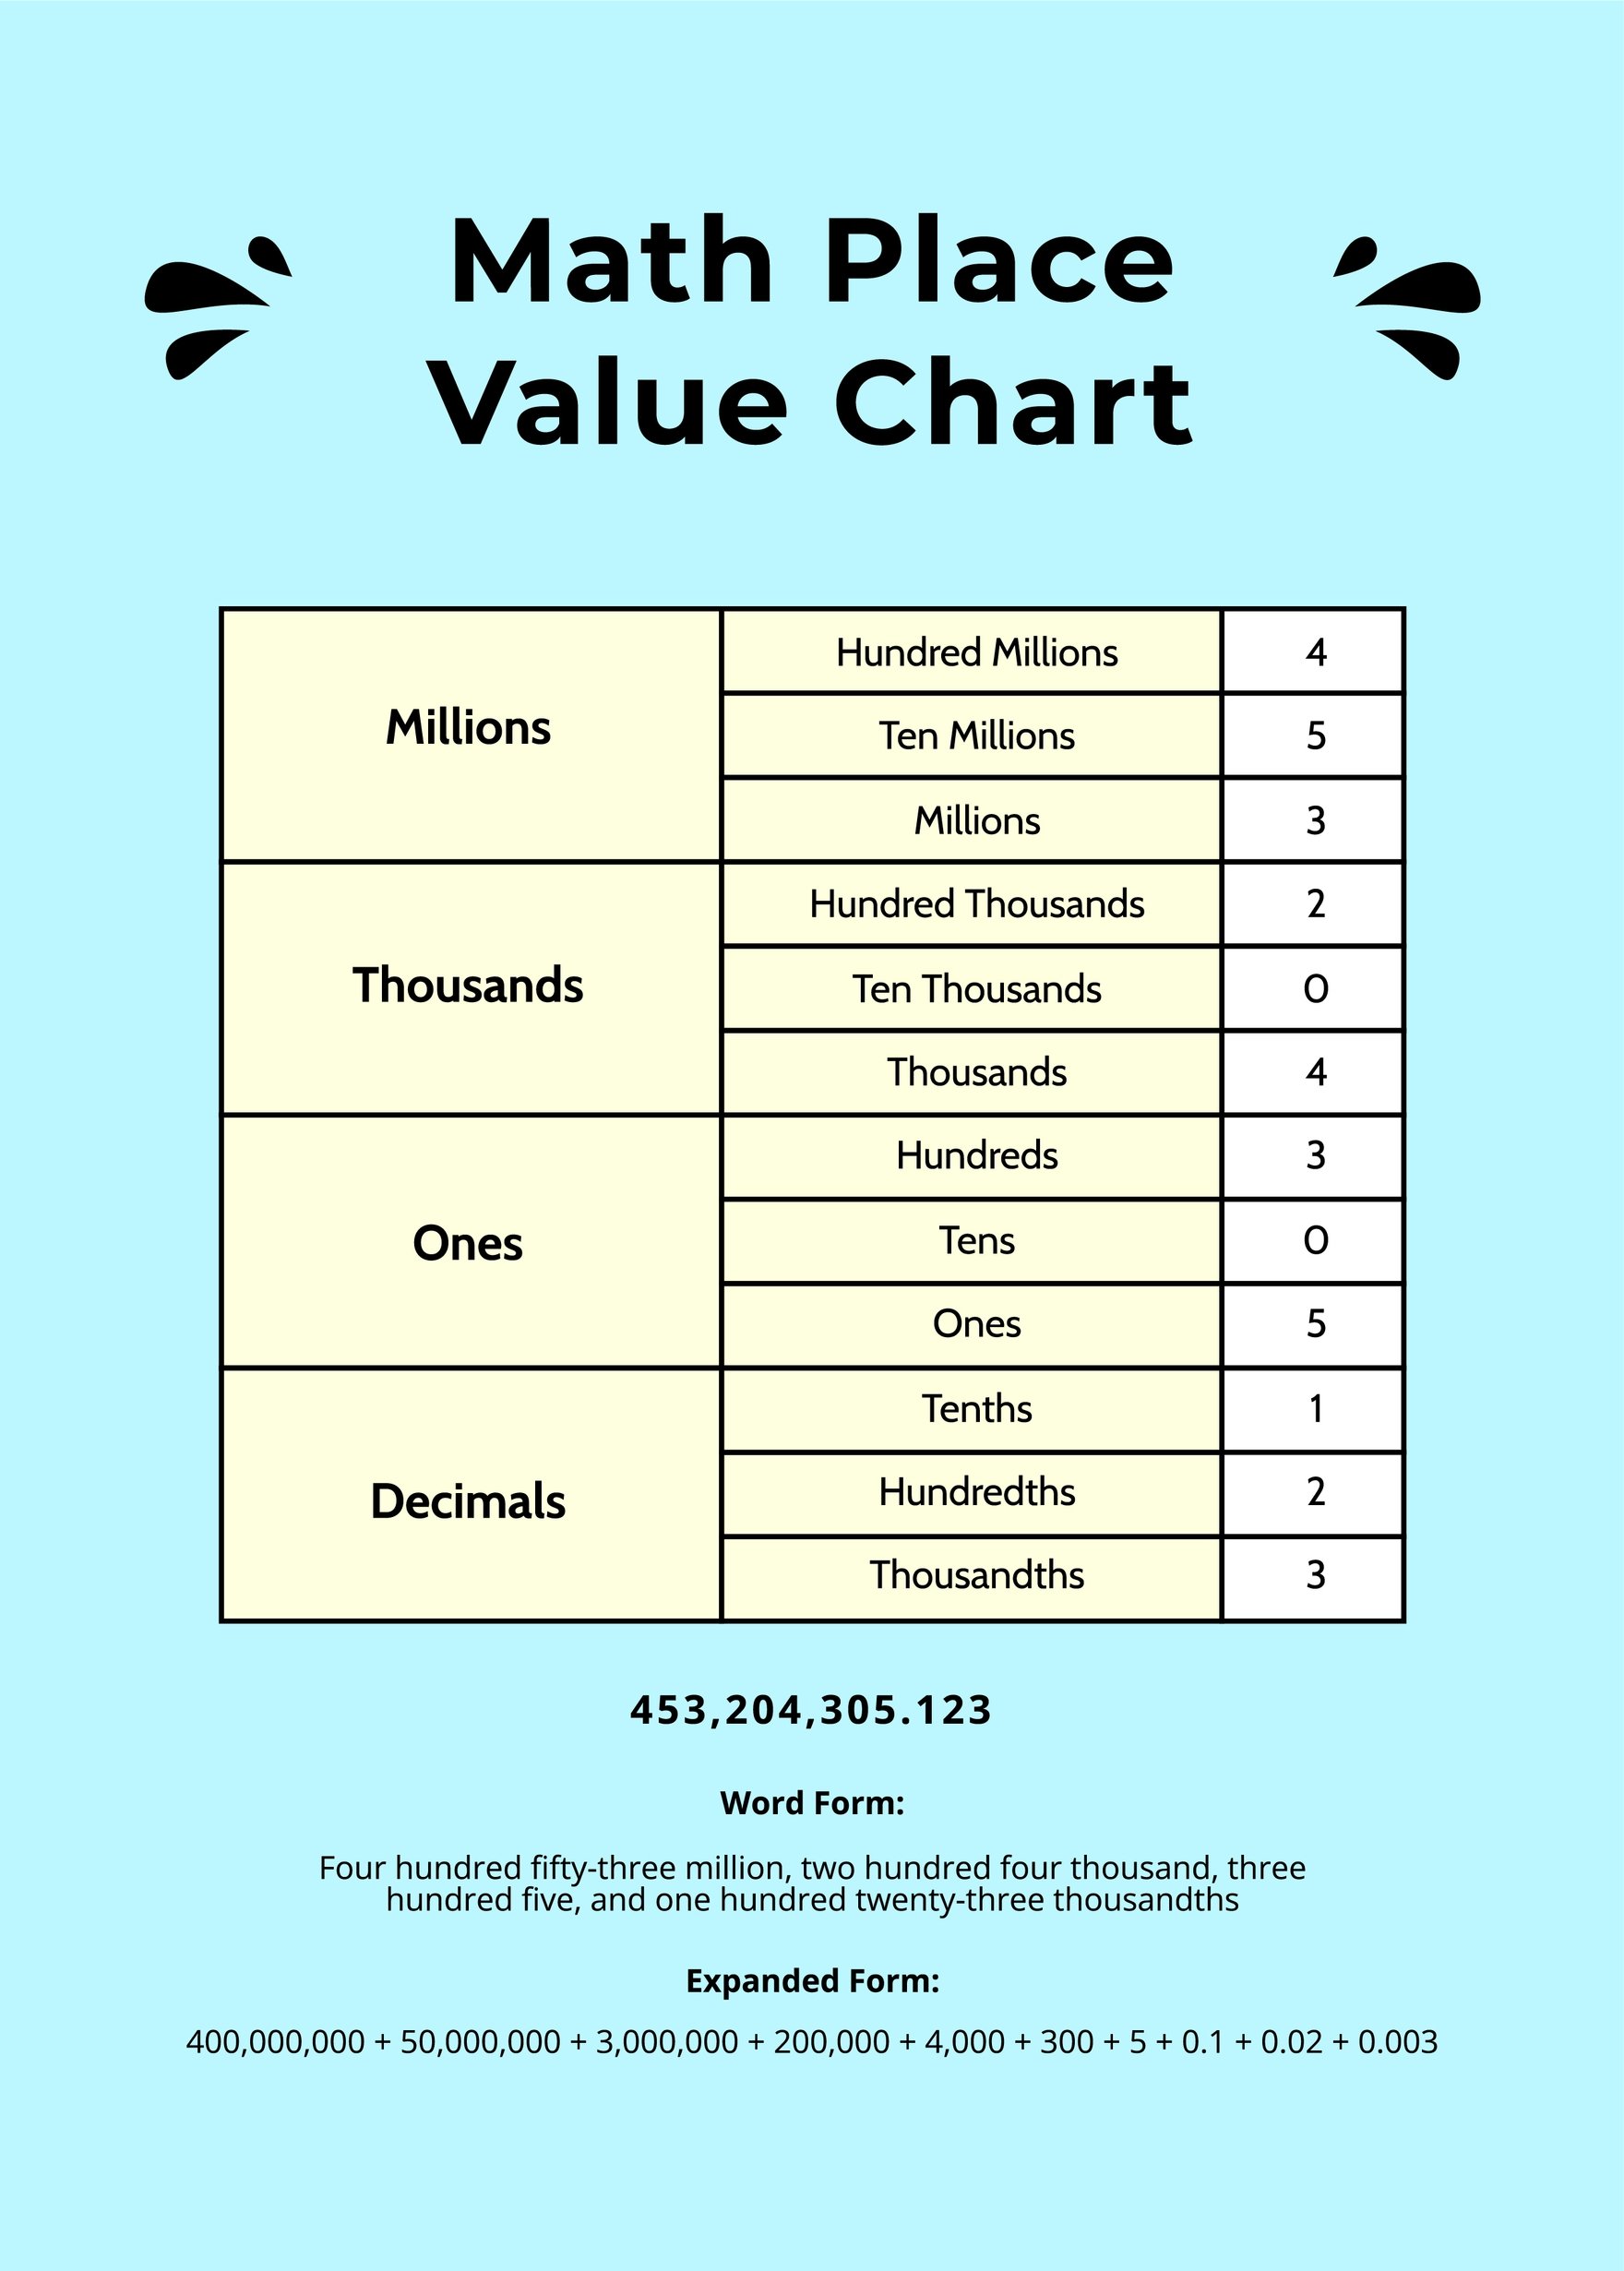
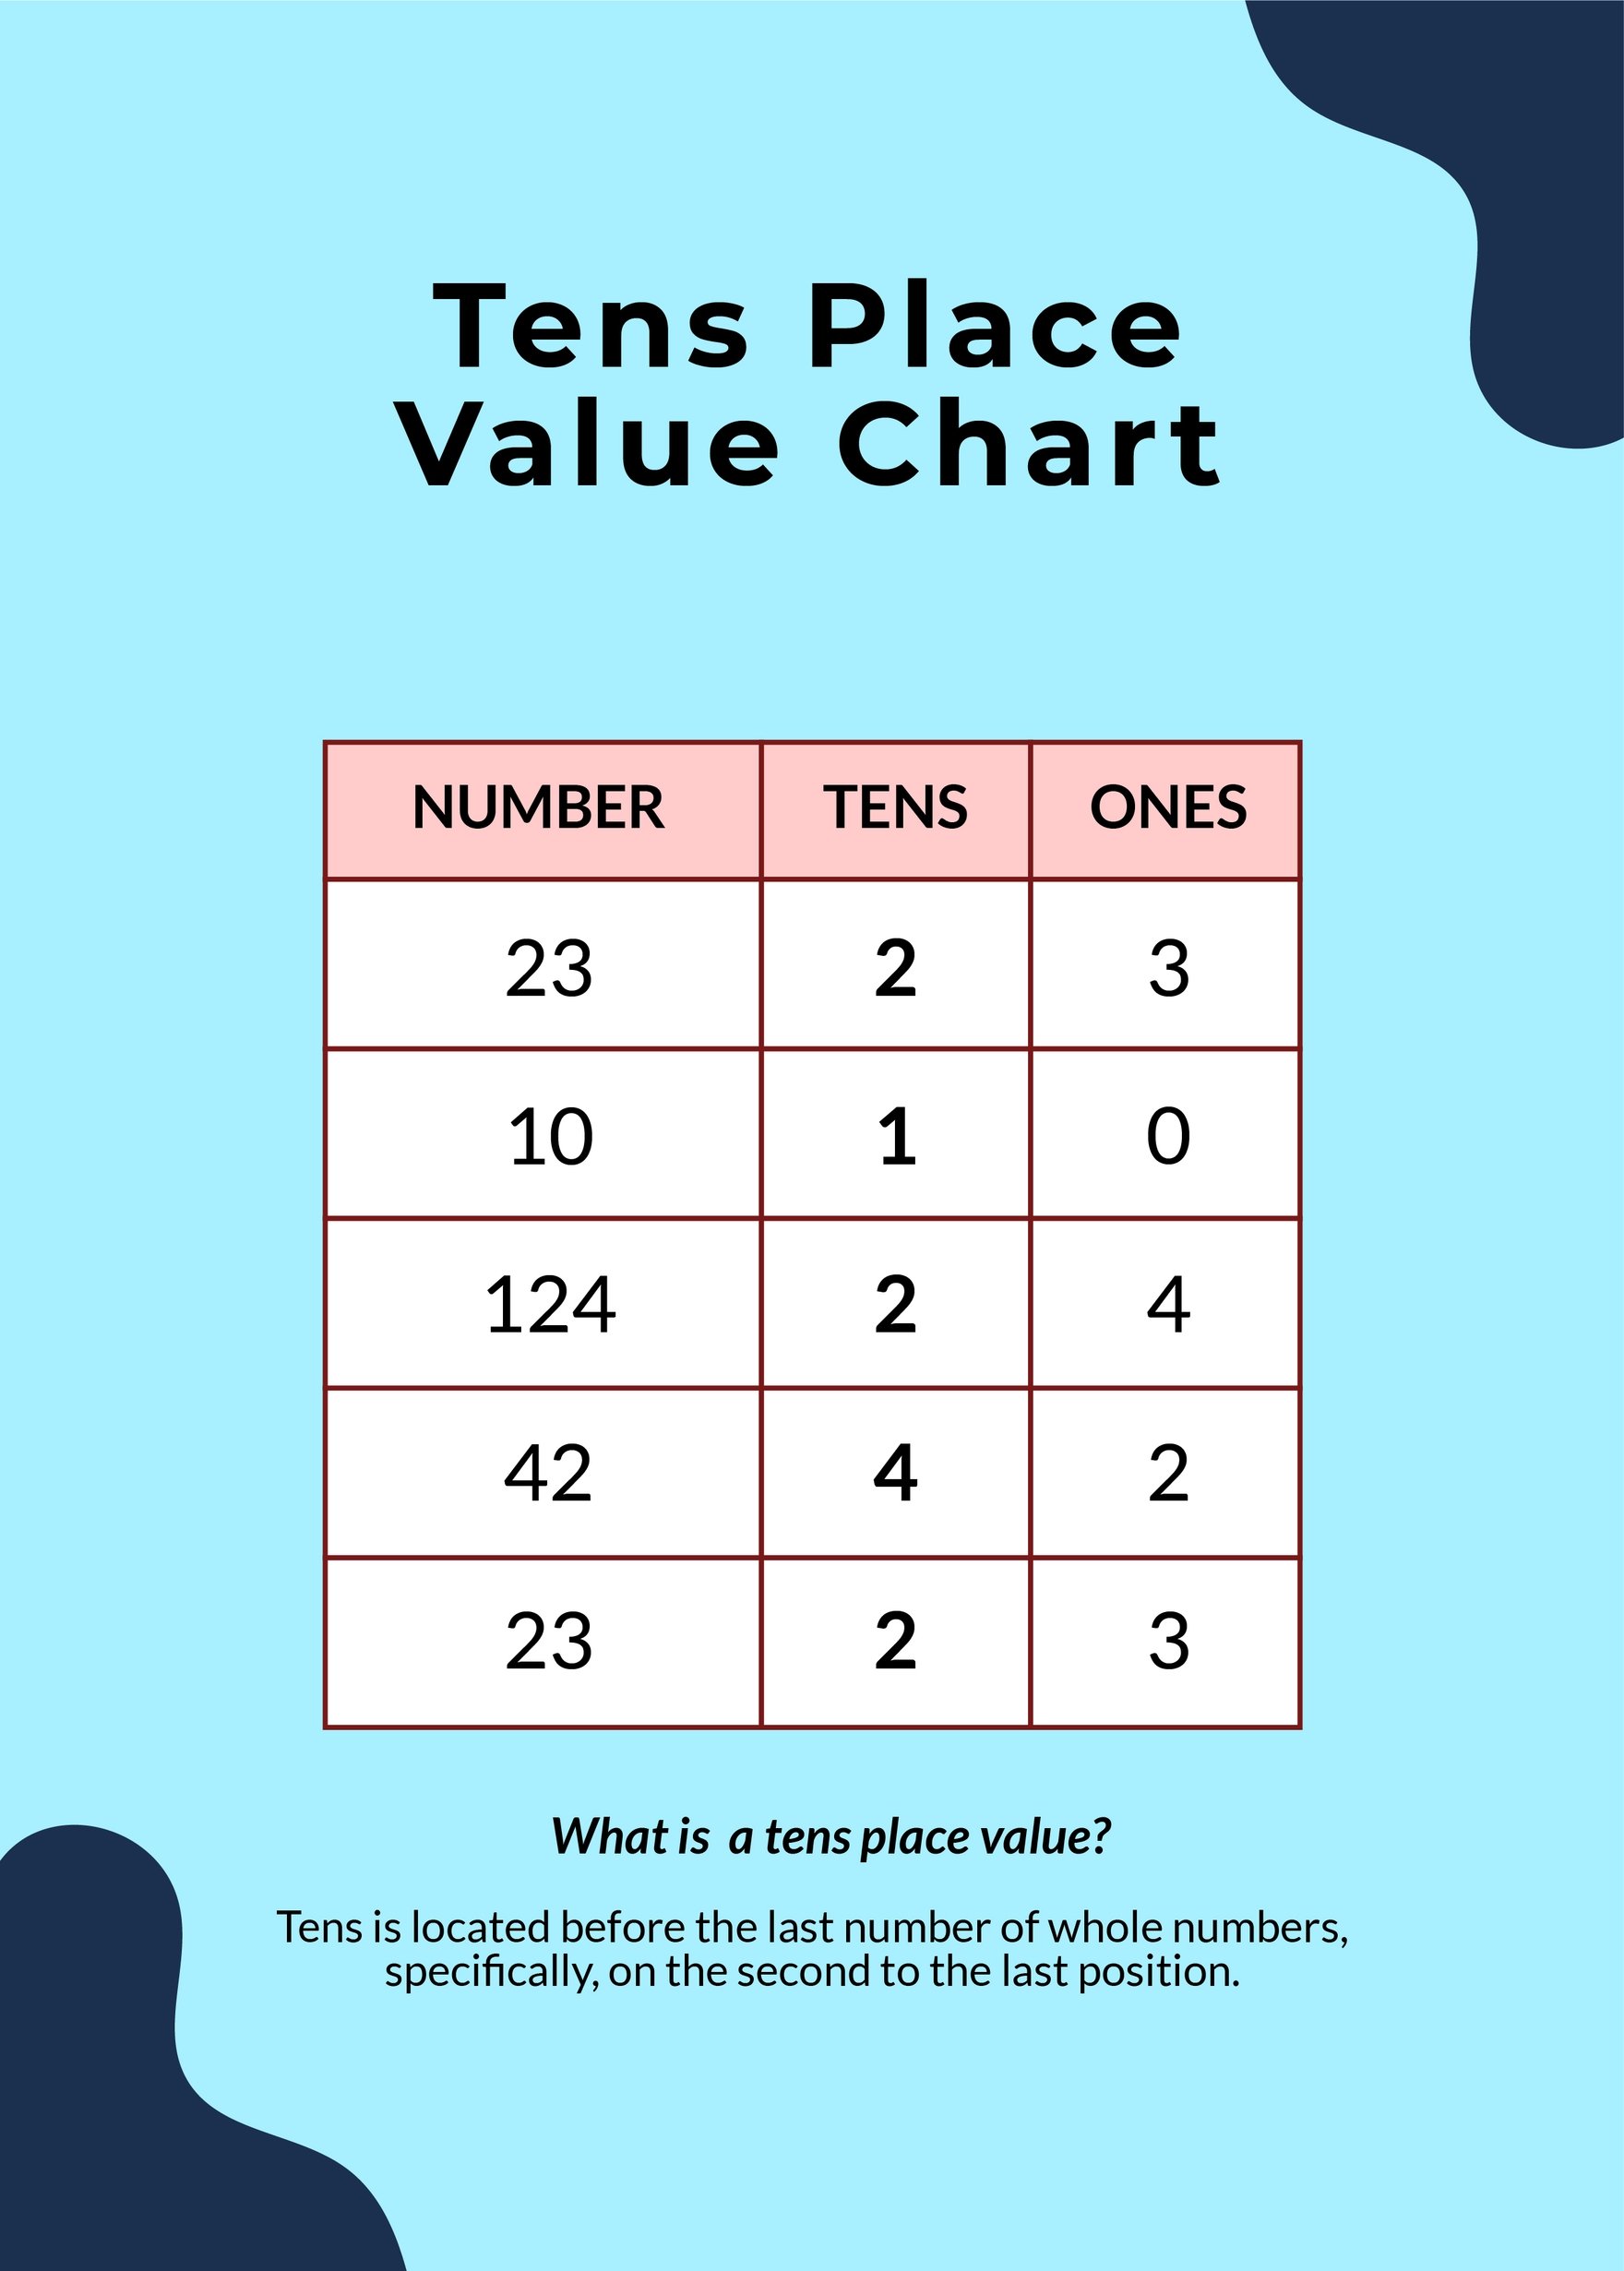
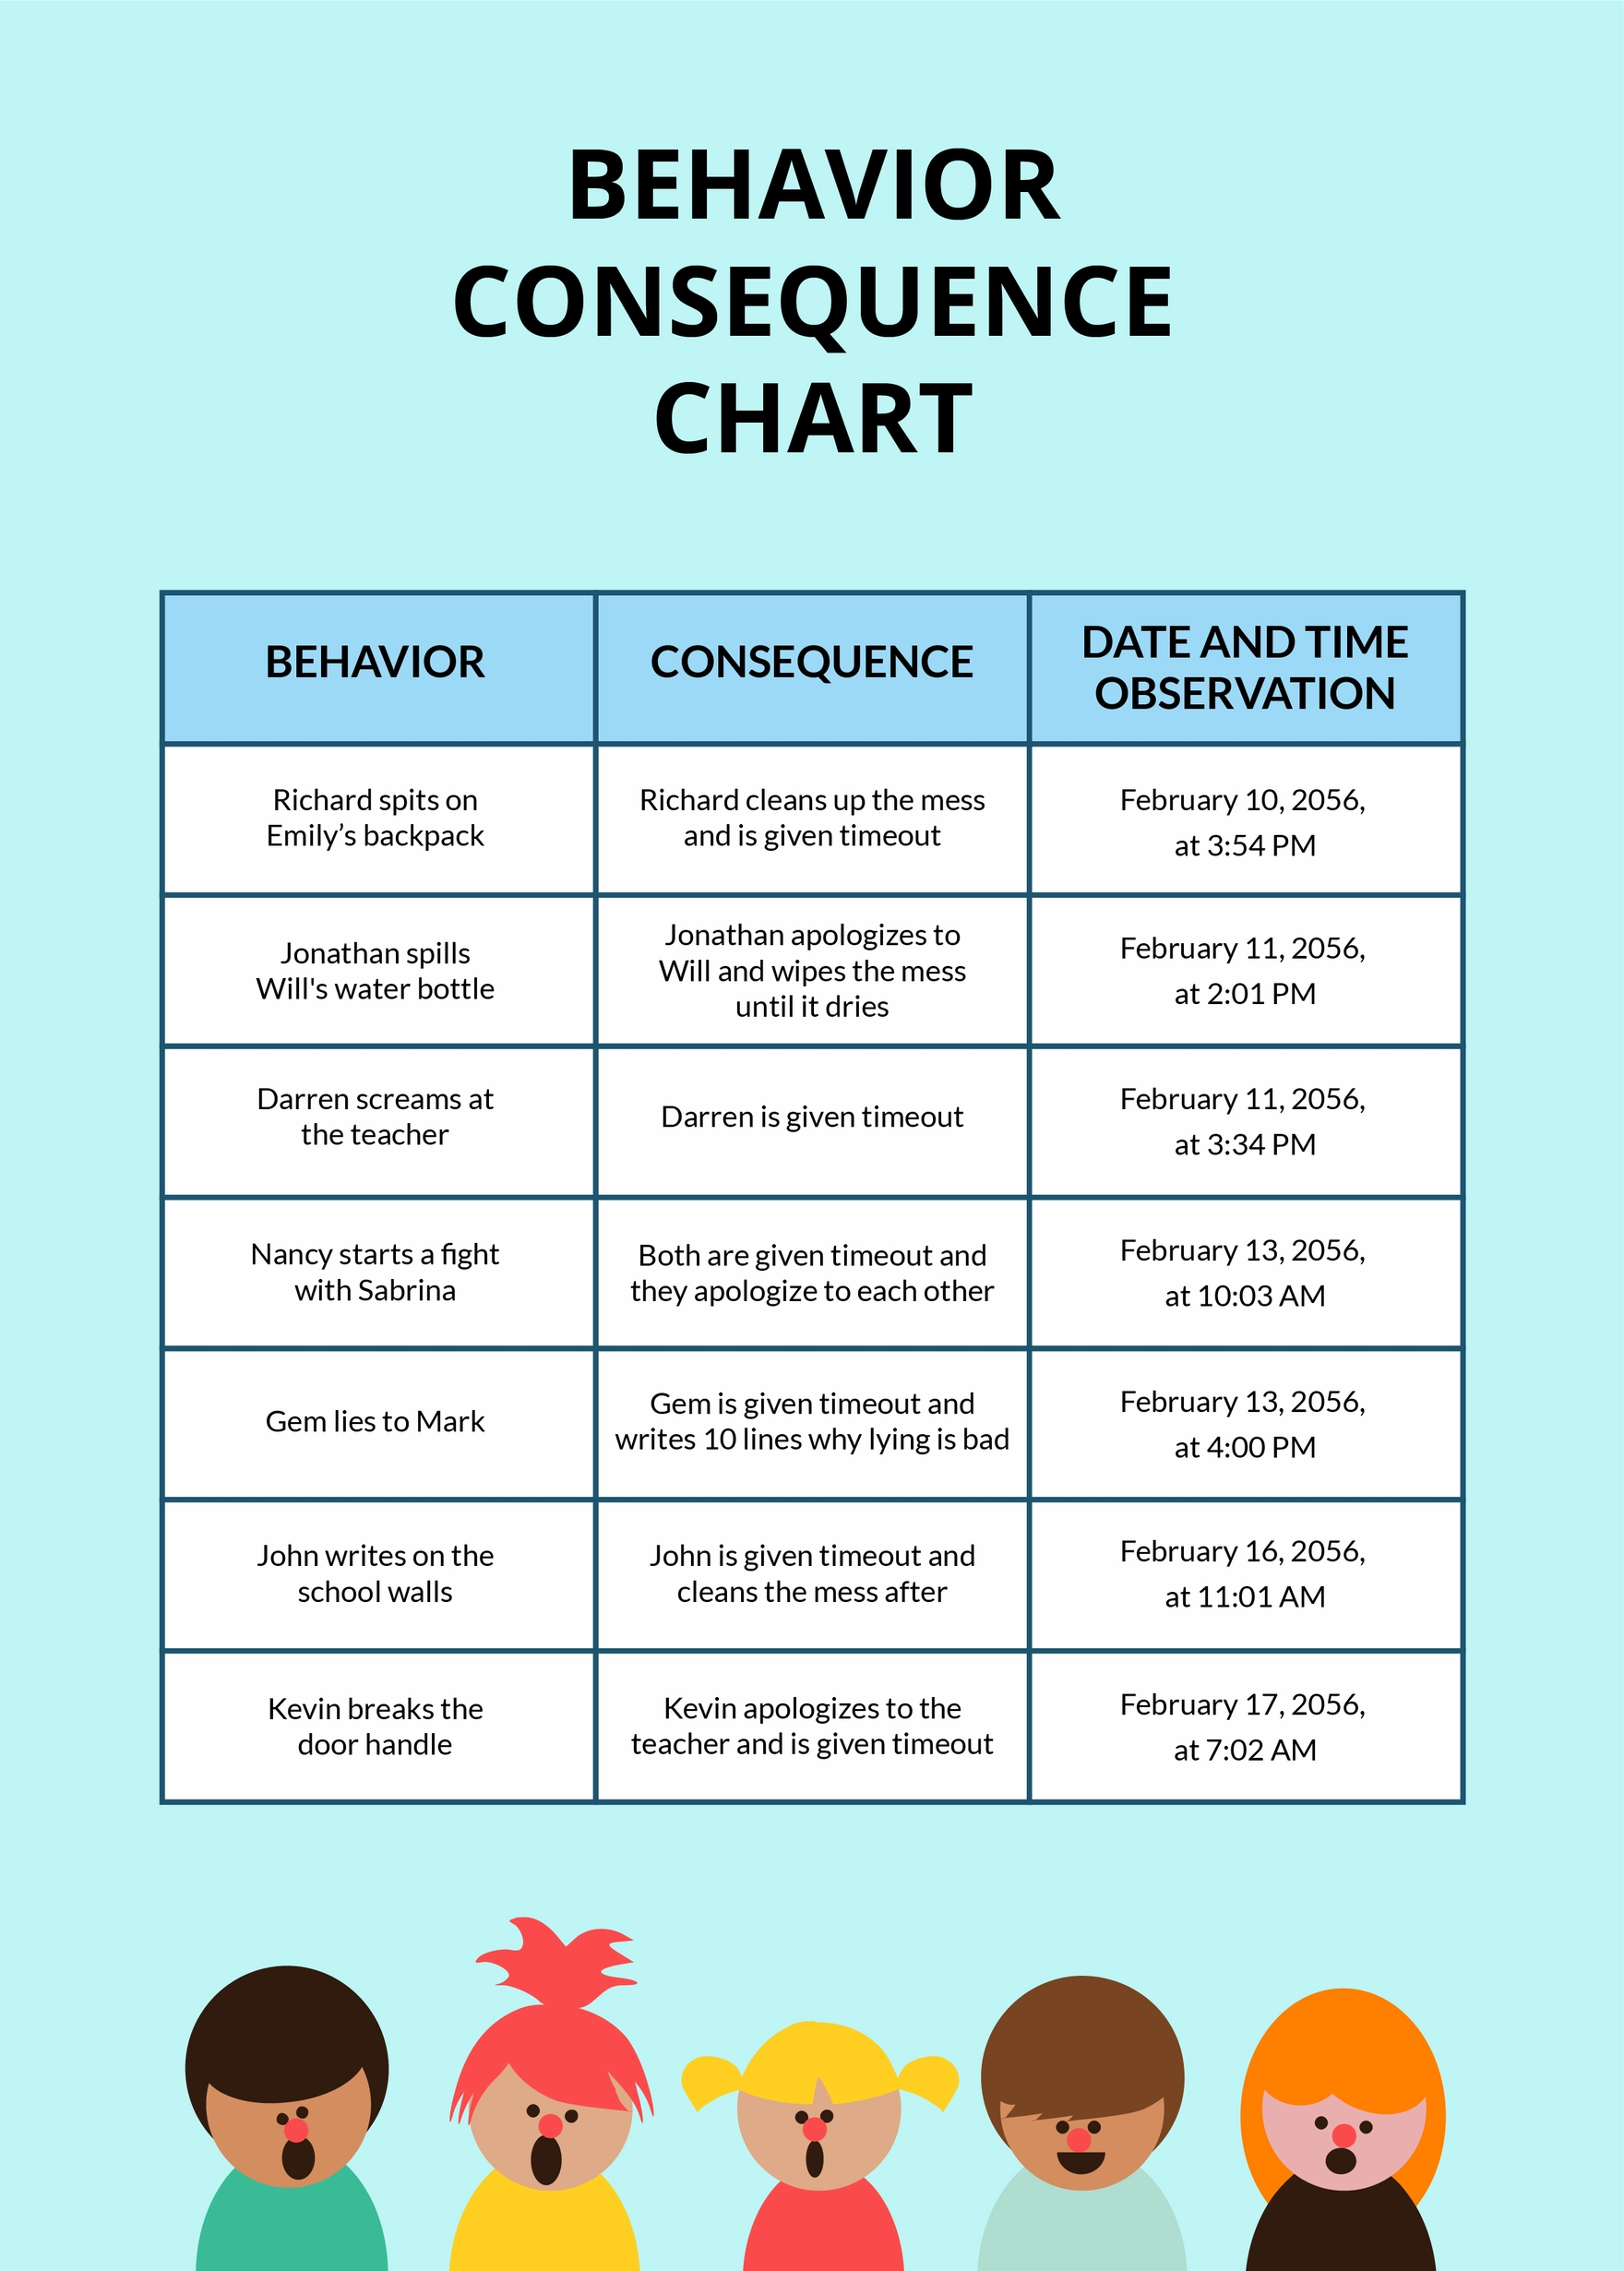
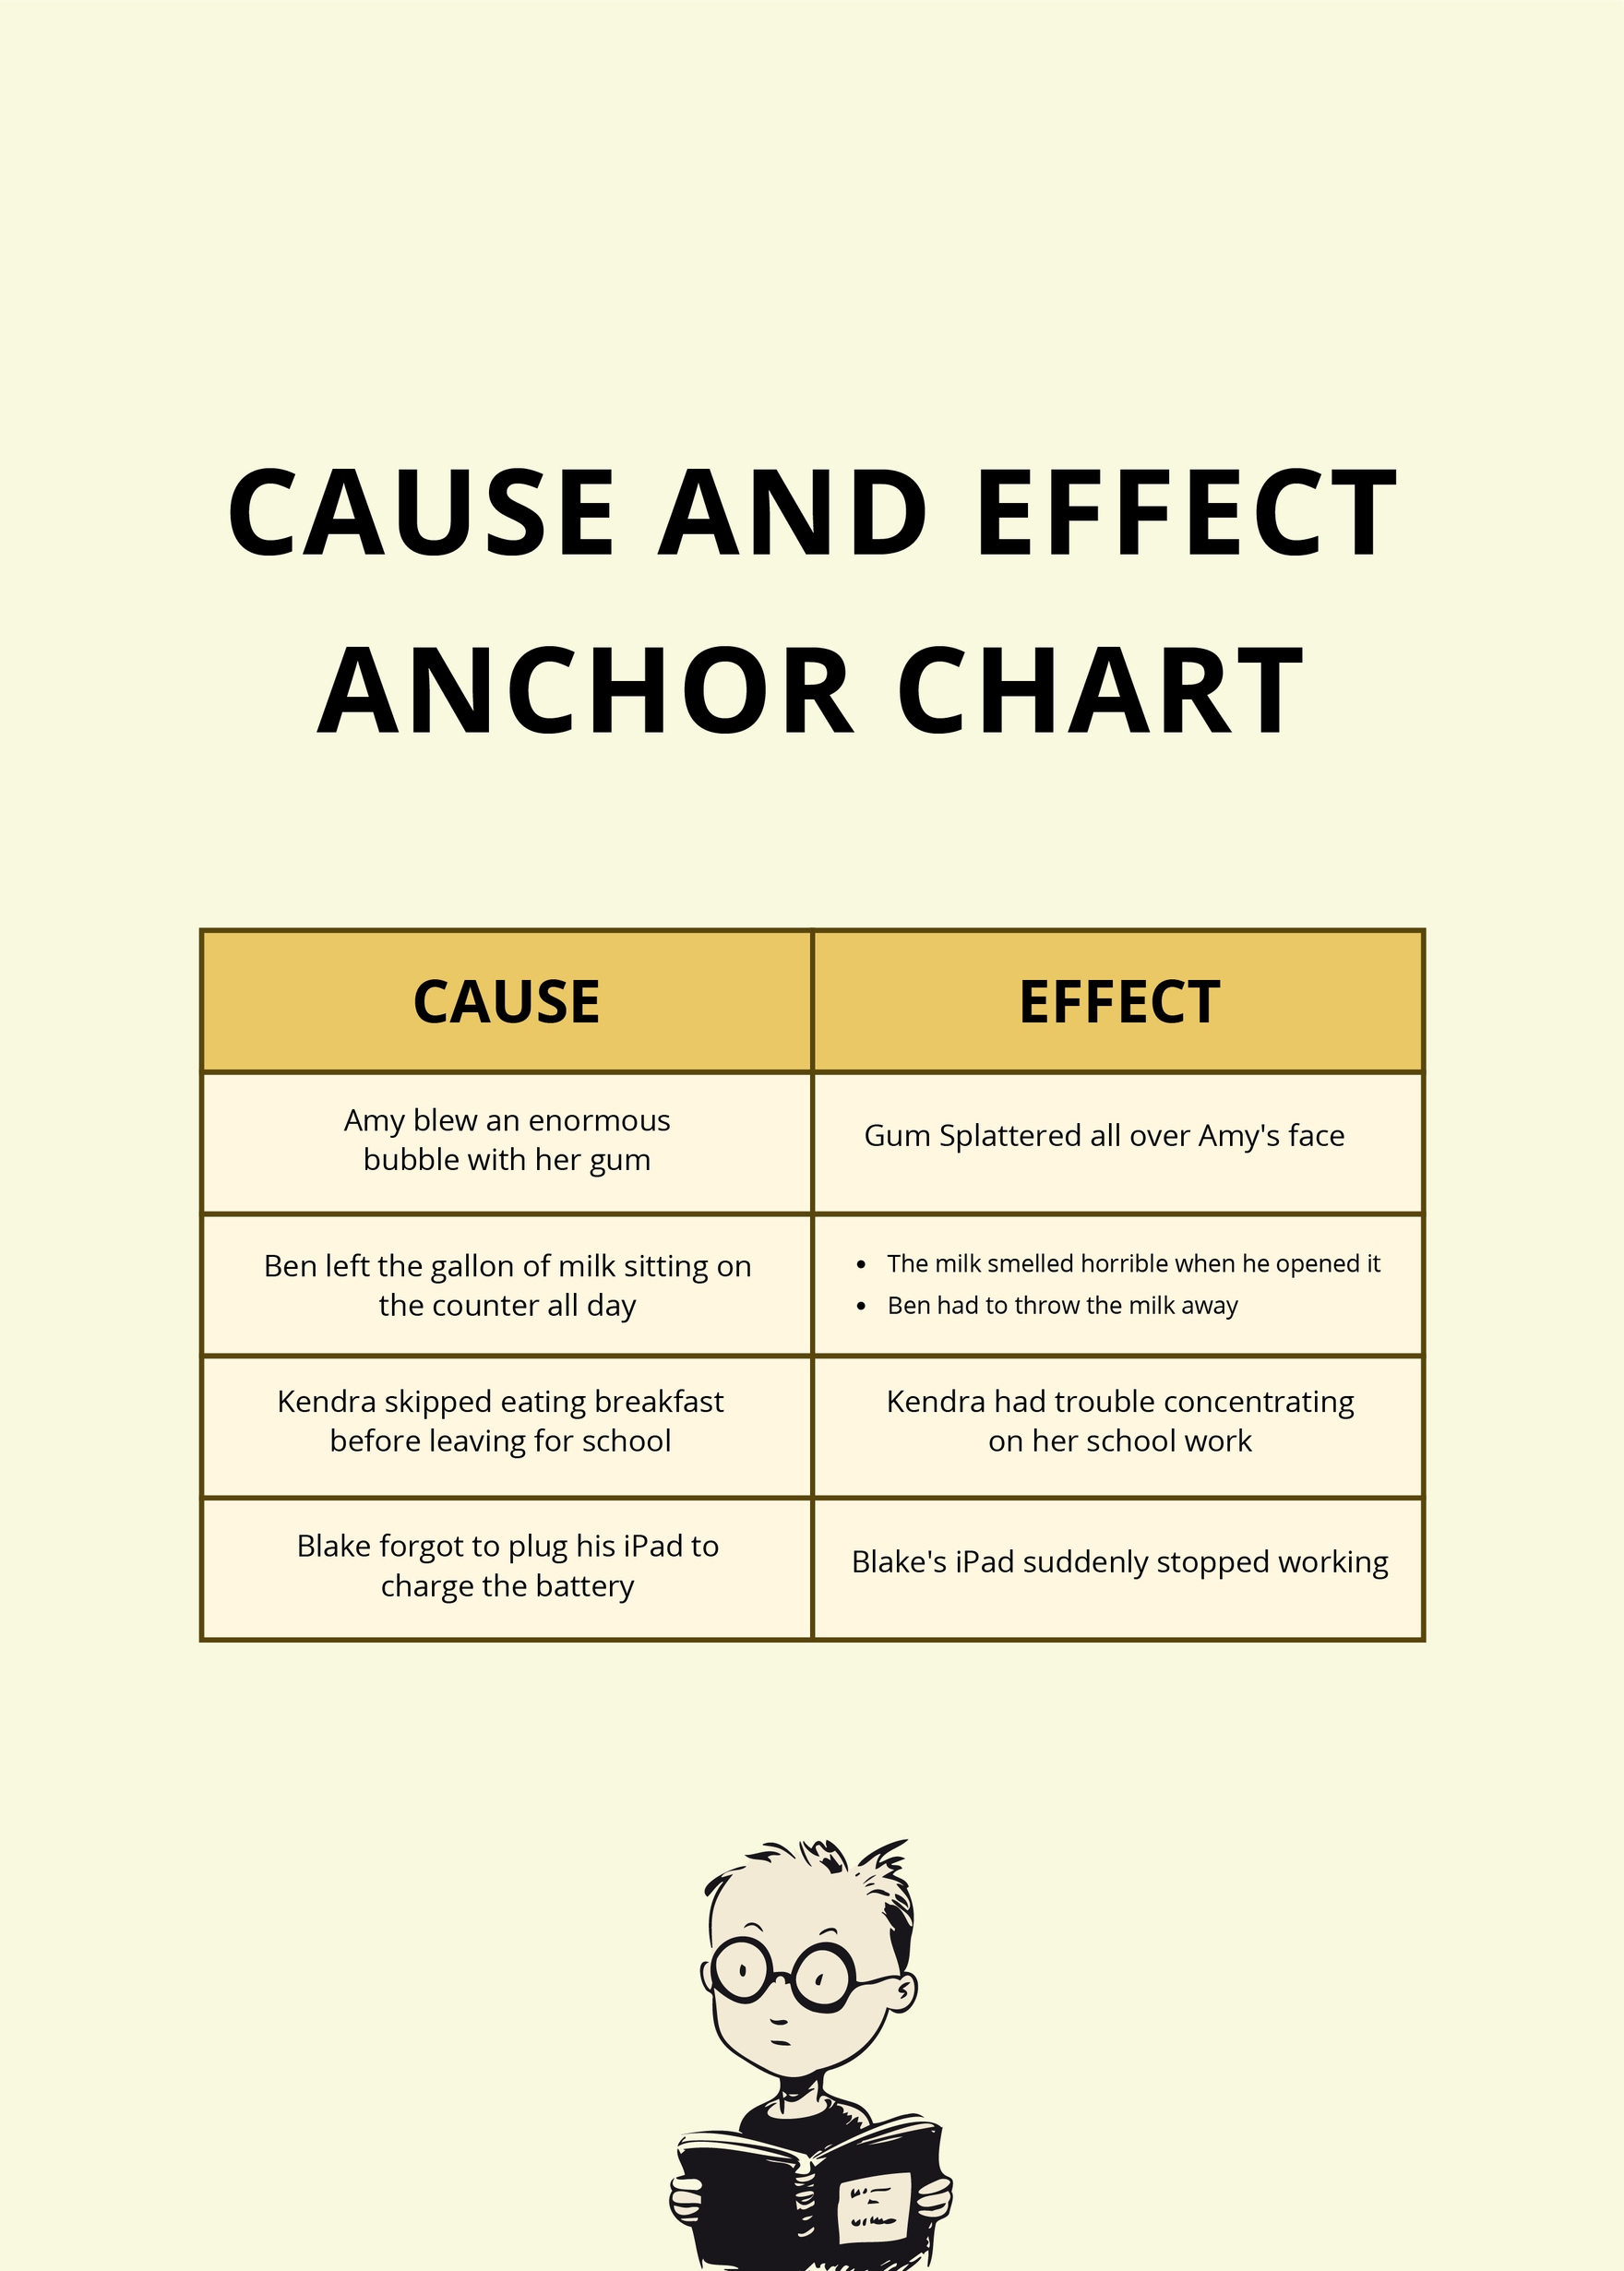
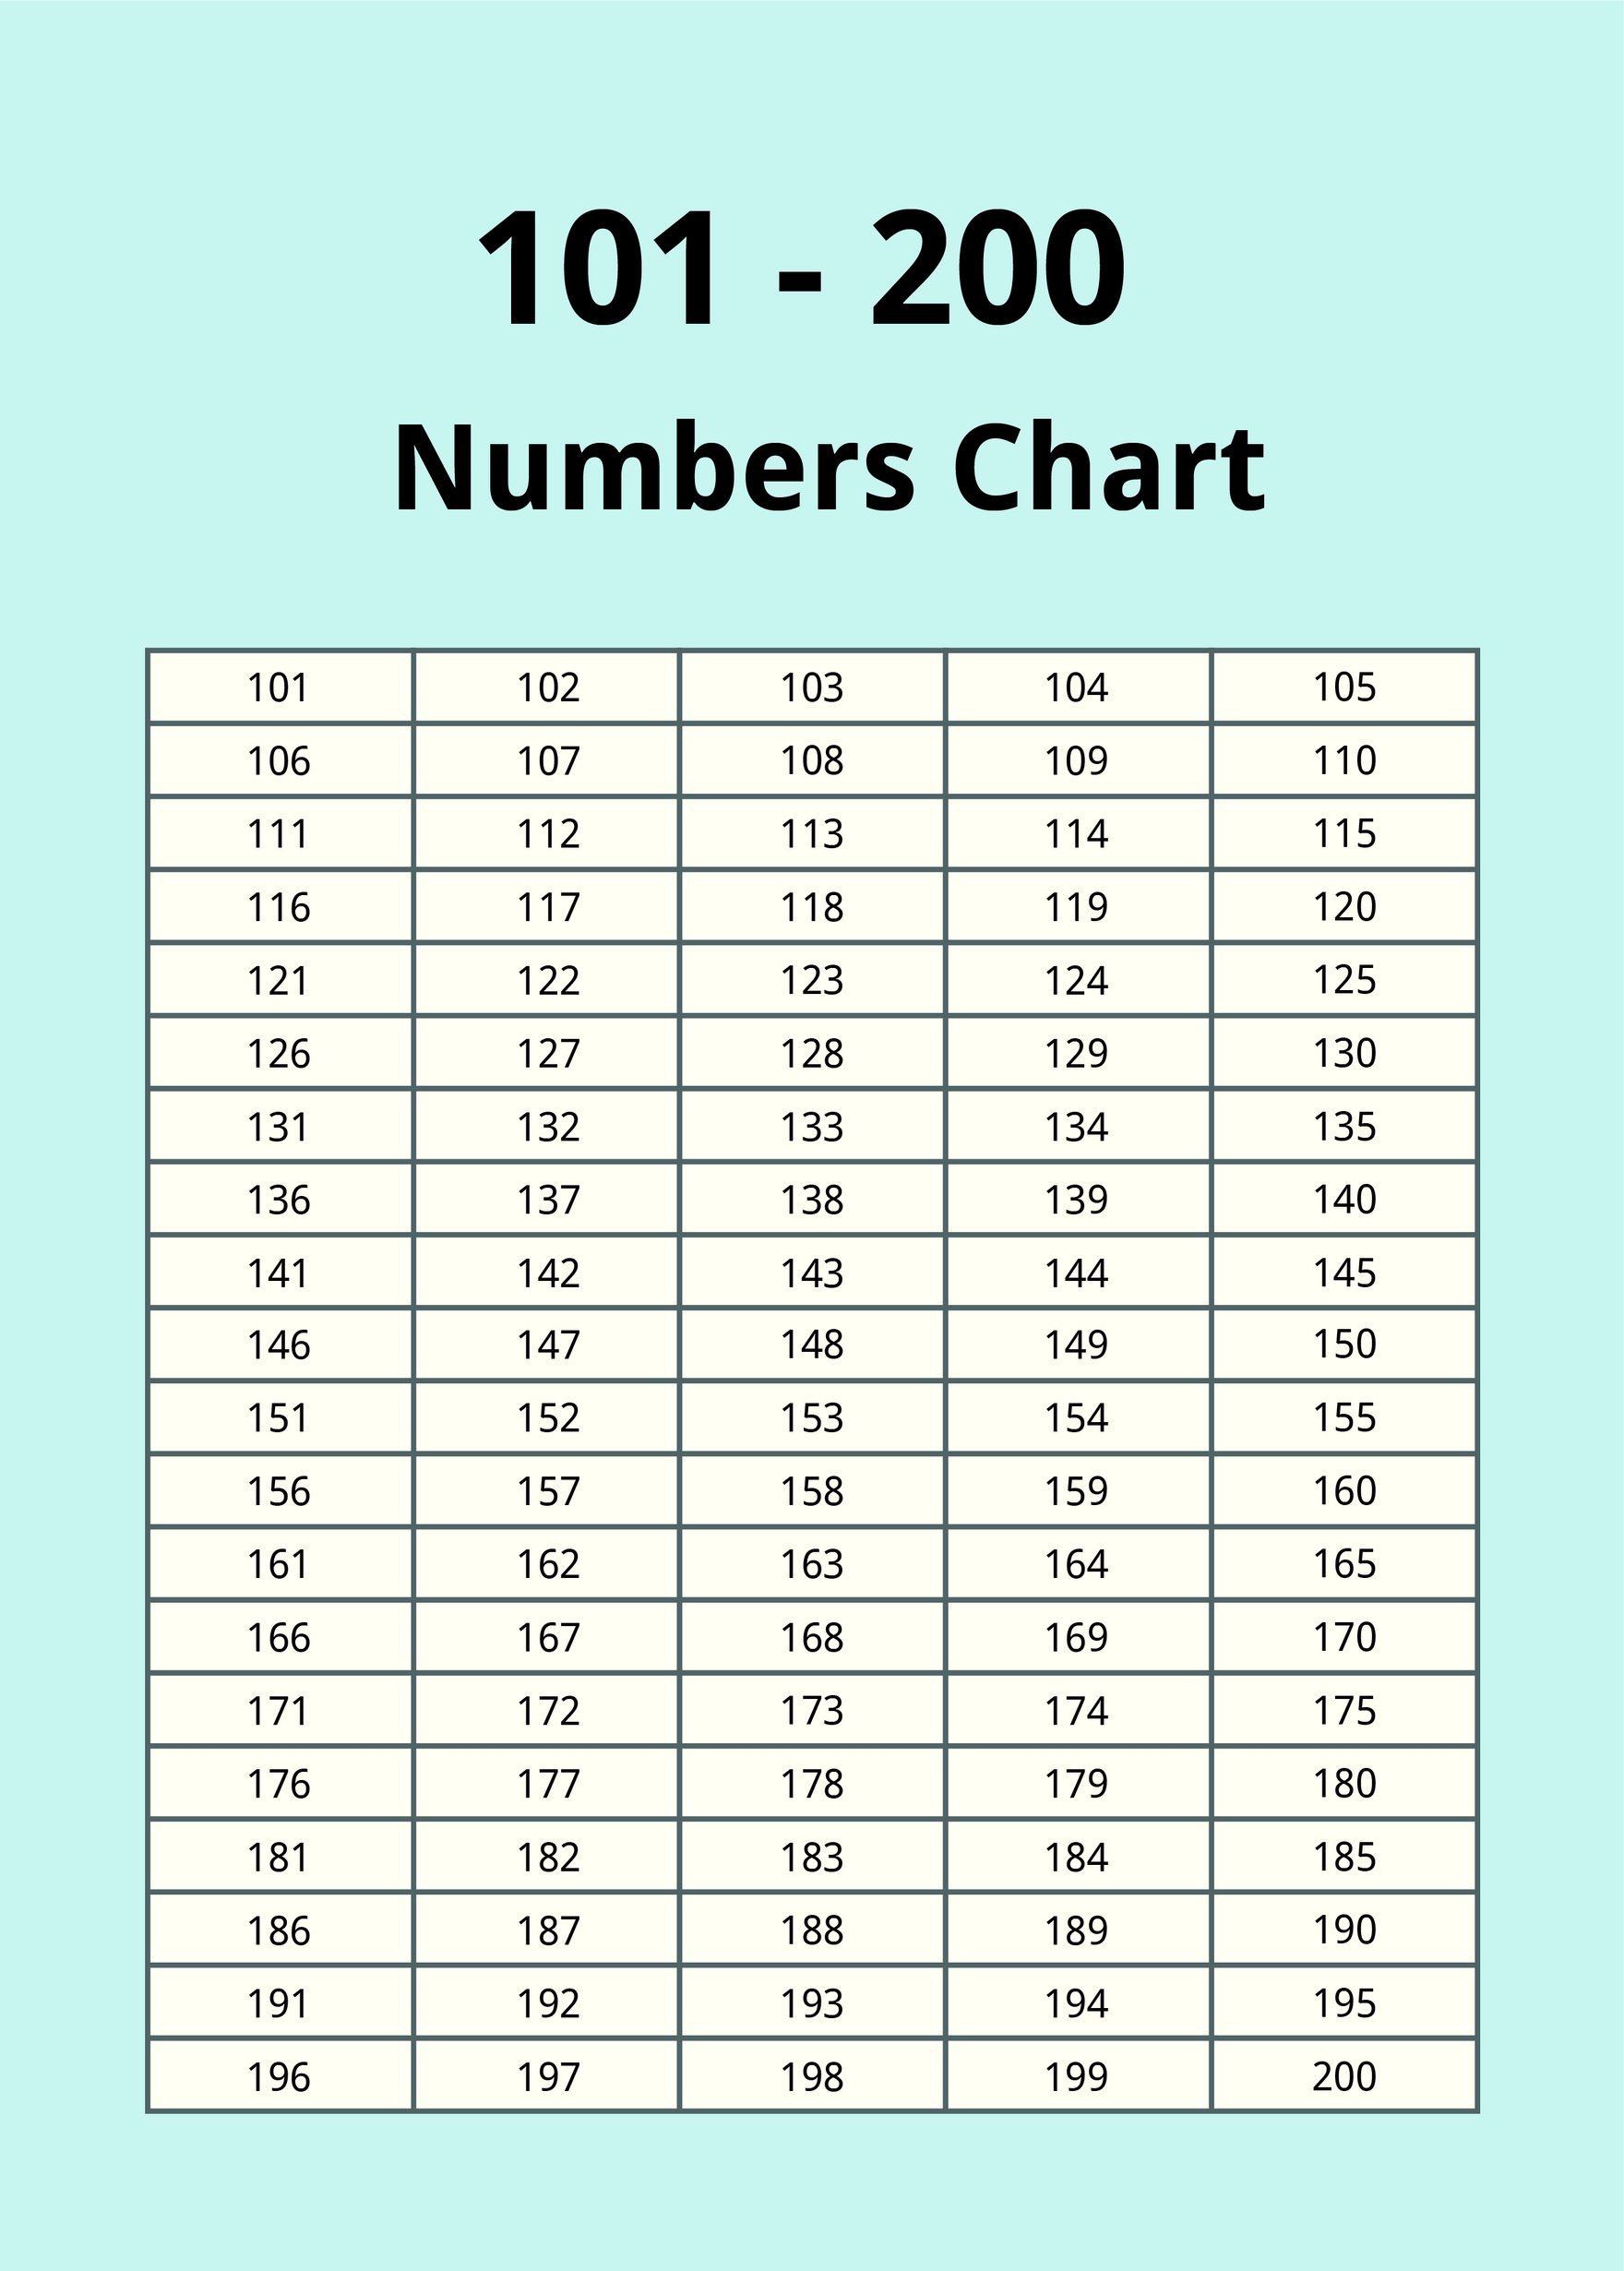
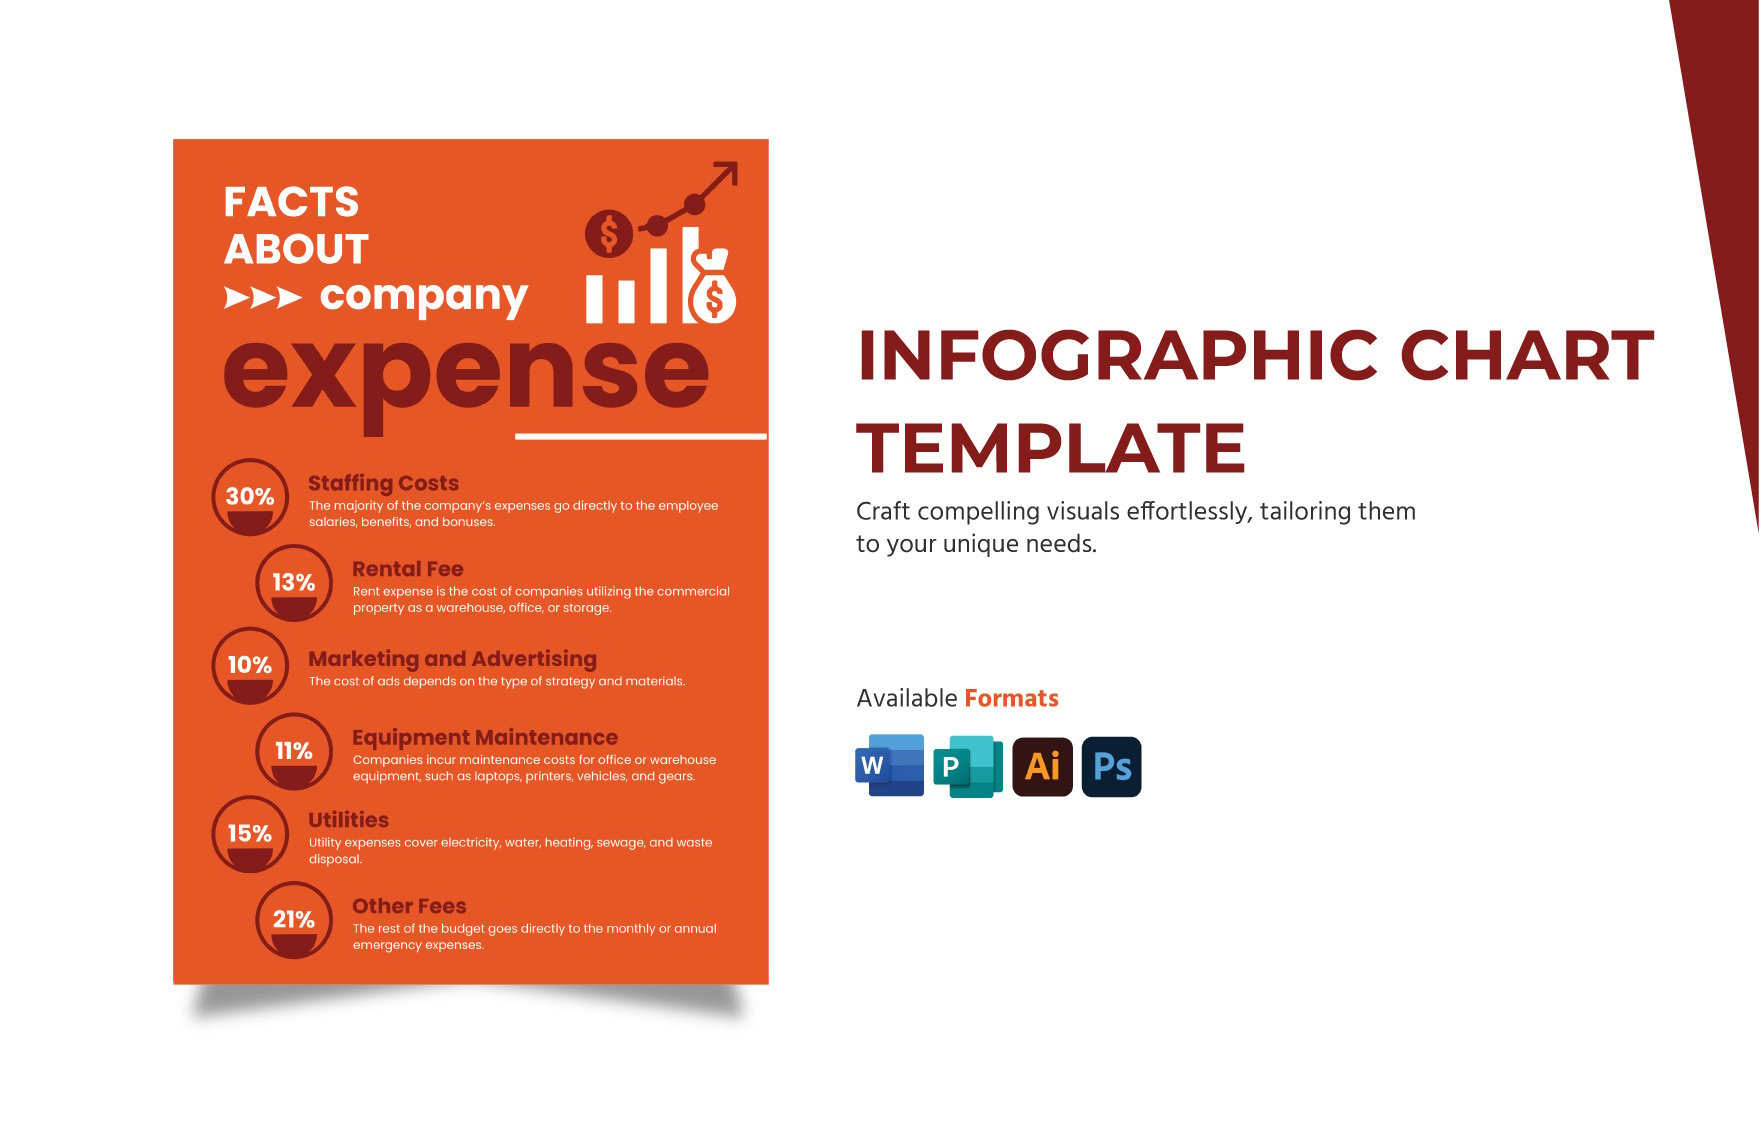
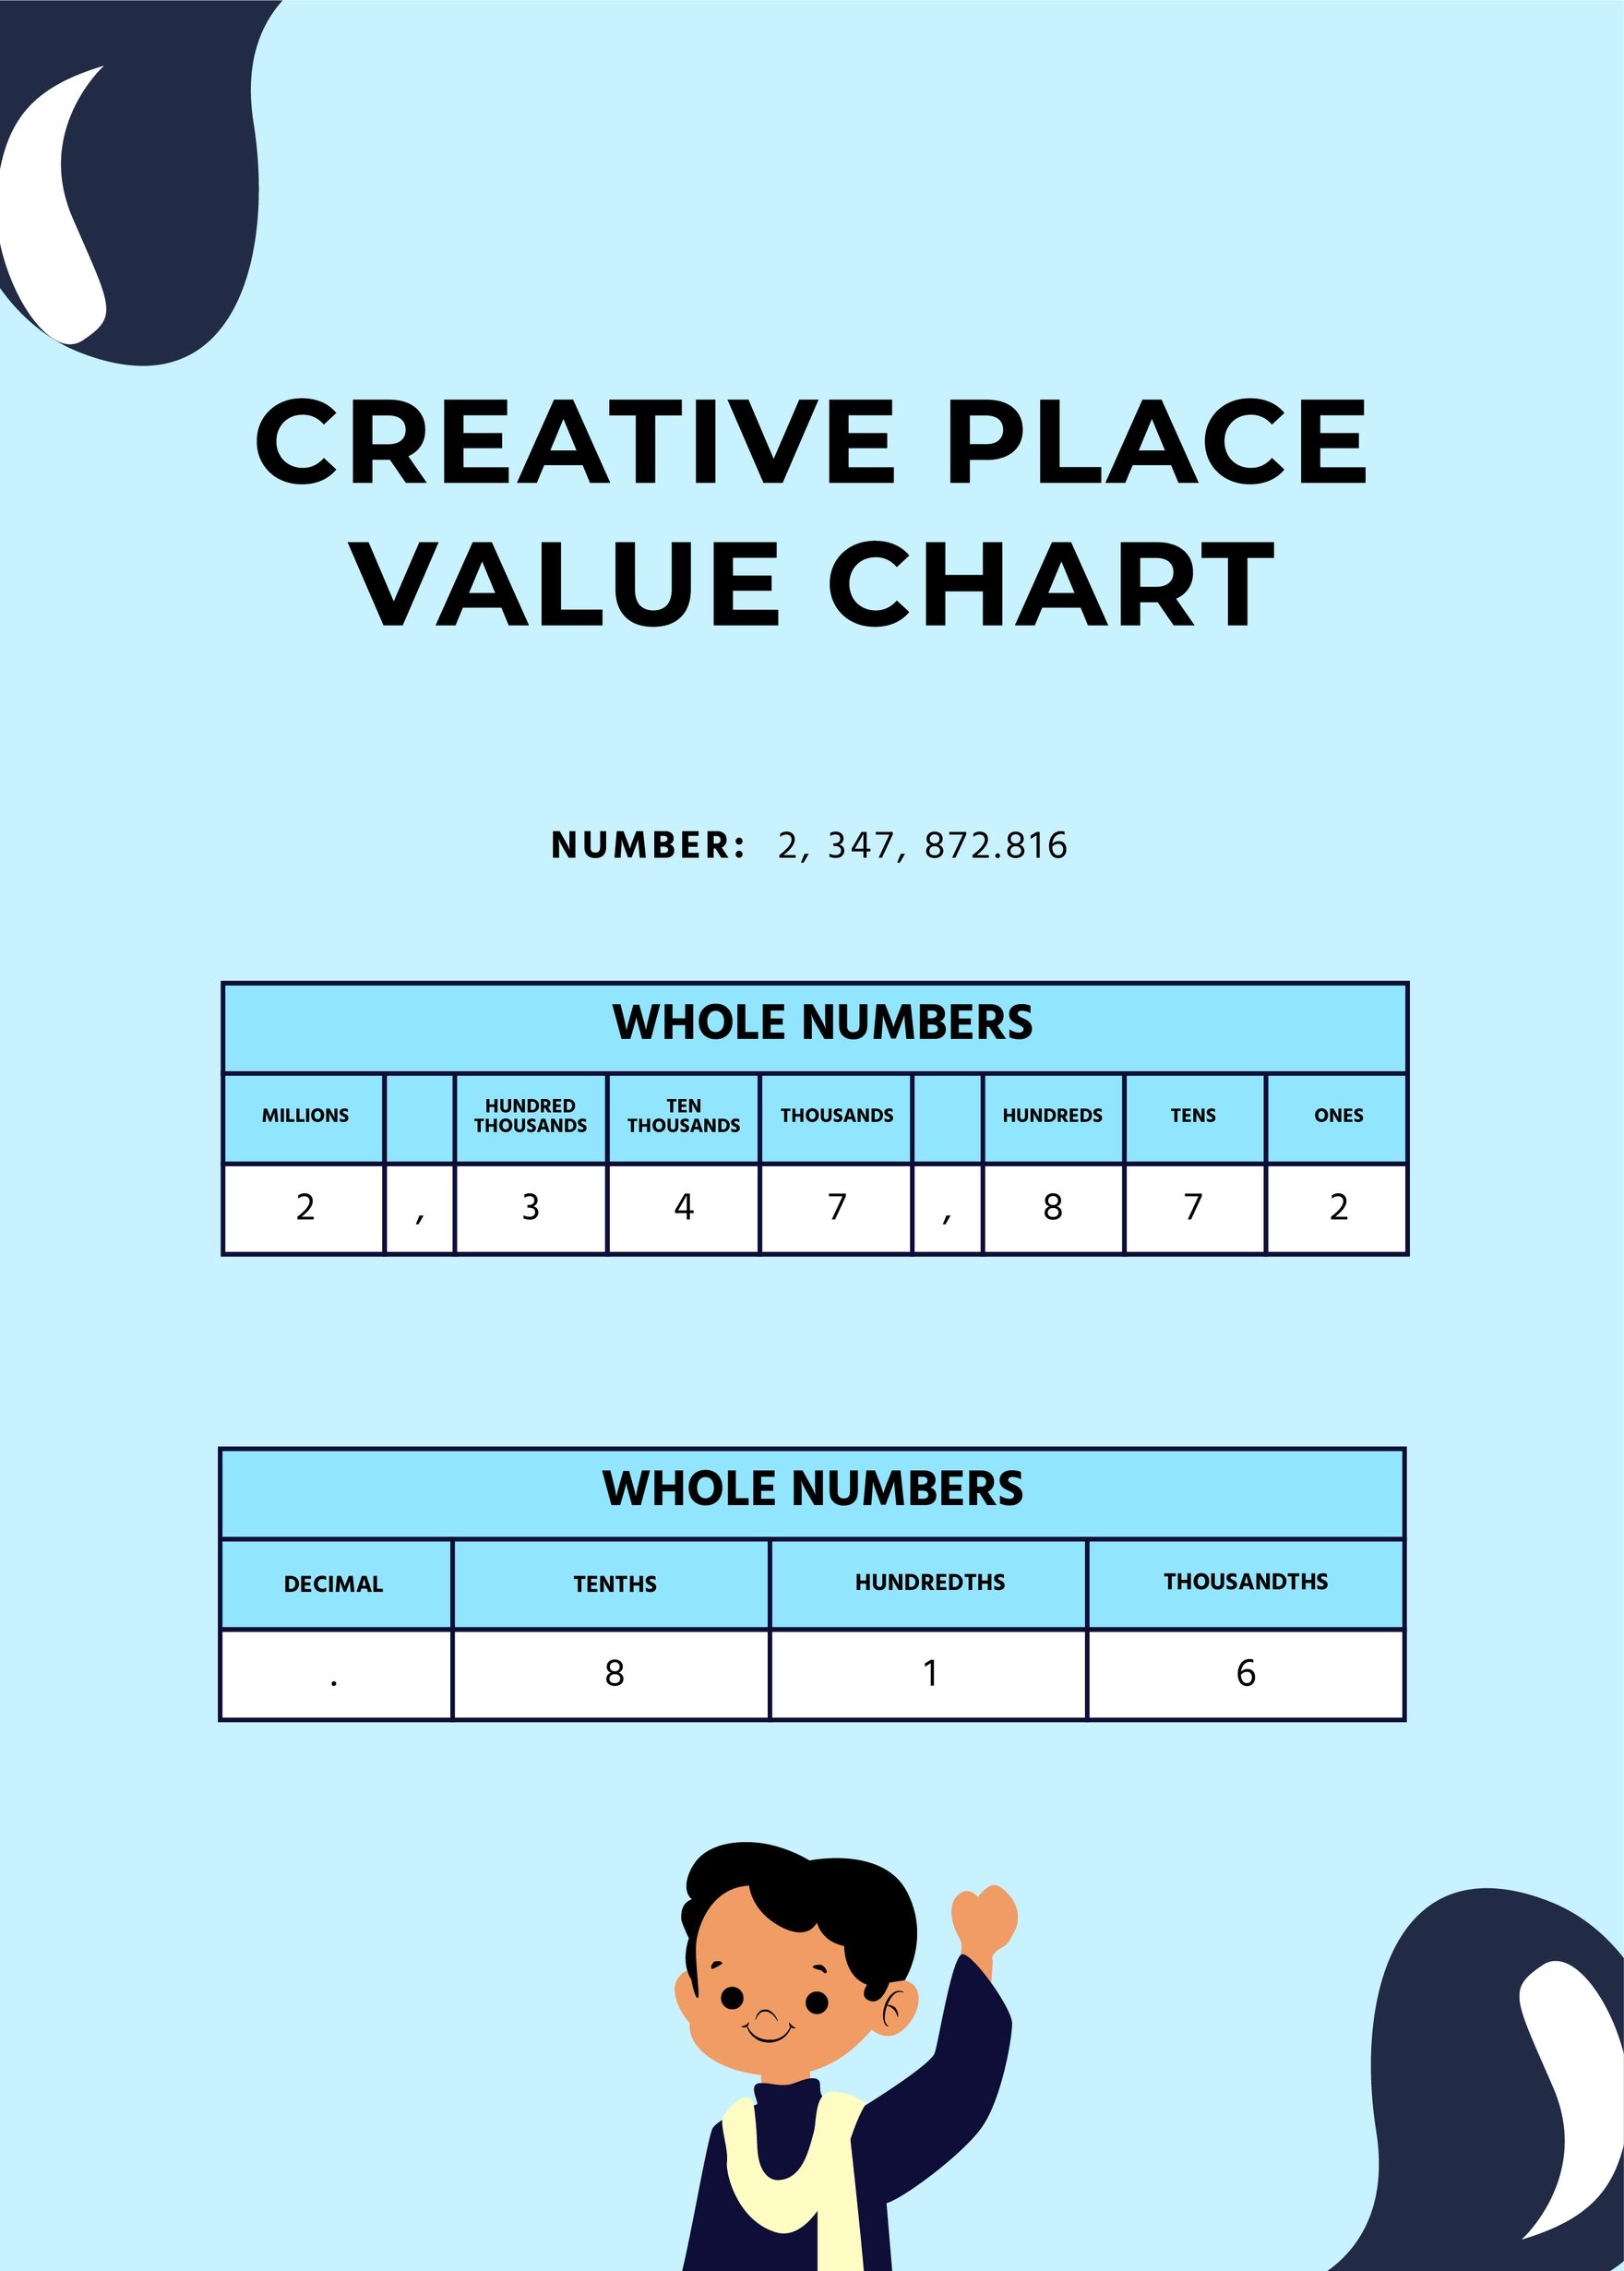
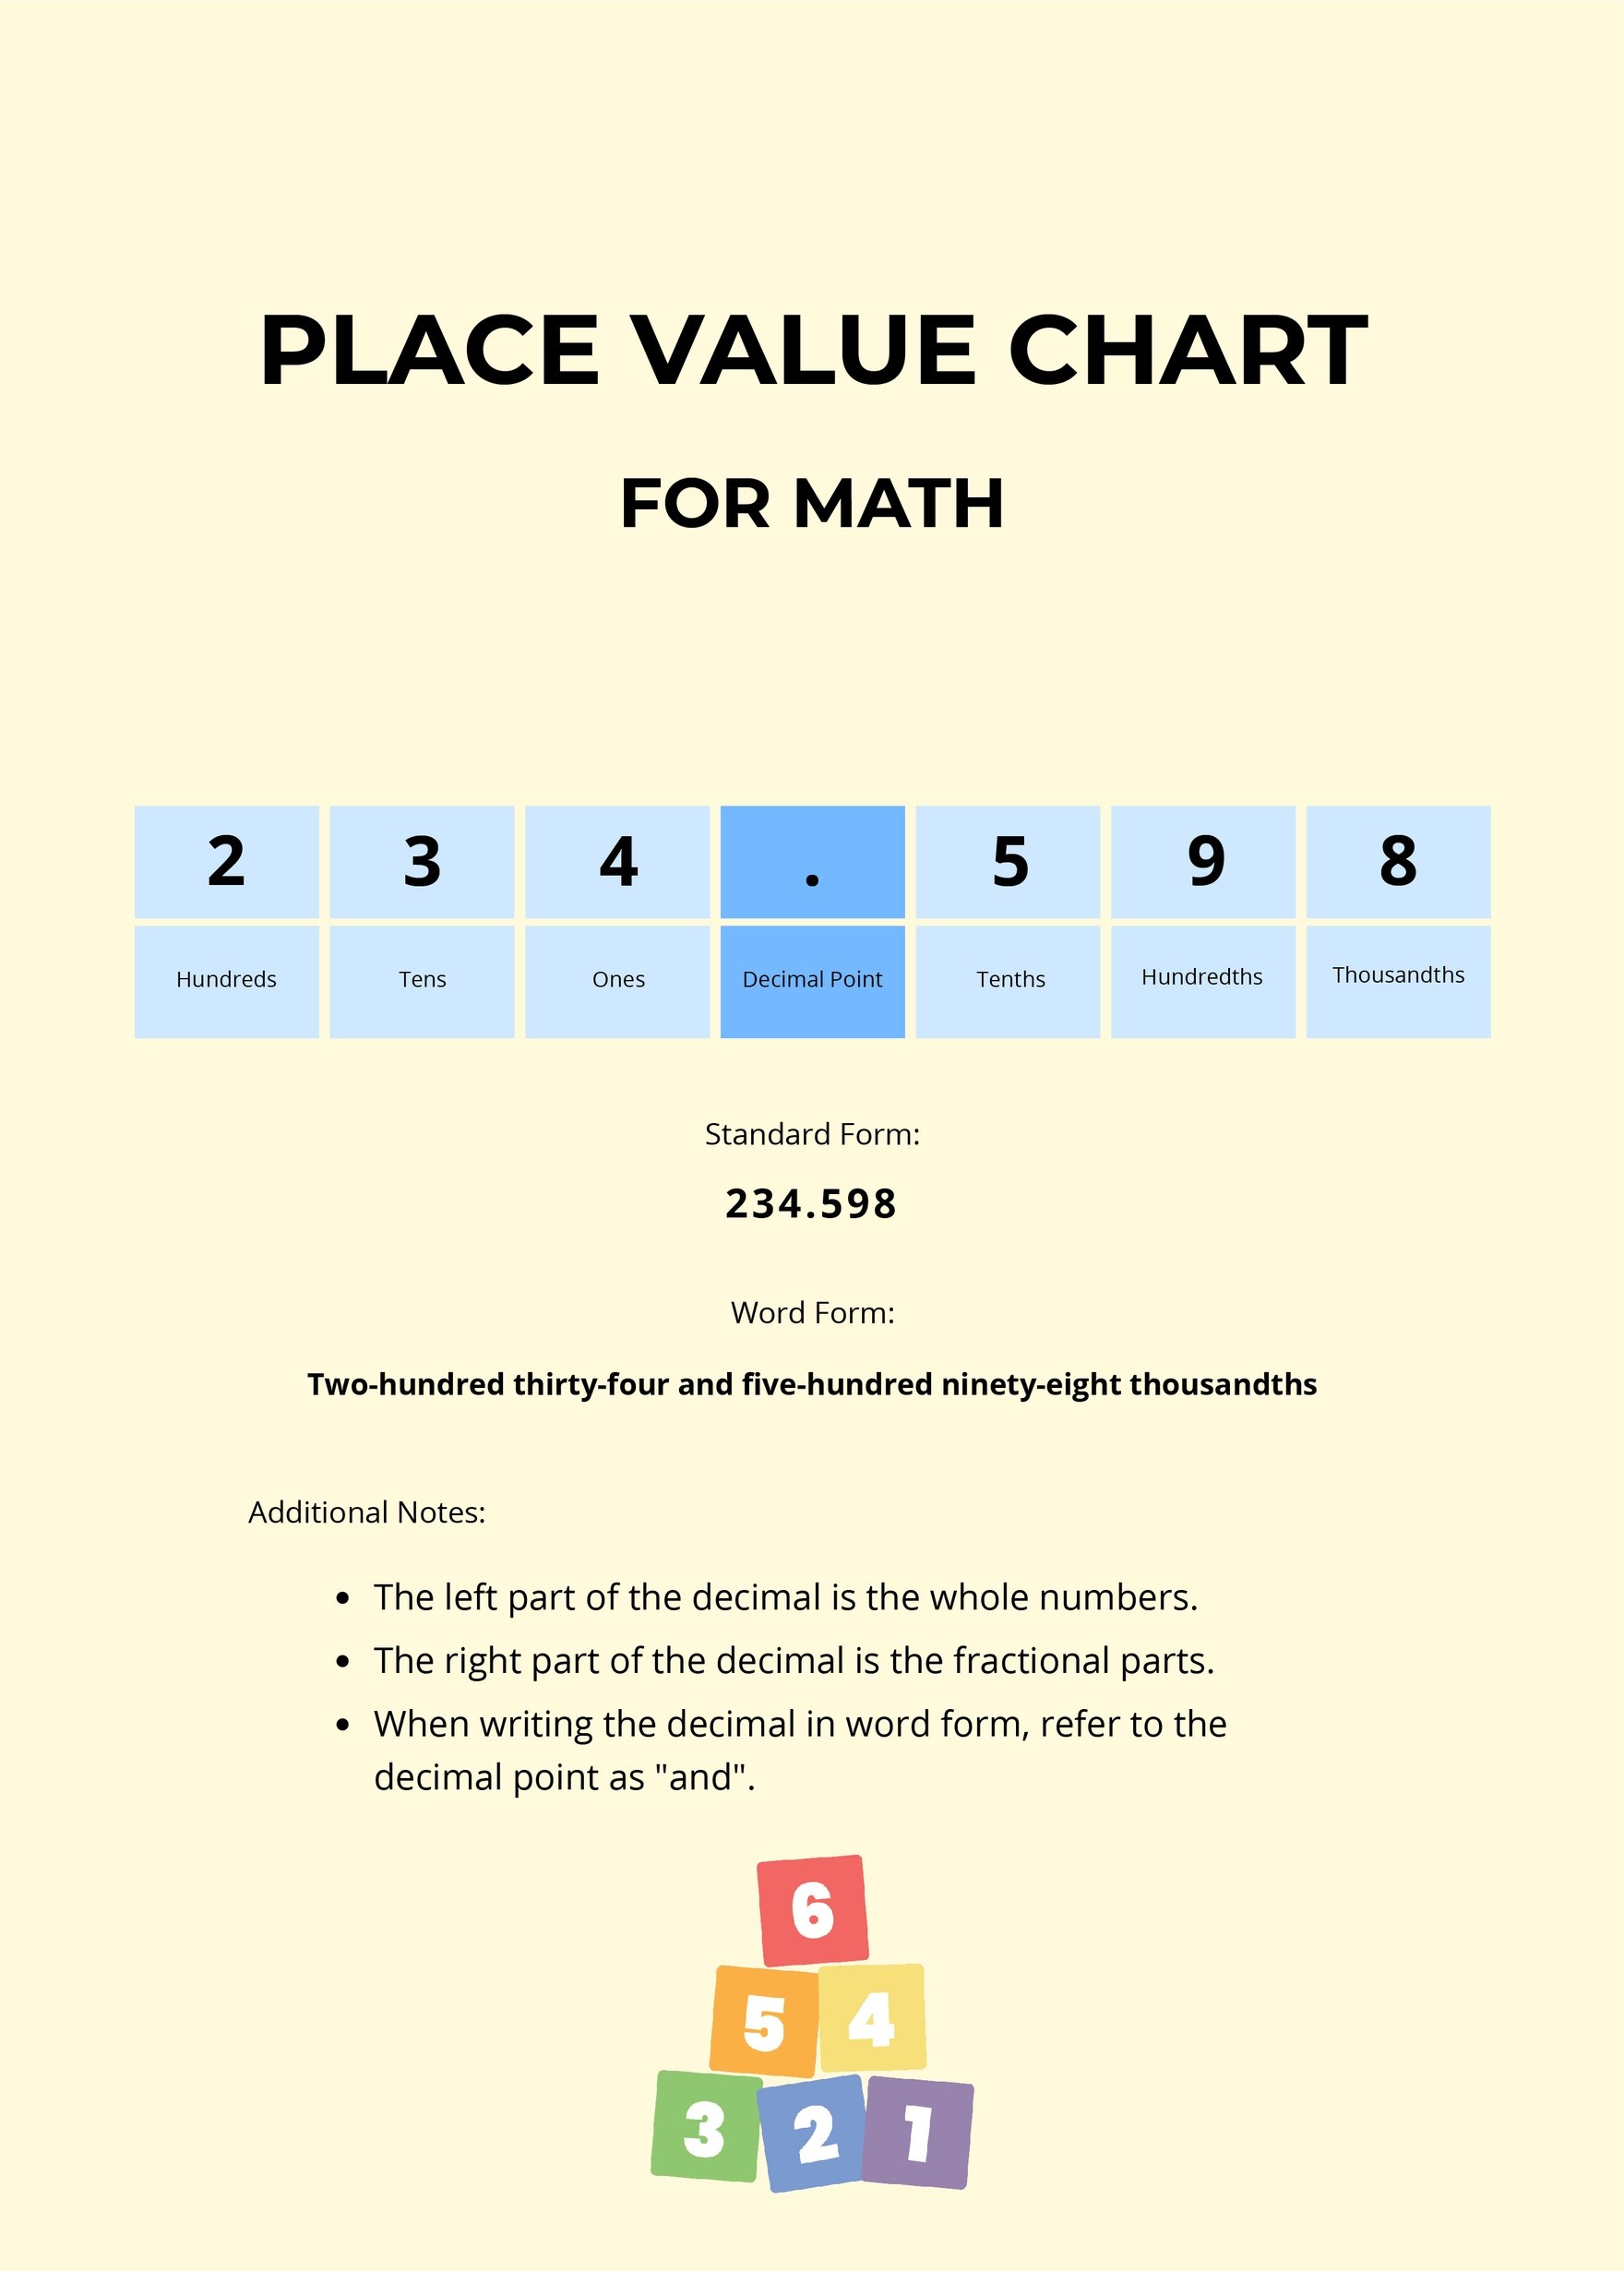
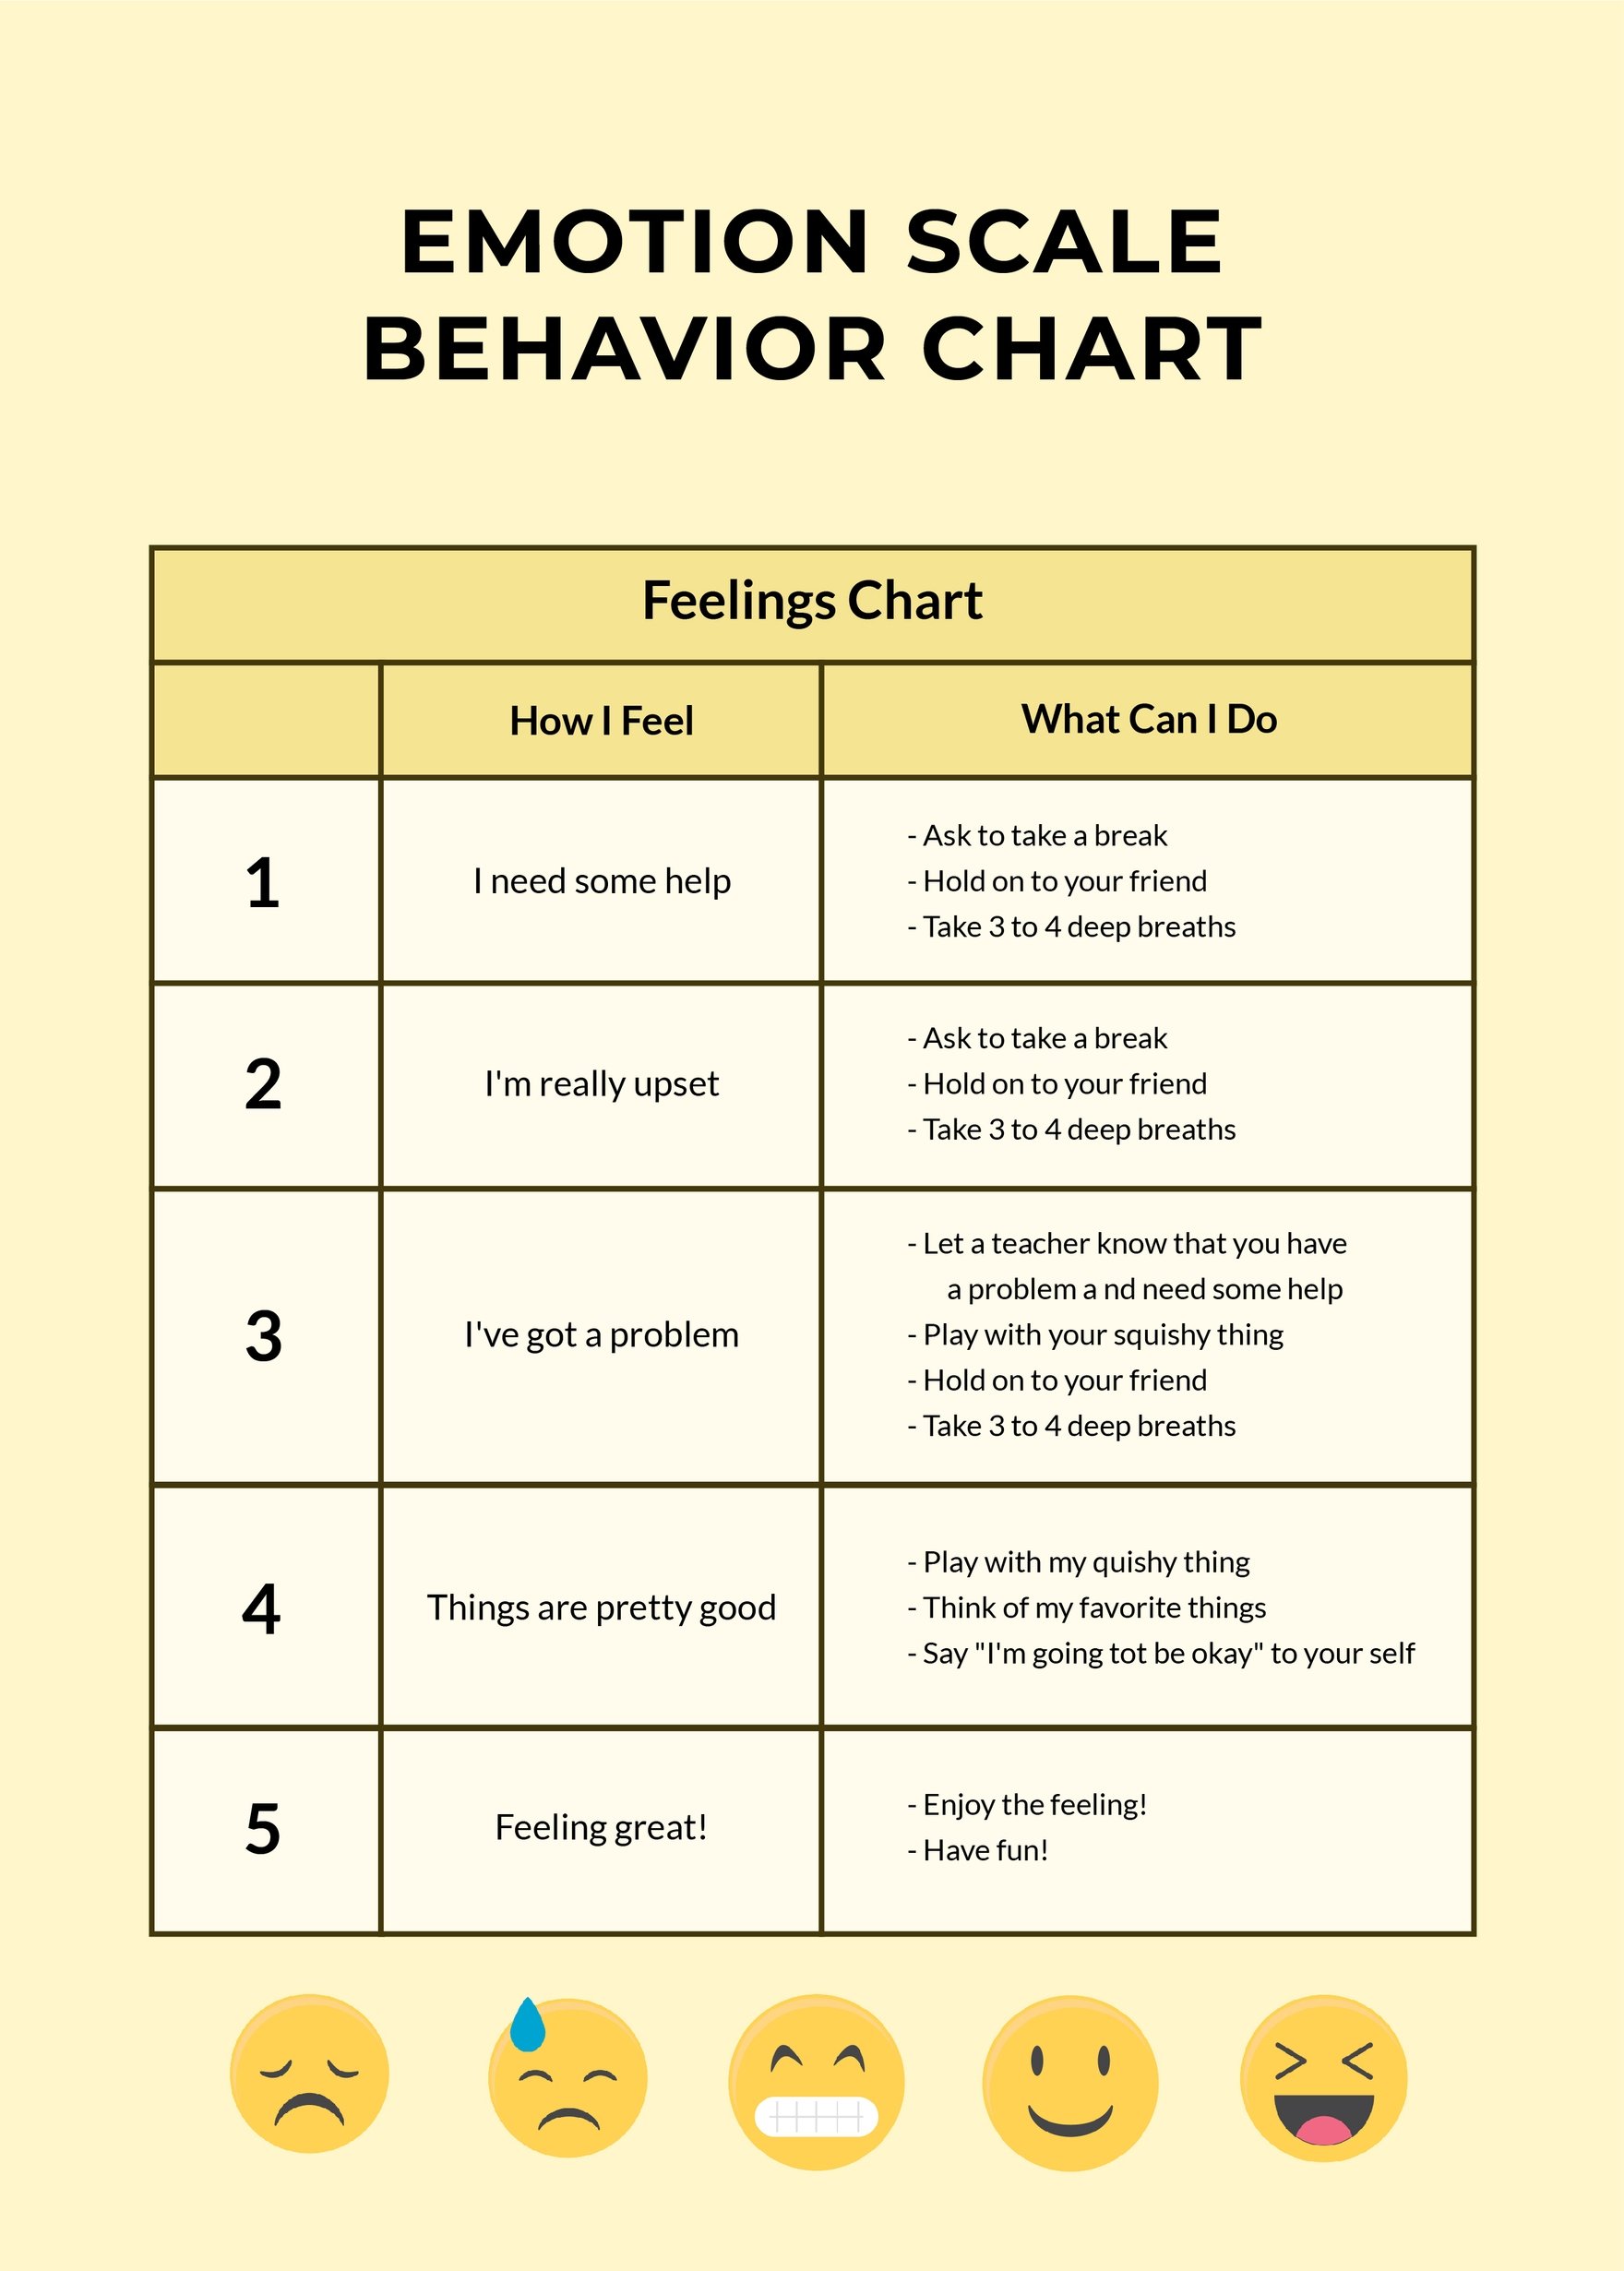
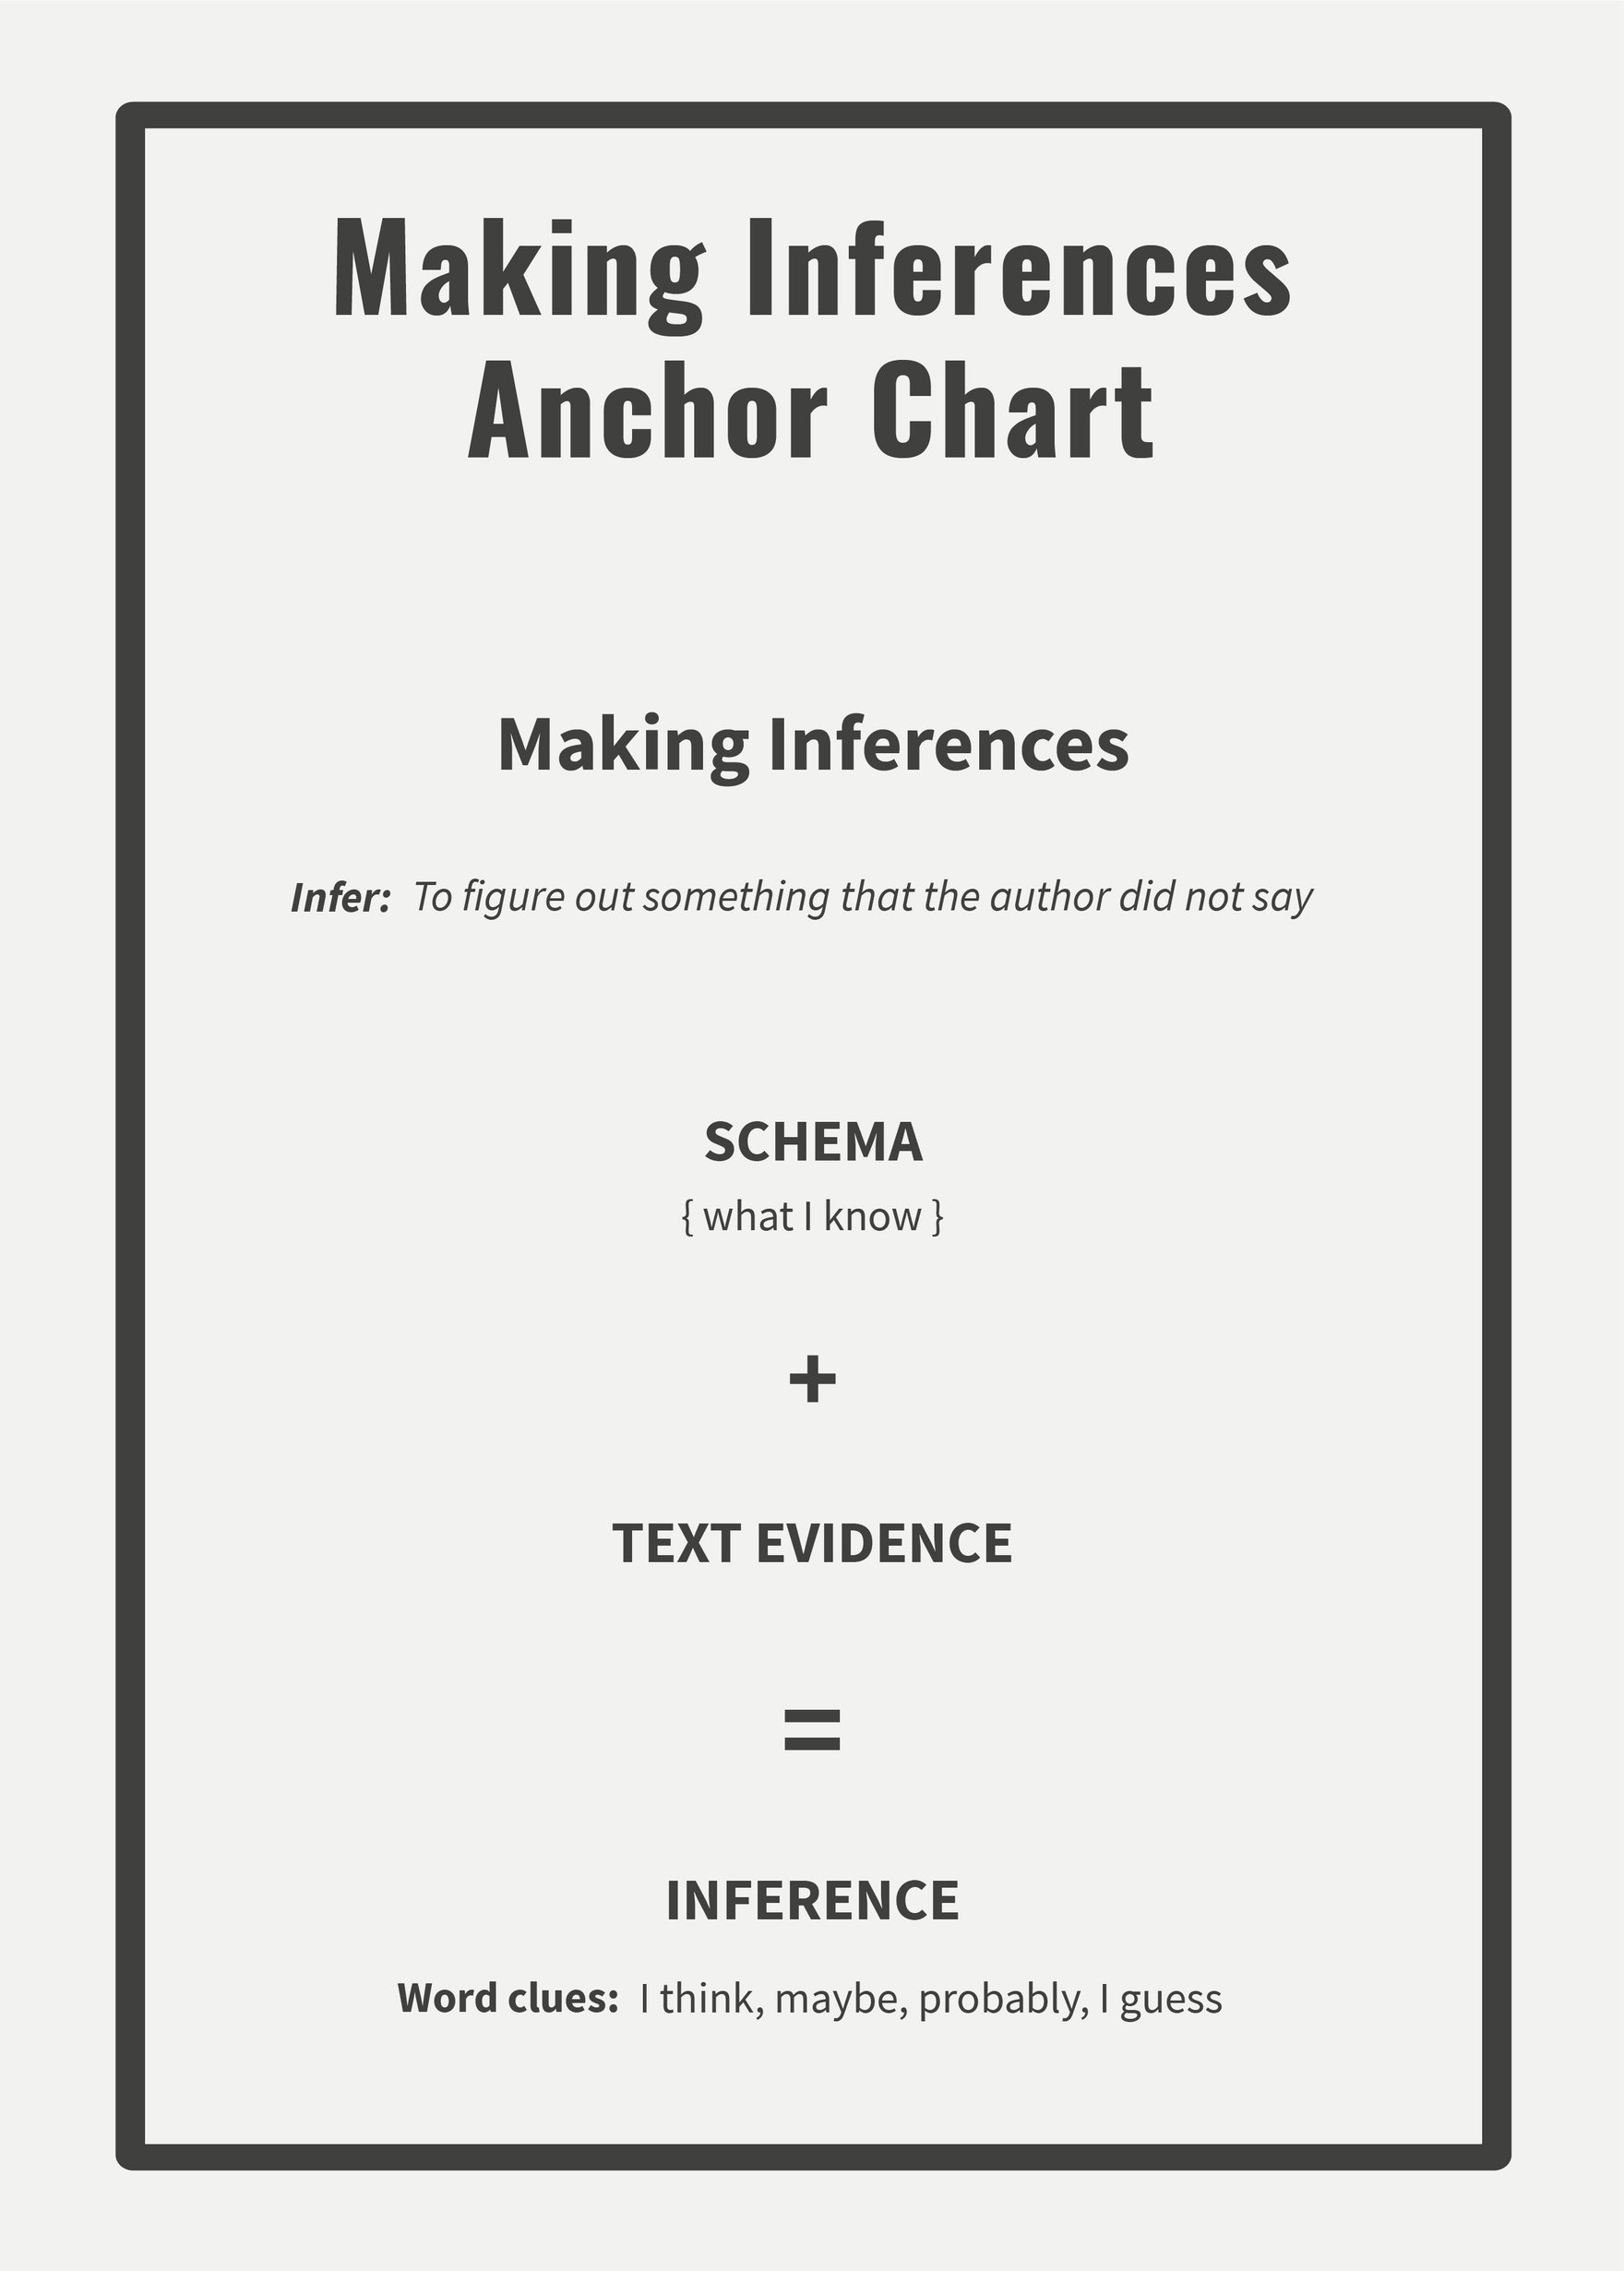
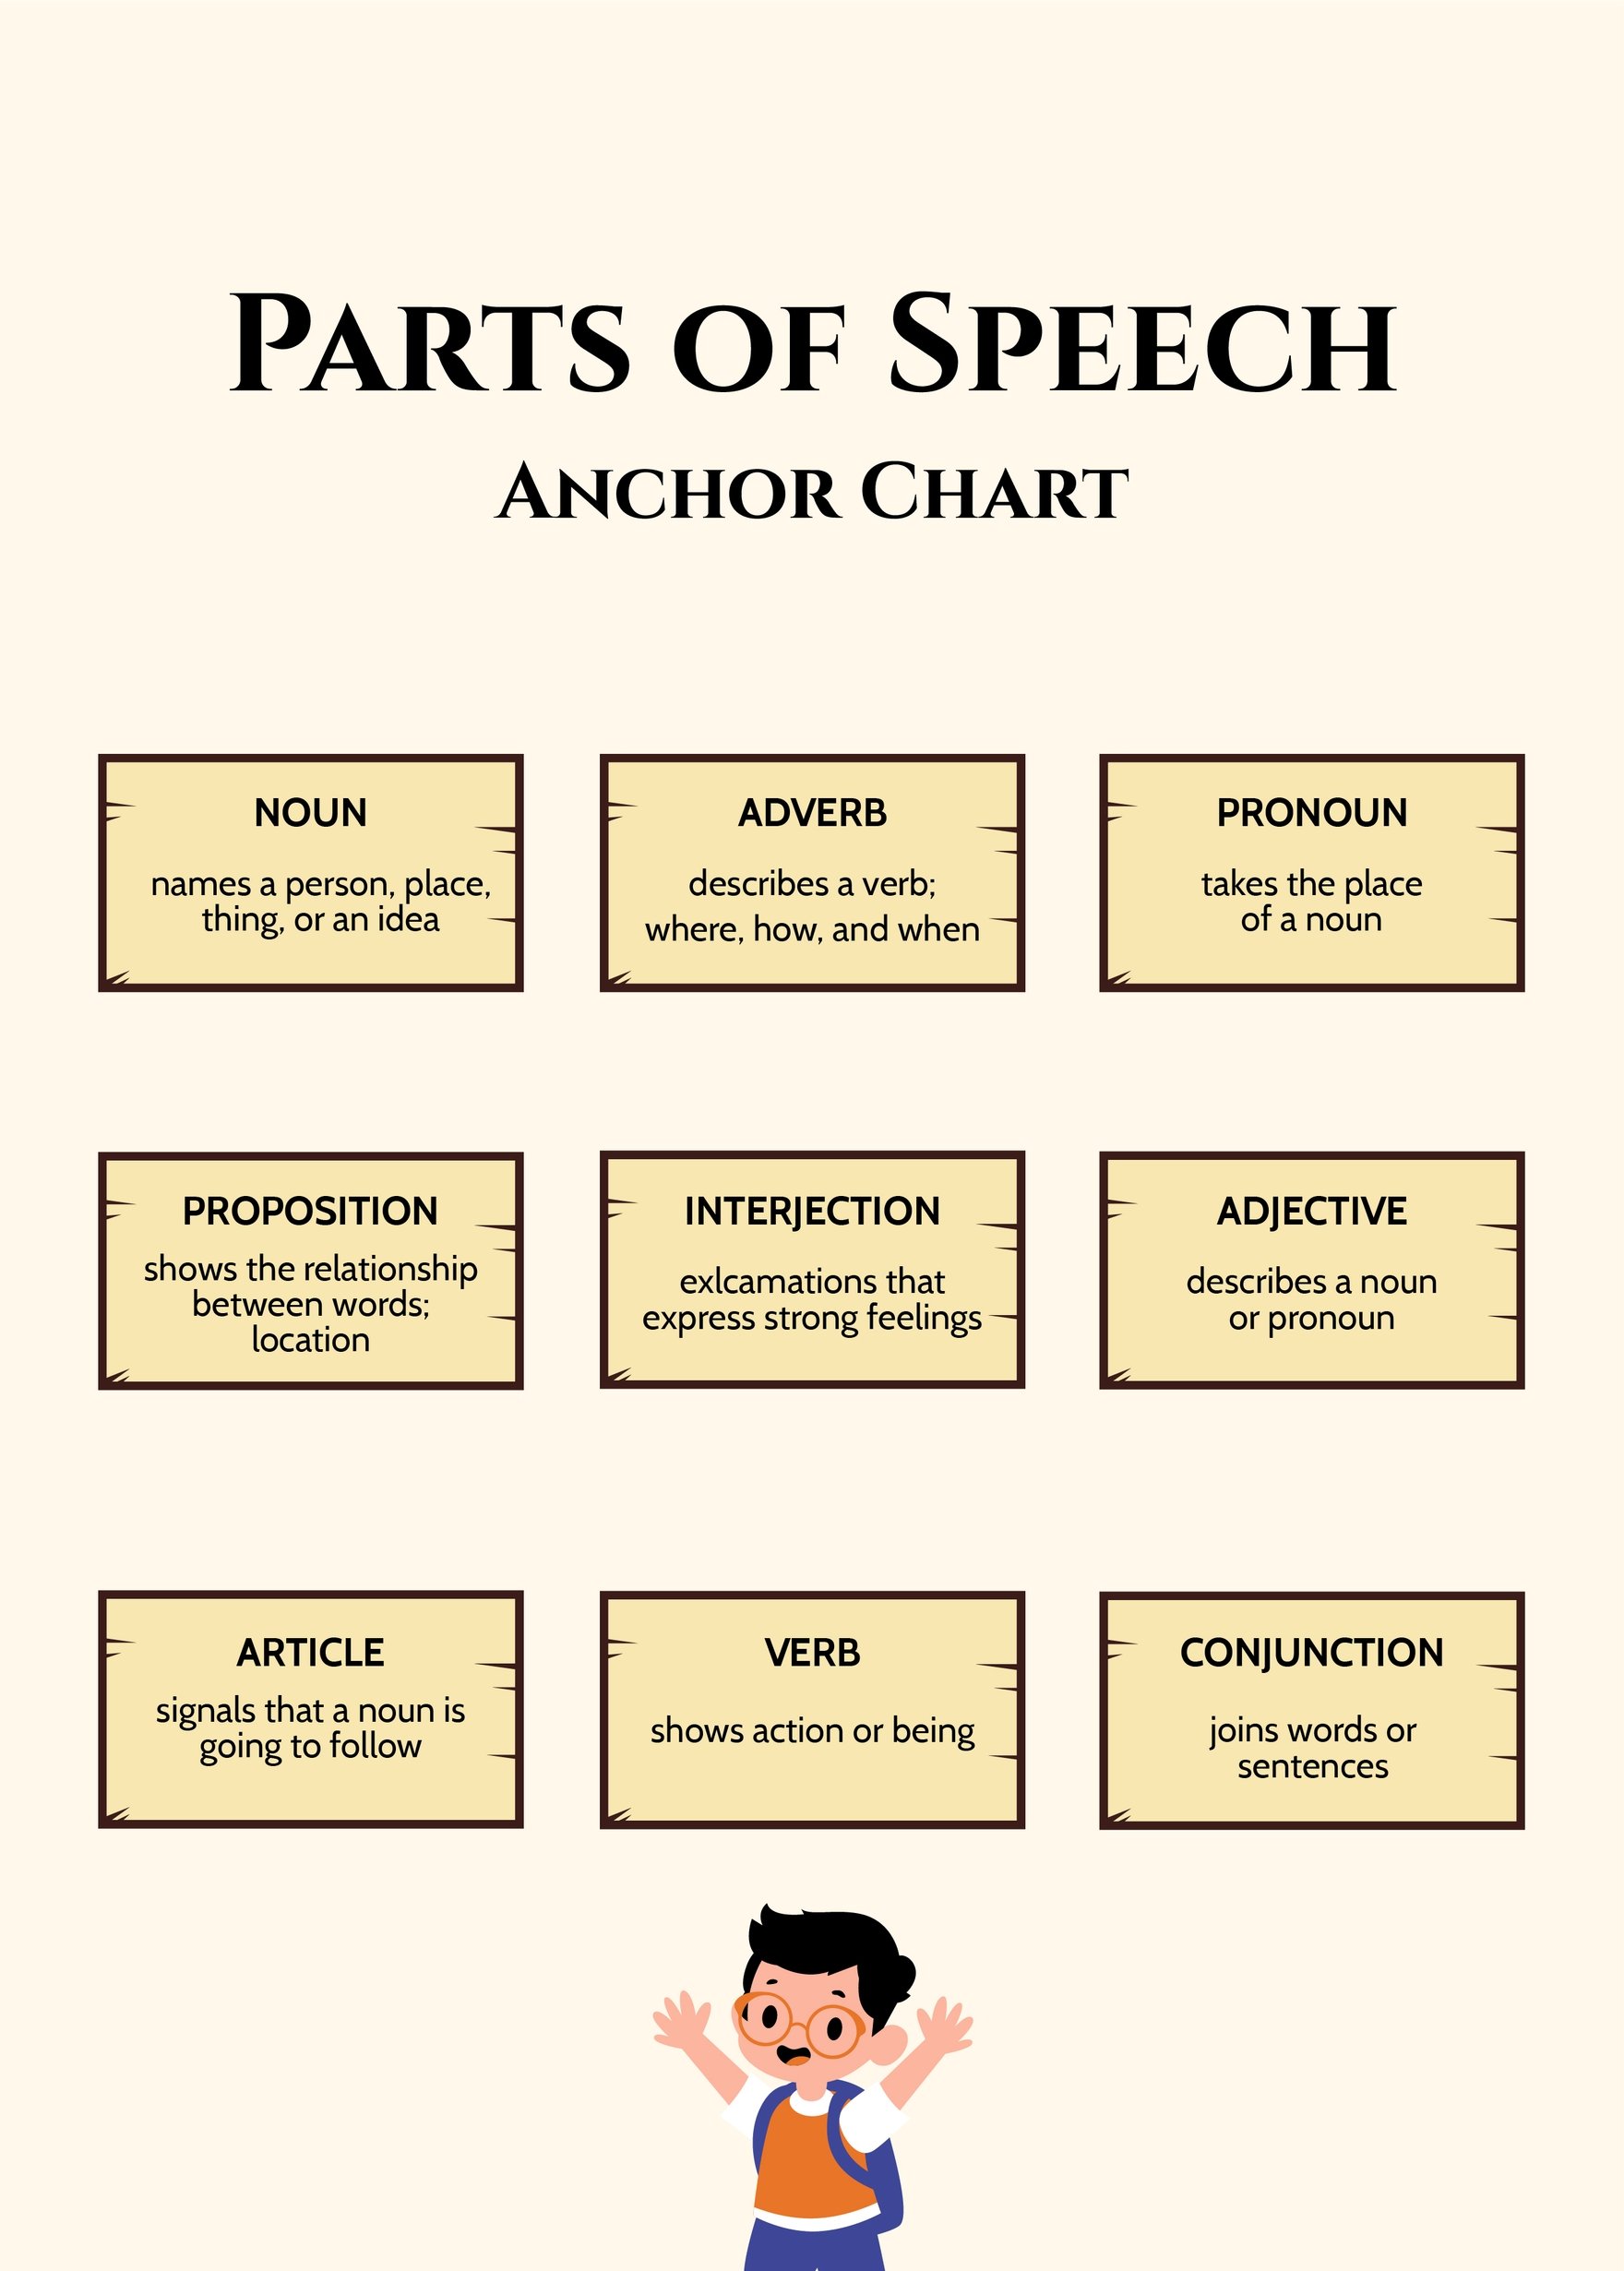
Visual presentation of information allows the audience to comprehend a vast amount of data without difficulty. In the business industry, graphs, charts, and infographics are some of the various ways to effectively present reports. For a well structured and neatly presented set of information, we offer you our ready-made chart templates in Adobe Photoshop. We guarantee you that our templates are 100% customizable, printable, and professionally designed, which will surely help you create a chart in an instant. Our templates range from comparison chart templates to seating chart templates you can download for business or personal use. Make haste and download a template for free!
How to Create a Chart in Photoshop?
A study from the Social Science Research Network revealed that 65% of the human population are visual learners. These types of learners absorb information more quickly if communicated through photos, graphs, or charts. For this reason, people in the business or the academe make use of charts if they need to present complex data. A well-organized chart allows individuals to comprehend various kinds of data in an instant. Designing a chart from scratch can be a time-consuming task. You won't have to worry as this short article will outline a step-by-step guide to help you get through the process.
1. Gather Necessary Information
Before you start creating a chart, make sure you have all the necessary information that you need to include. Gathering the information beforehand will result in a smooth flowing chart-making process. Moreover, the information you have will determine what type of chart you will use to present the data. Note that there are different types of charts, namely Gantt chart, flow chart, organizational chart, chore chart, pie chart, bar chart, and waterfall chart.
2. Launch Adobe Photoshop
Adobe Photoshop is an editing software used to manipulate images and create various types of print and digital materials. Aside from that, Photoshop also features multiple tools allowing users to design graphs for business presentations or personal purposes. To start, open Photoshop and create a new file by clicking File > New > Blank File. A dialog box will then pop up for you to enter the dimensions of the document and the resolution of your canvas. If you are going to make a table, click Table > Insert Table. Then, enter the desired number of rows and columns.
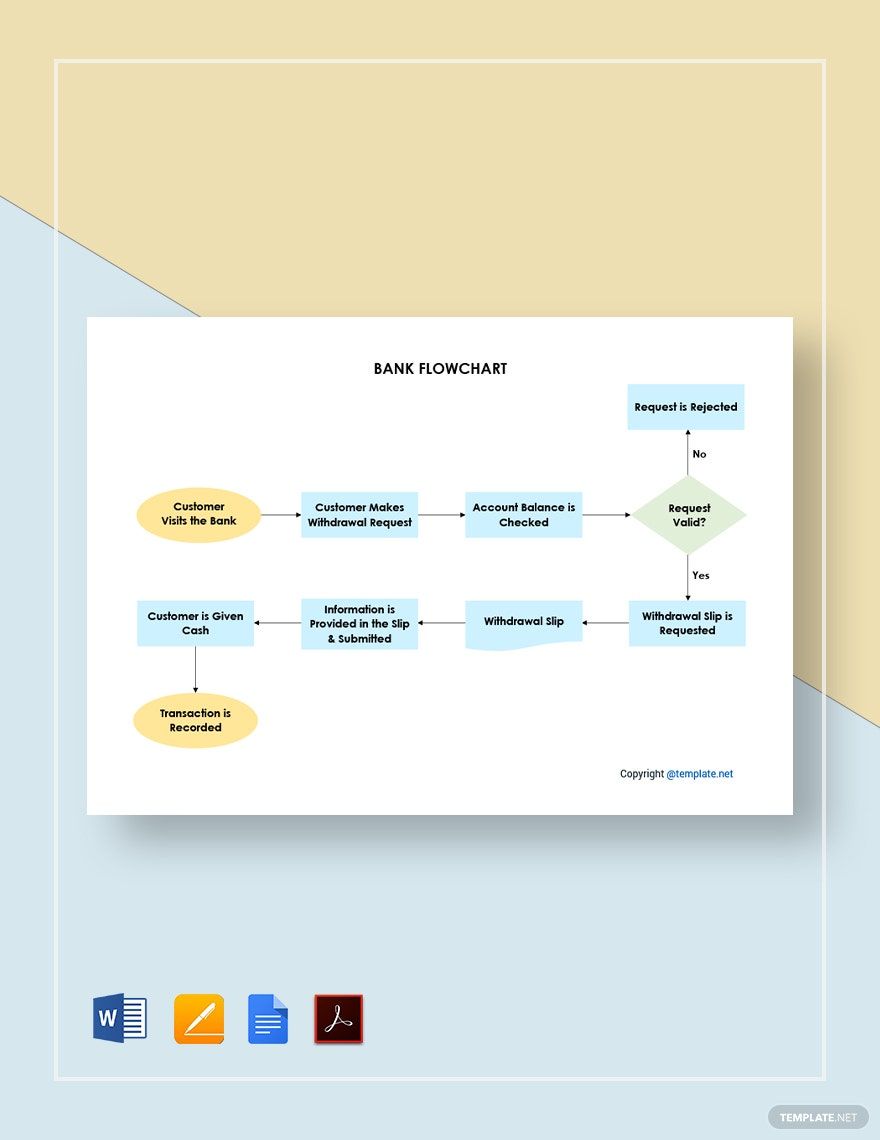
Alternatively, you can check out our website and download one of our ready-made chart templates. We have a comparison chart, seating chart, process flow chart, and Gantt chart template/s you can download for free. Downloading our templates will make your chart-making process a whole lot easier for you.
3. Add Shapes
If you are creating an organizational chart, select the rectangular shape tool and create a shape on the blank canvas. For a donut chart, insert a circle by selecting the Ellipse tool. Fill in the shapes with colors to highlight a comparison or for a more creative visual representation. For a timeline or flow chart to be logical, use lines to link the information.
4. Insert Text
Next, start typing the information you have gathered beforehand. Also, remember the key components of a chart. Typically, a bar graph or line graph consists of a data series, title, horizontal and vertical axis, symbols, scales, and legends. For a timeline, make sure to arrange the events in chronological order for it to fully serve its purpose. See our timeline templates for reference.
5. Review
Carefully review the content of your chart and see to it that it is presentable and free from errors. For charts that involve statistical data, thoroughly check the figures for a precise and accurate presentation of data. Afterward, save the file. To do so, click File > Save As, then choose a format and click Save.


