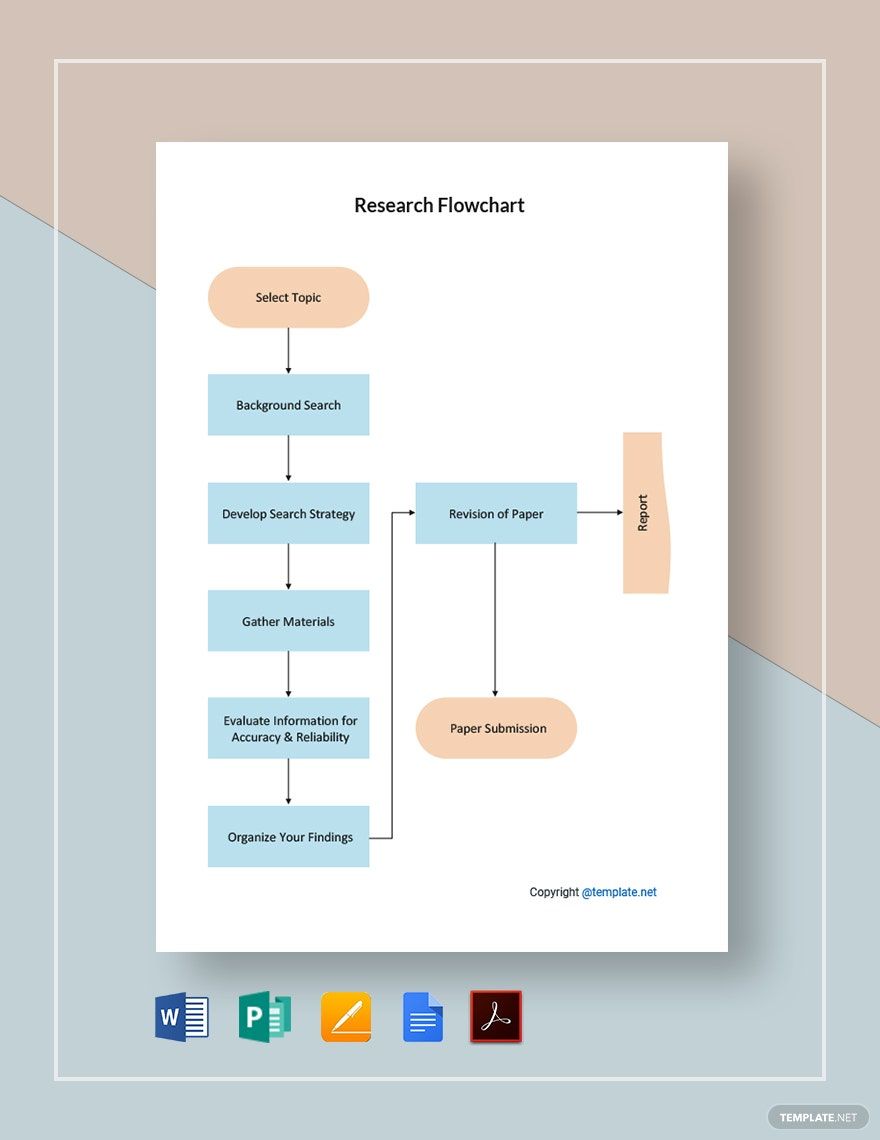
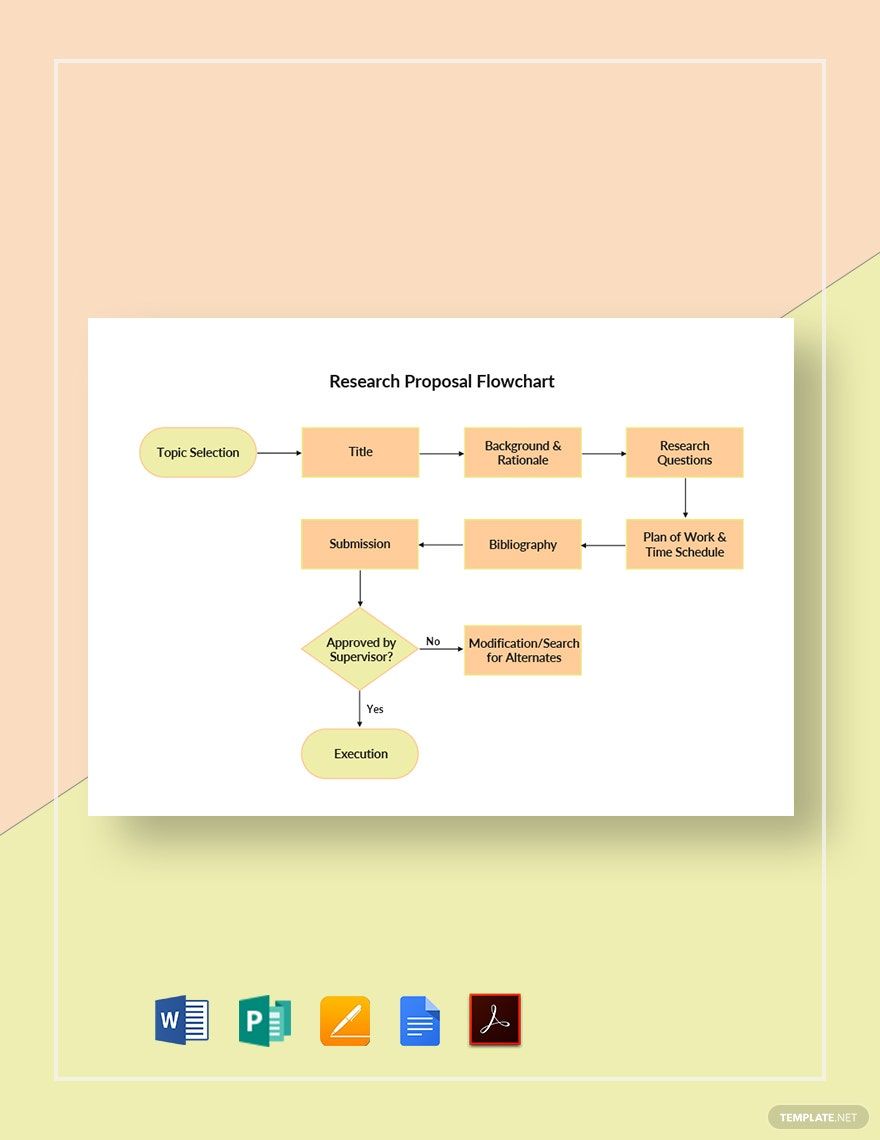
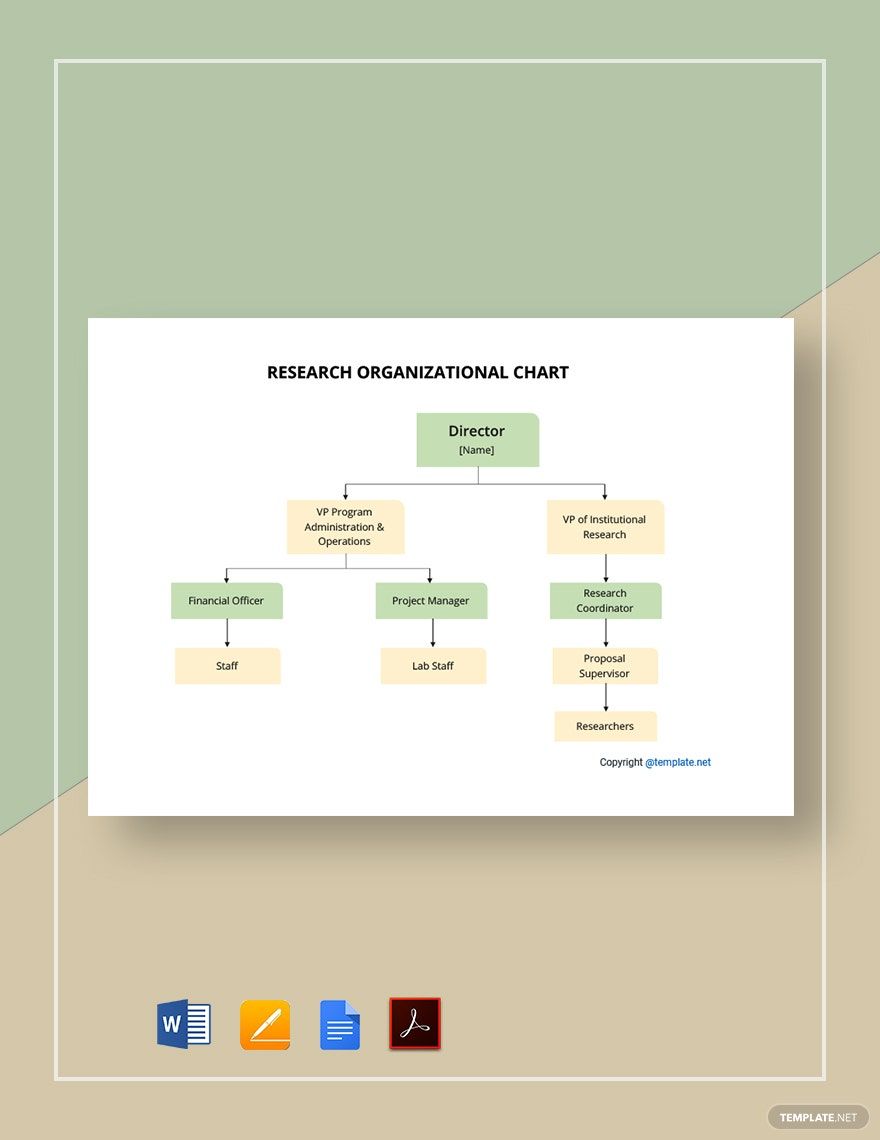
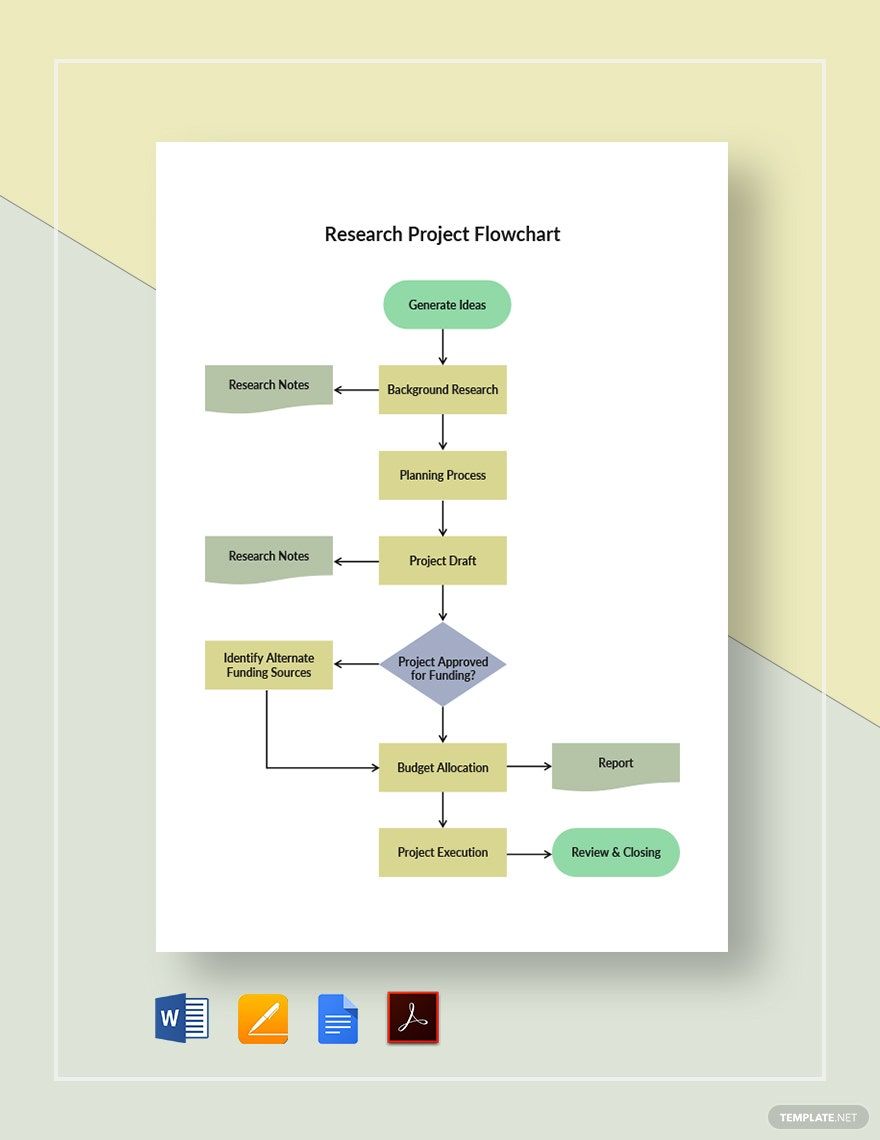
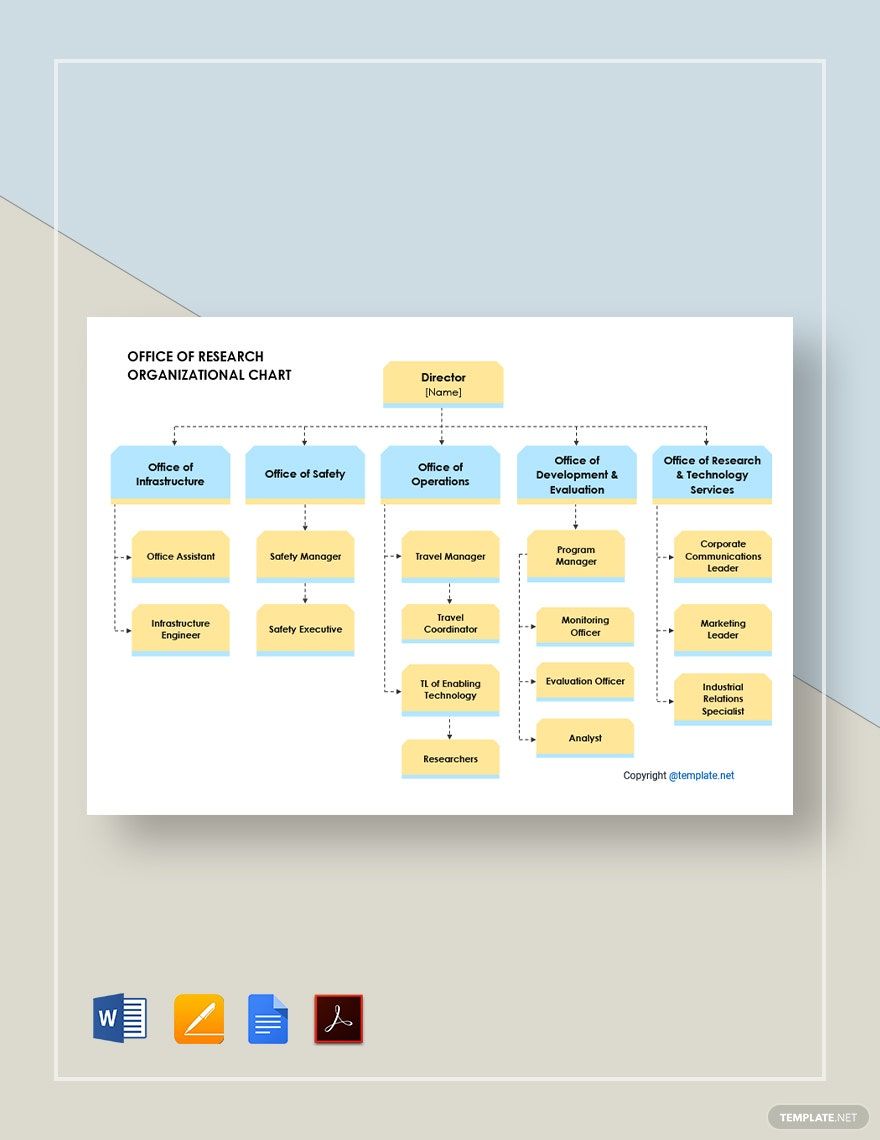
Be it for a case study, advertising process, or medical evaluation, conducting research requires well-planned procedures and coordination. Because of this, it’s a good idea that you implement the help of a flowchart into your work. With a flowchart, you won’t have much problem sorting out an effective research methodology. Looking to cut down on the time and tedium? Then look no further than our professional Research Flowchart Templates! Use our content for genealogy, quantitative research, education, and more. Plus, you don’t need to worry if you’re on macOS, as our samples are compatible with Apple Pages. So, download today and easily make your own research diagram!
How to Make a Research Flowchart in Apple Pages
When it comes to doing a study or research, there are several management tools that help get the job done. One of these is the flowchart, which is good for figuring out your research procedures.
As described by Chron (a business-oriented publication), a flowchart’s simplicity makes it highly versatile for all kinds of uses. So, from science to history, this diagram is useful for whatever you need to research.
Creating a flowchart involves implementing certain symbols. Have a read through our tips (below) to find out more!
1. Prepare Your Research Flowchart’s Page
First, the page layout needs some adjusting.
Go ahead and open a new document in Apple Pages. In the side toolbar (on the right side), open the Document menu, and then turn off the Document Body option. Confirm switching to a layout document and your document page is ready for making a diagram!
2. Add a Descriptive Title to Your Research Flowchart
To start putting together your research flowchart, insert a text box for the title.
In the upper toolbar, click on the Text icon and place the fresh text box at the top of your document. Highlight the text box and start typing in a title that informs readers about the chart’s contents. Enter a title akin to “Patient Case Study Process” or “Legal Data Collection Project.”
3. Use Shapes for Your Research Flowchart’s Symbols
The primary aspect of any flowchart is the different symbols found within. To add these symbols, access the Shape menu in the upper toolbar. After selecting where a shape goes, simply click on it to start writing down each step in your chart.
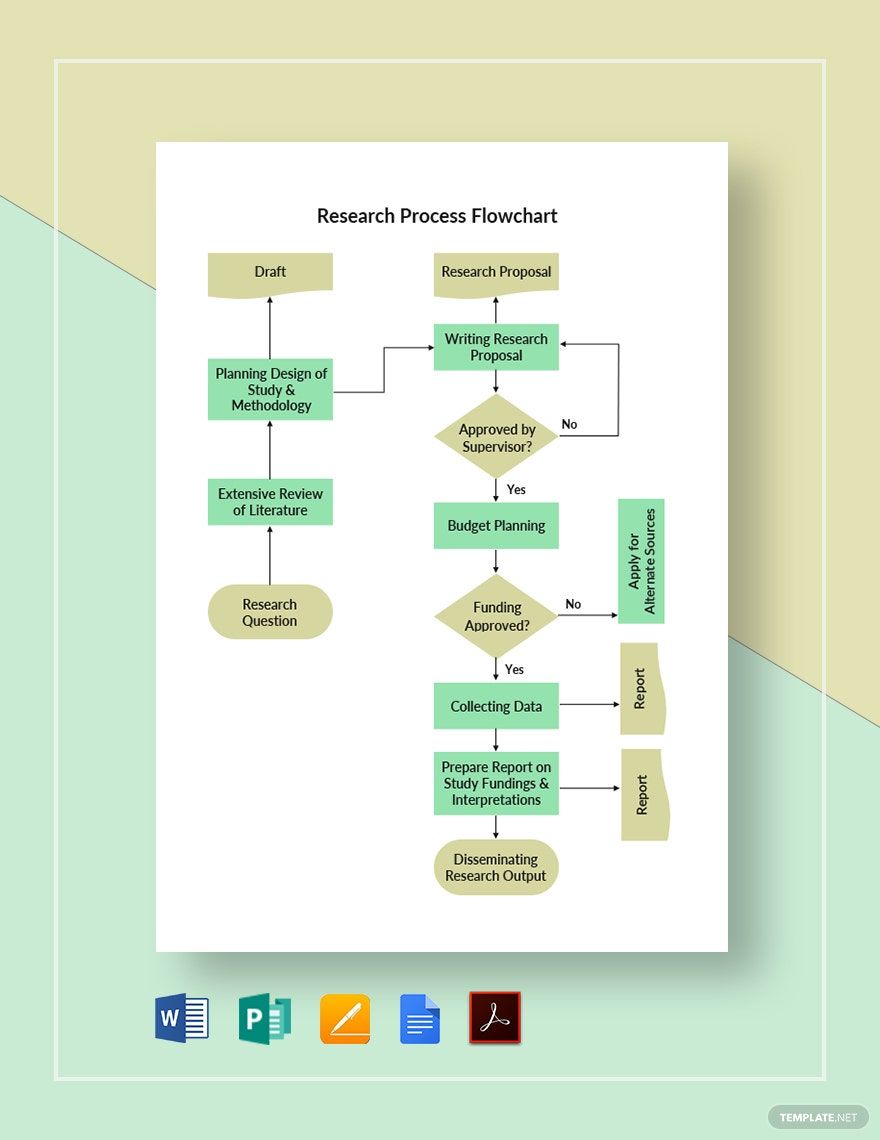
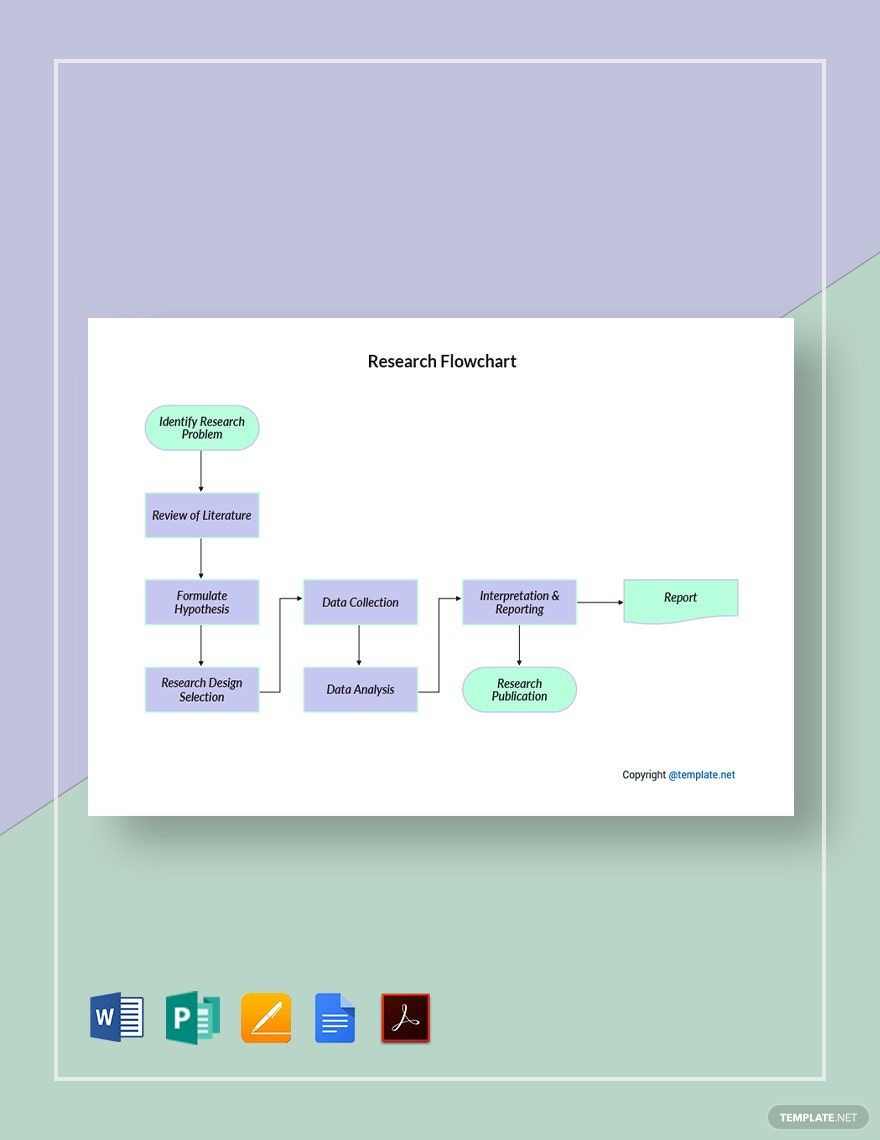
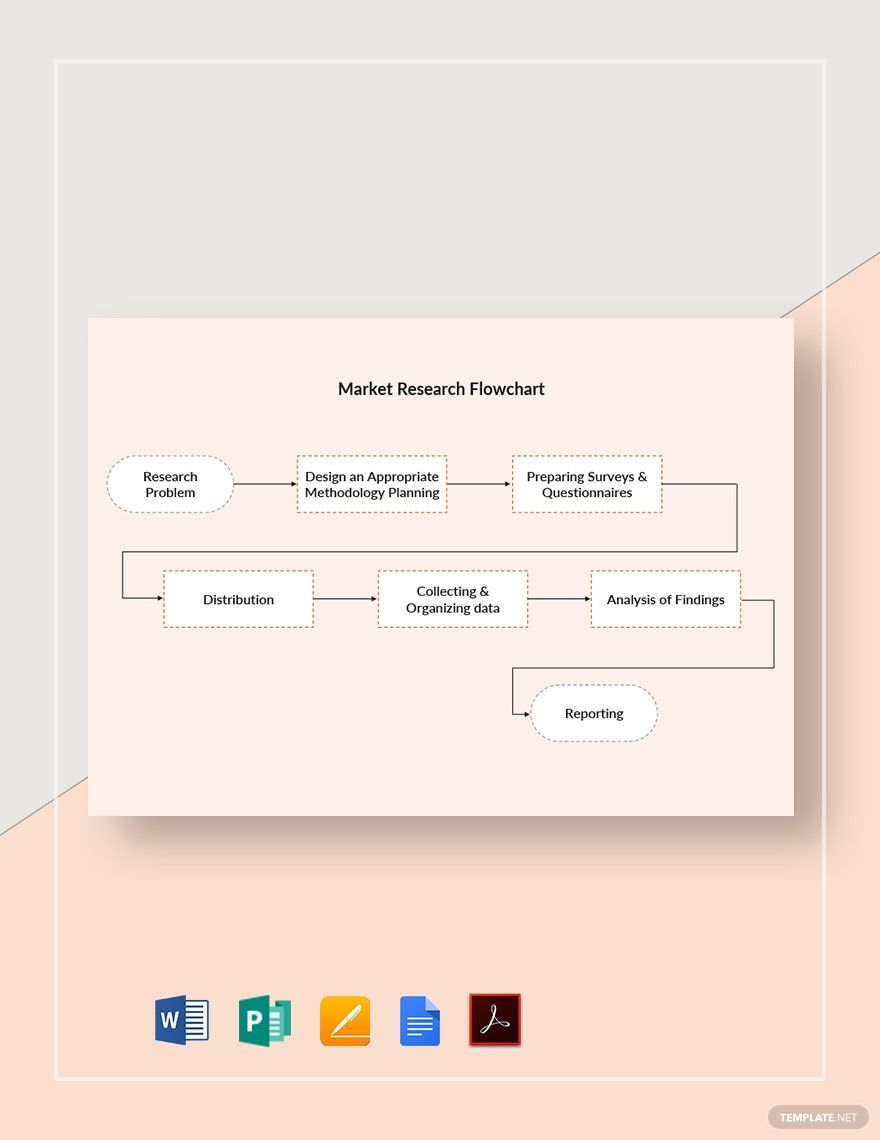
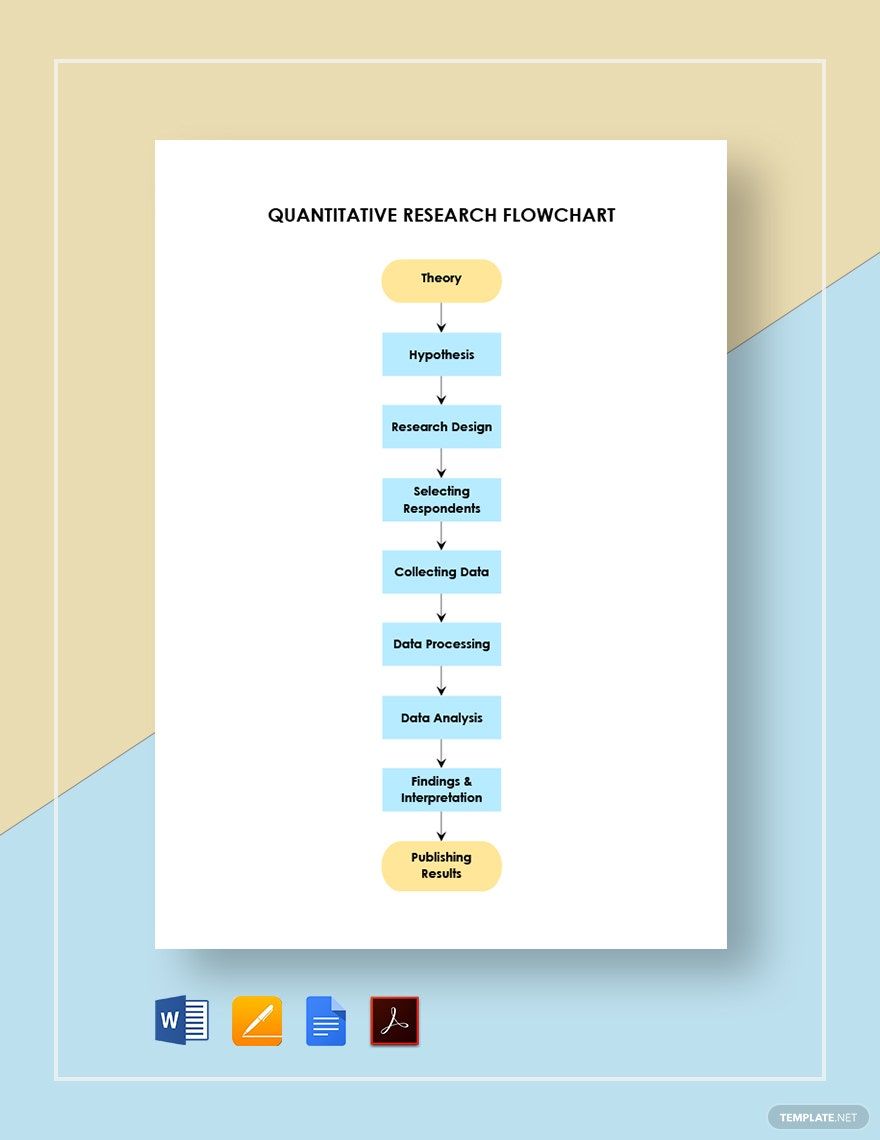
The first shape you need is the oval, which is used as the start and end of a workflow. When representing your process’s actions, use rectangles. For both inputs and outputs, there are parallelograms. And then use diamonds for decisions, which lead to different paths.
4. Link the Steps in Your Research Flowchart
Use lines when showing the flow from one step to another.
CMD+click two shapes to highlight them at the same time. Next, go to Insert (at the top of Pages’ window) and open the Line menu. Pick either the Curve or Elbow Connection Line, which gives the selected shapes a self-adjusting line that links them both together.
And with that, you’re now ready to make diagrams for your research procedures. Don’t forget to download one of our Research Flowchart Templates to expedite your document creation!


