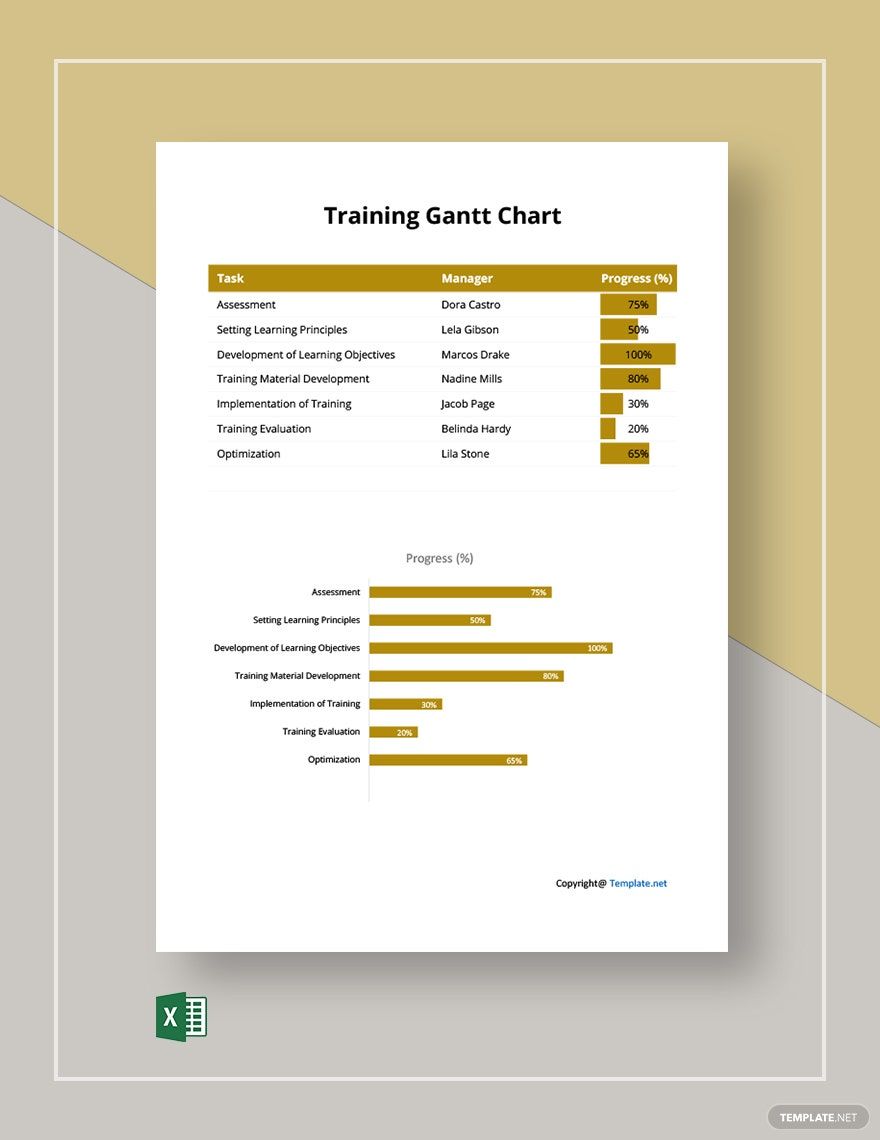
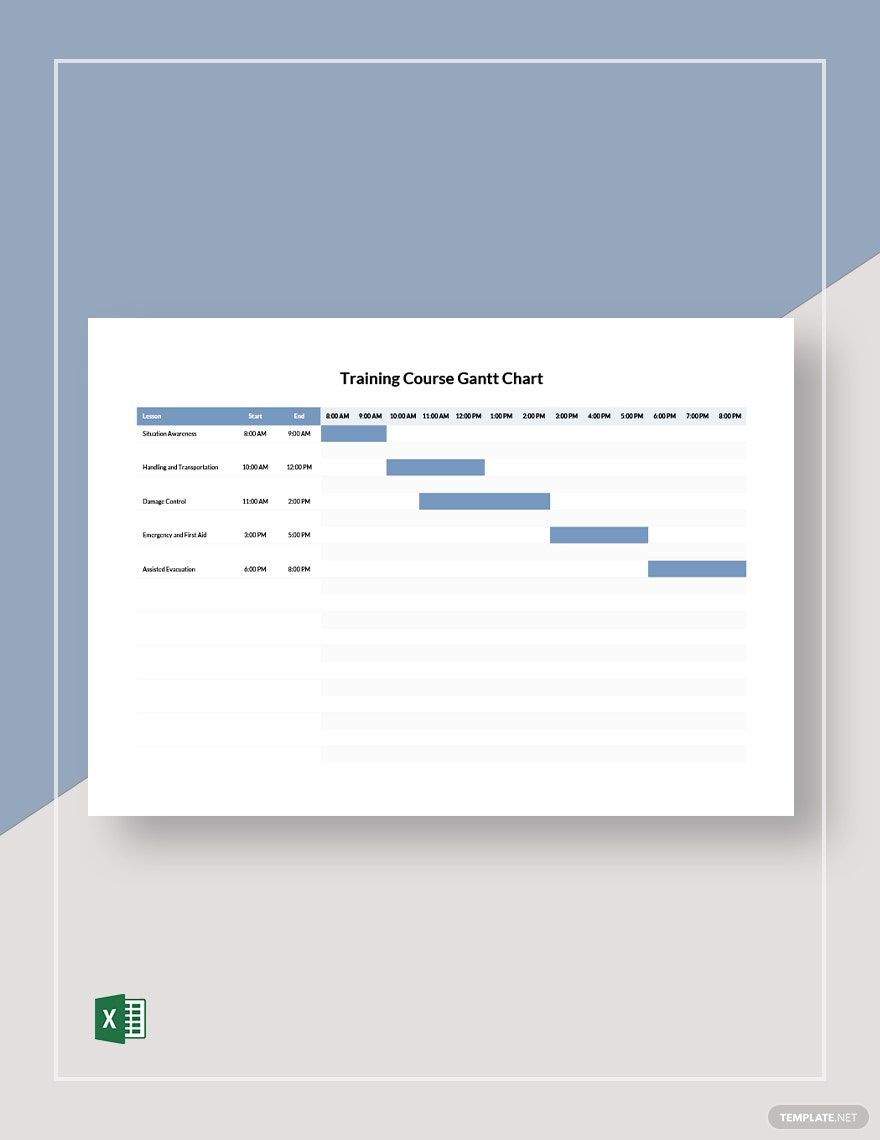
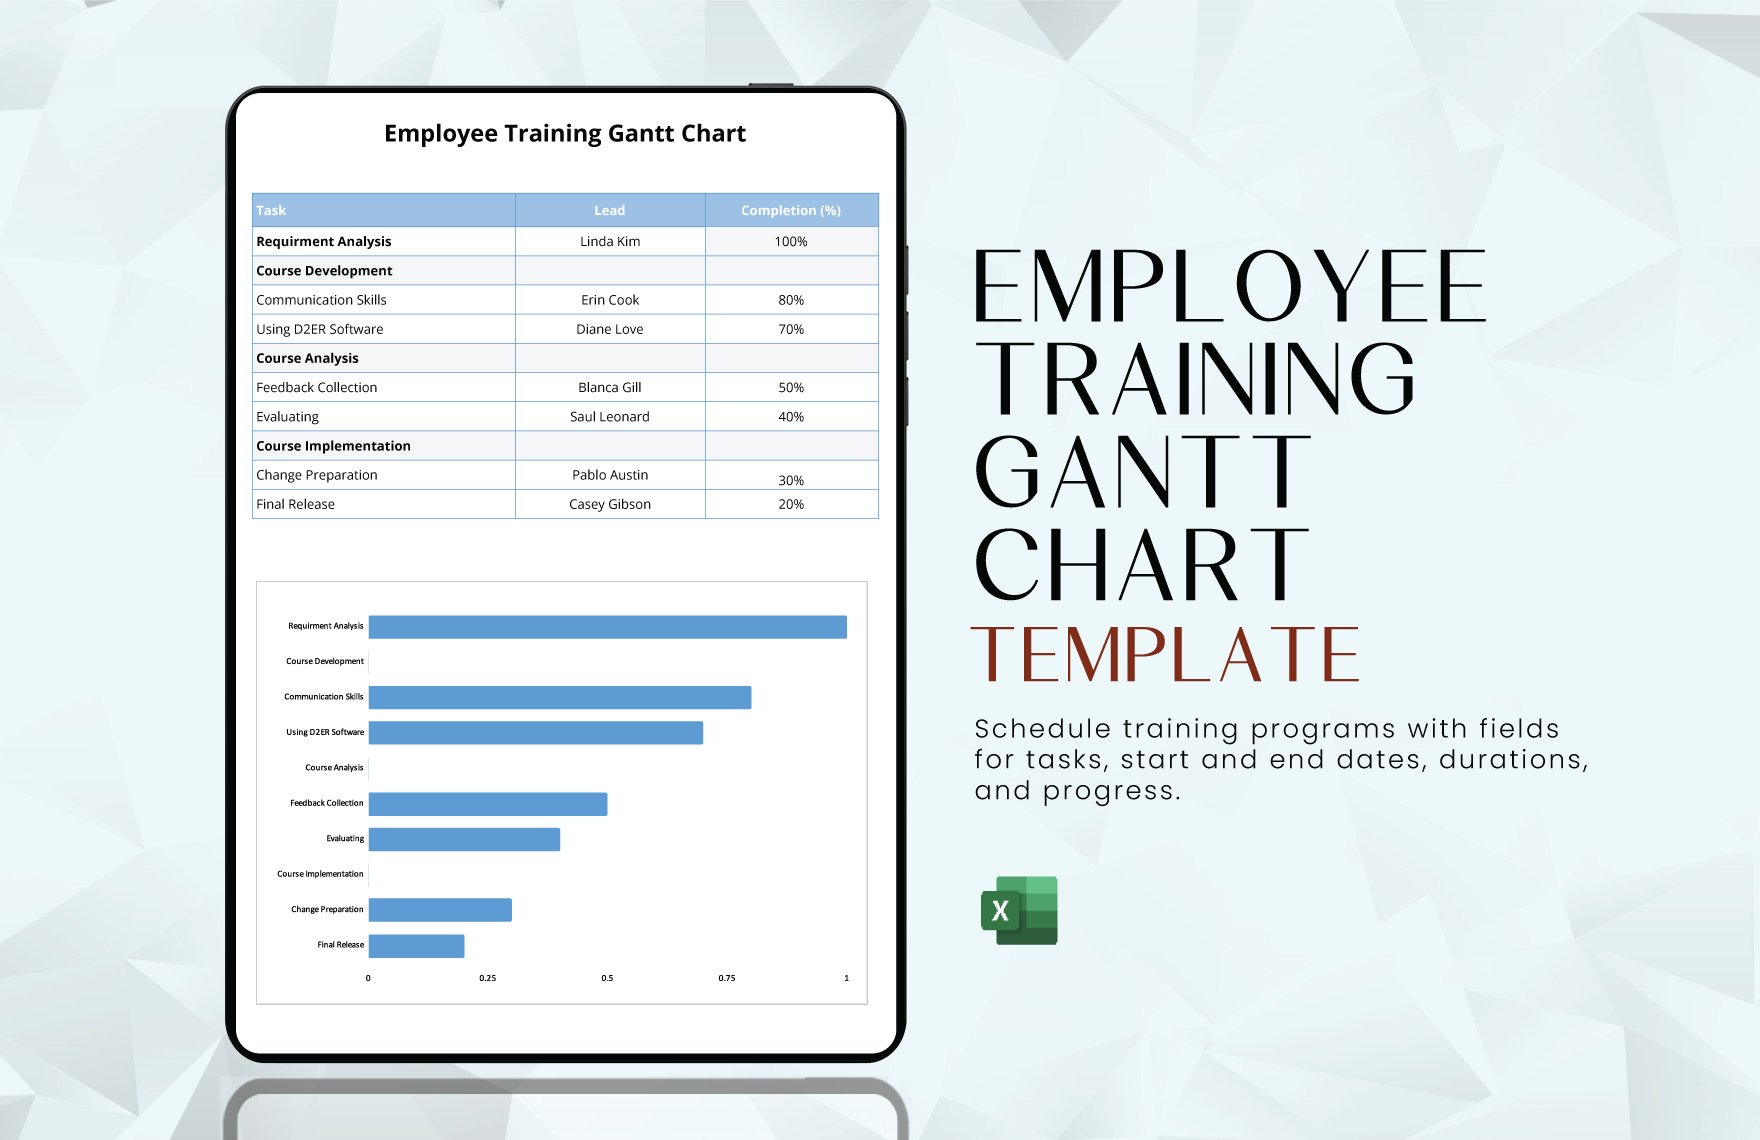
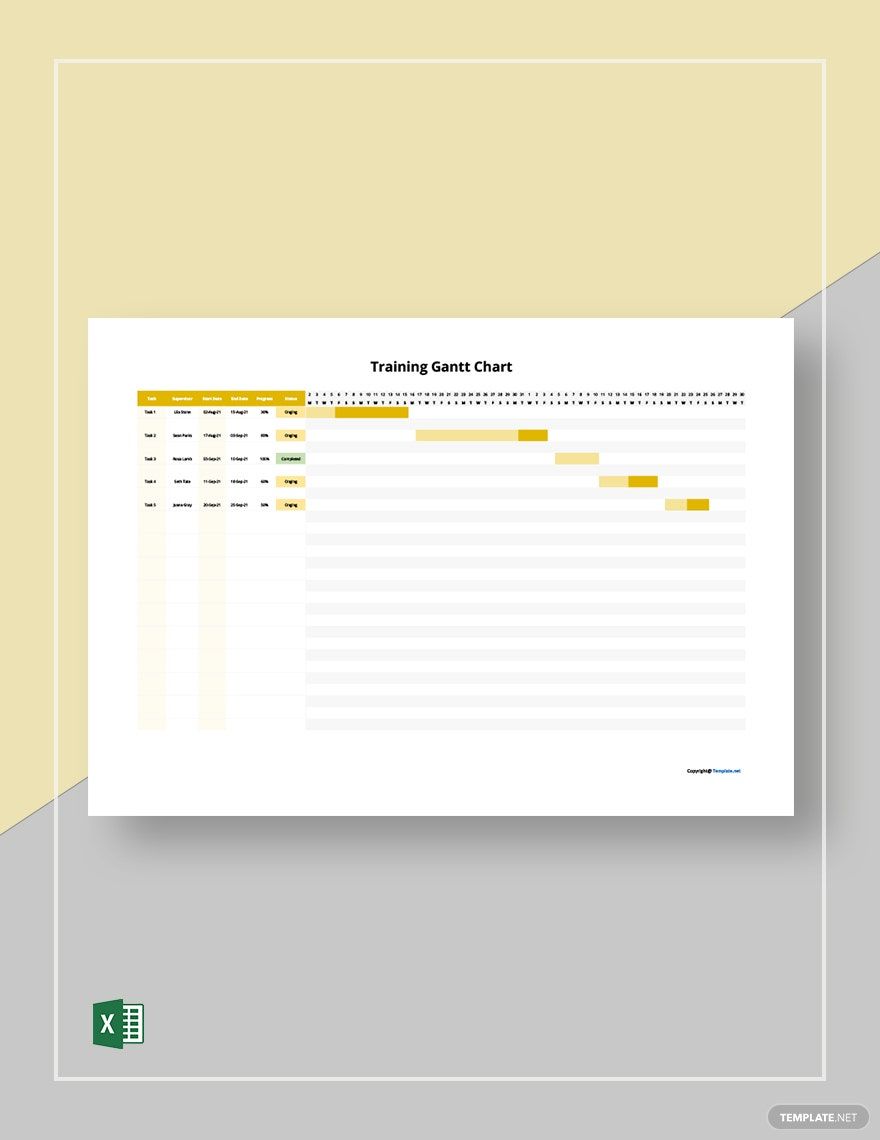
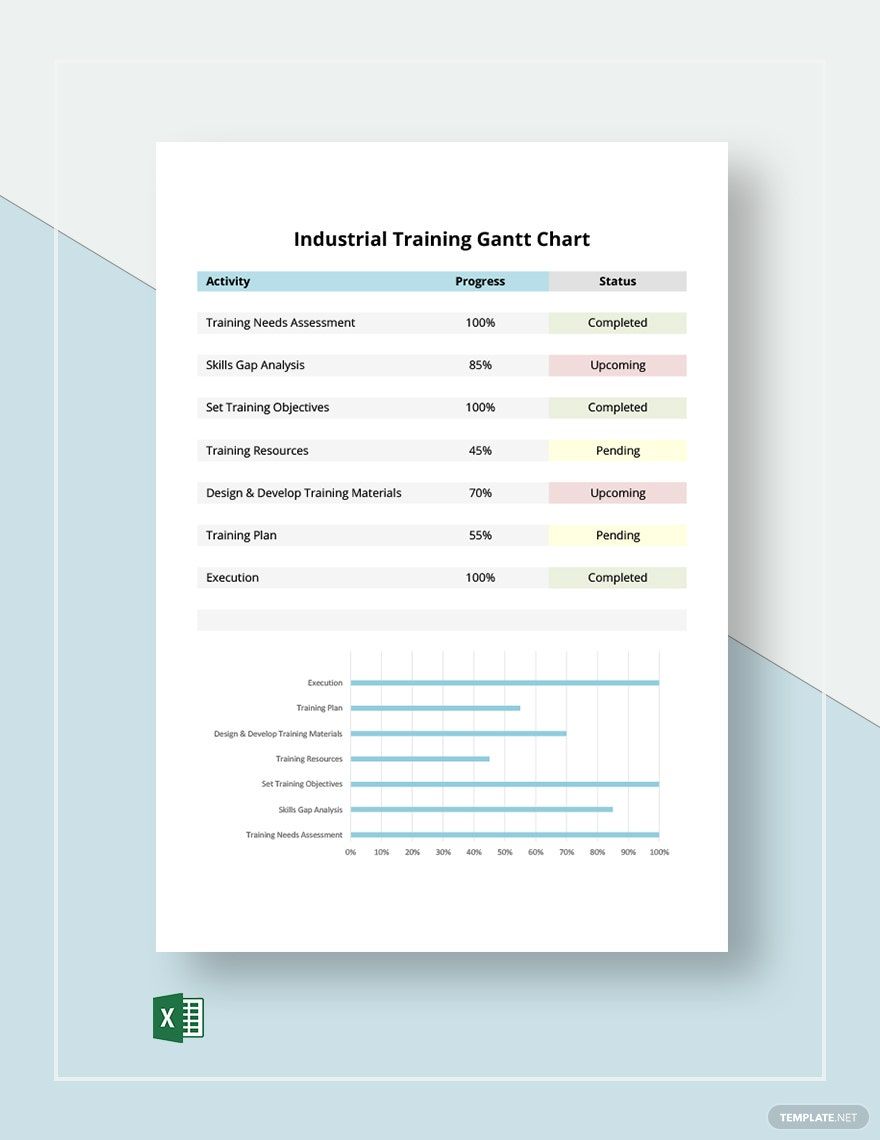
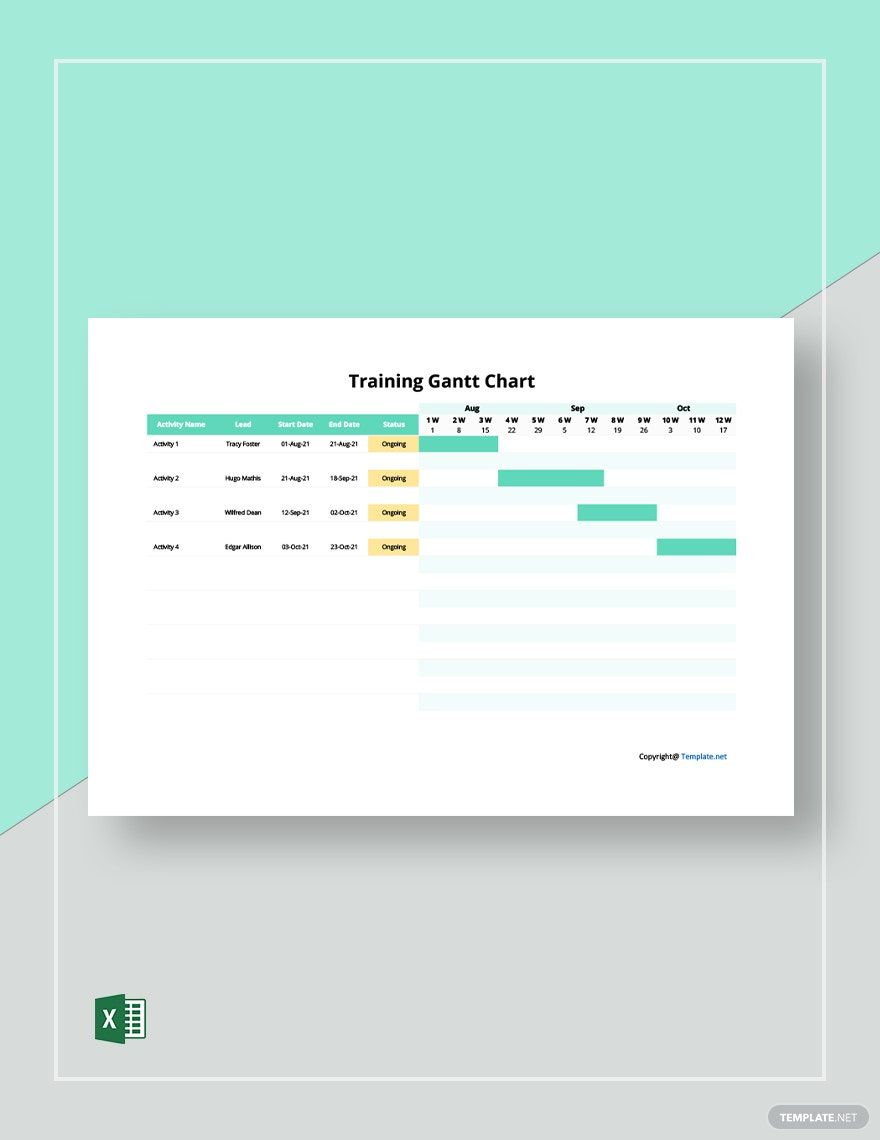
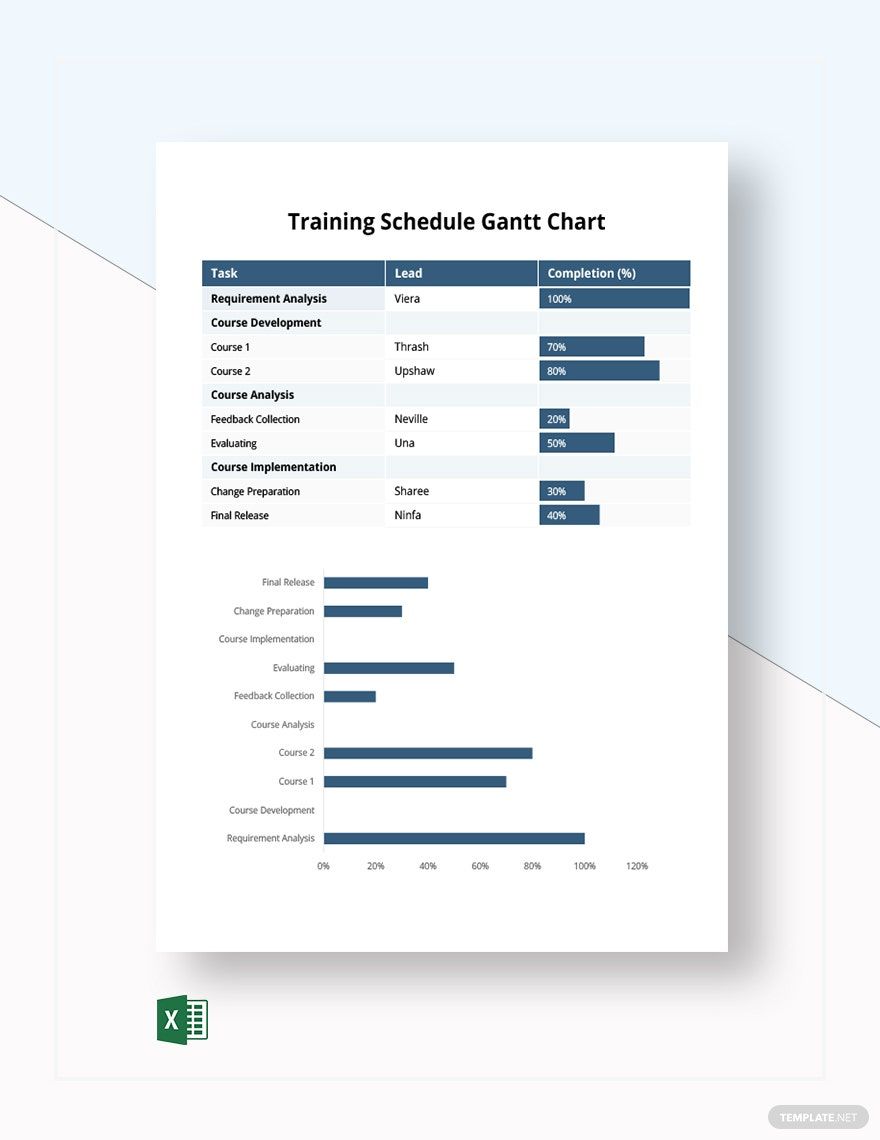
Training sessions are common in workplaces and learning facilities. Regular training helps sharpen a person's knowledge and skills in a specific field of expertise. When conducting training sessions, it's best to make use of a Gantt chart. This way, you'll have more control over the activities and its duration. If this is what you're after, check out our Training Gantt Chart Templates in Excel. These high-quality and easily editable products are perfect for project management and setting a work plan. Manage your training schedules now by subscribing to our wide array of ready-made products!
Training Gantt Chart Templates
Get creative and organized with customizable training Gantt chart templates. Free, professional designs that are printable. Start now!
Formats
- Excel
What Is a Training Gantt Chart?
A Training Gantt Chart is a specific type of Gantt chart that companies and schools use when conducting training sessions. Like any other Gantt chart, this one focuses on visualizing the activities and schedules. However, this one leans more towards identifying the training sessions and determining how much time each one needs.
How to Create a Training Gantt Chart?
Training Gantt Charts help keep track of the pace of the activity. Before you conduct a training session, make time to go through our Gantt chart guidelines below.
1. Identify Who and How Many People Will Attend
Since you're planning to conduct a training session, the first thing that you need to do is identify your audience. Who are you going to train? And how many people will attend the training session? These are some of the most common questions that you need to answer before proceeding to the next step.
2. Determine the Activities Involved in the Training Sessions
Once you've identified your audience, the next thing is to identify the activities that will take place during each session. If you're training employees, for example, you can mention skills enhancement, event planning, to name a few. But if you're training students, the activities should lean more towards academics.
3. Set the Layout of the Chart
By now, you've probably finished gathering the necessary data for your Gantt chart. For the next step, start creating a simple yet manageable layout. In most Gantt charts, the left side contains a list of the activities, while the top lays out the timeline or schedule.
4. Input the Activities and the Corresponding Duration
Given that you're almost done with your basic chart, start inputting the data that you've just gathered. Begin by prioritizing the activities and writing them at the left of the diagram. Afterward, input the corresponding duration of each activity by drawing a progress bar.
5. Make Final Adjustments to the Layout and Data
Last but not least, go over your entire Training Gantt Chart and check if the layout is comprehensible. Apply colors on the progress bars to make each activity distinguishable. And in terms of data, check, if you've included all the essential activities and their corresponding schedules.
Frequently Asked Questions
Who invented the Gantt chart?
The Gantt chart was invented by an American inventor named Henry Gantt. He invented the chart to help people have a visual representation of a planning schedule while recording the progress of a project.
What are the advantages of using a Gantt chart?
- Gantt charts help make the activities and time frames easier to interpret.
- Gantt charts help in managing time and coordinating with the team effectively.
- Gantt charts allow you to arrange the tasks according to day, week, or month.
Do people today still use a Gantt chart?
Yes, many people still use the Gantt chart nowadays. It has long been proven to be an effective tool for managing tasks and schedules. Despite the many alternatives that people can use for the same purpose, Gantt charts are simpler yet still very reliable.
What are the features of a Gantt chart?
- The list of activities to be tackled.
- The time frame of the entire training session.
- Horizontal bars representing the progress or duration.
- Milestones that emphasize important occurrences.
Why are regular training sessions important?
For one thing, regular training sessions keep people up to date with changes in the system while introducing newcomers to it. Also, these ensure that their knowledge and skills are kept sharp.

