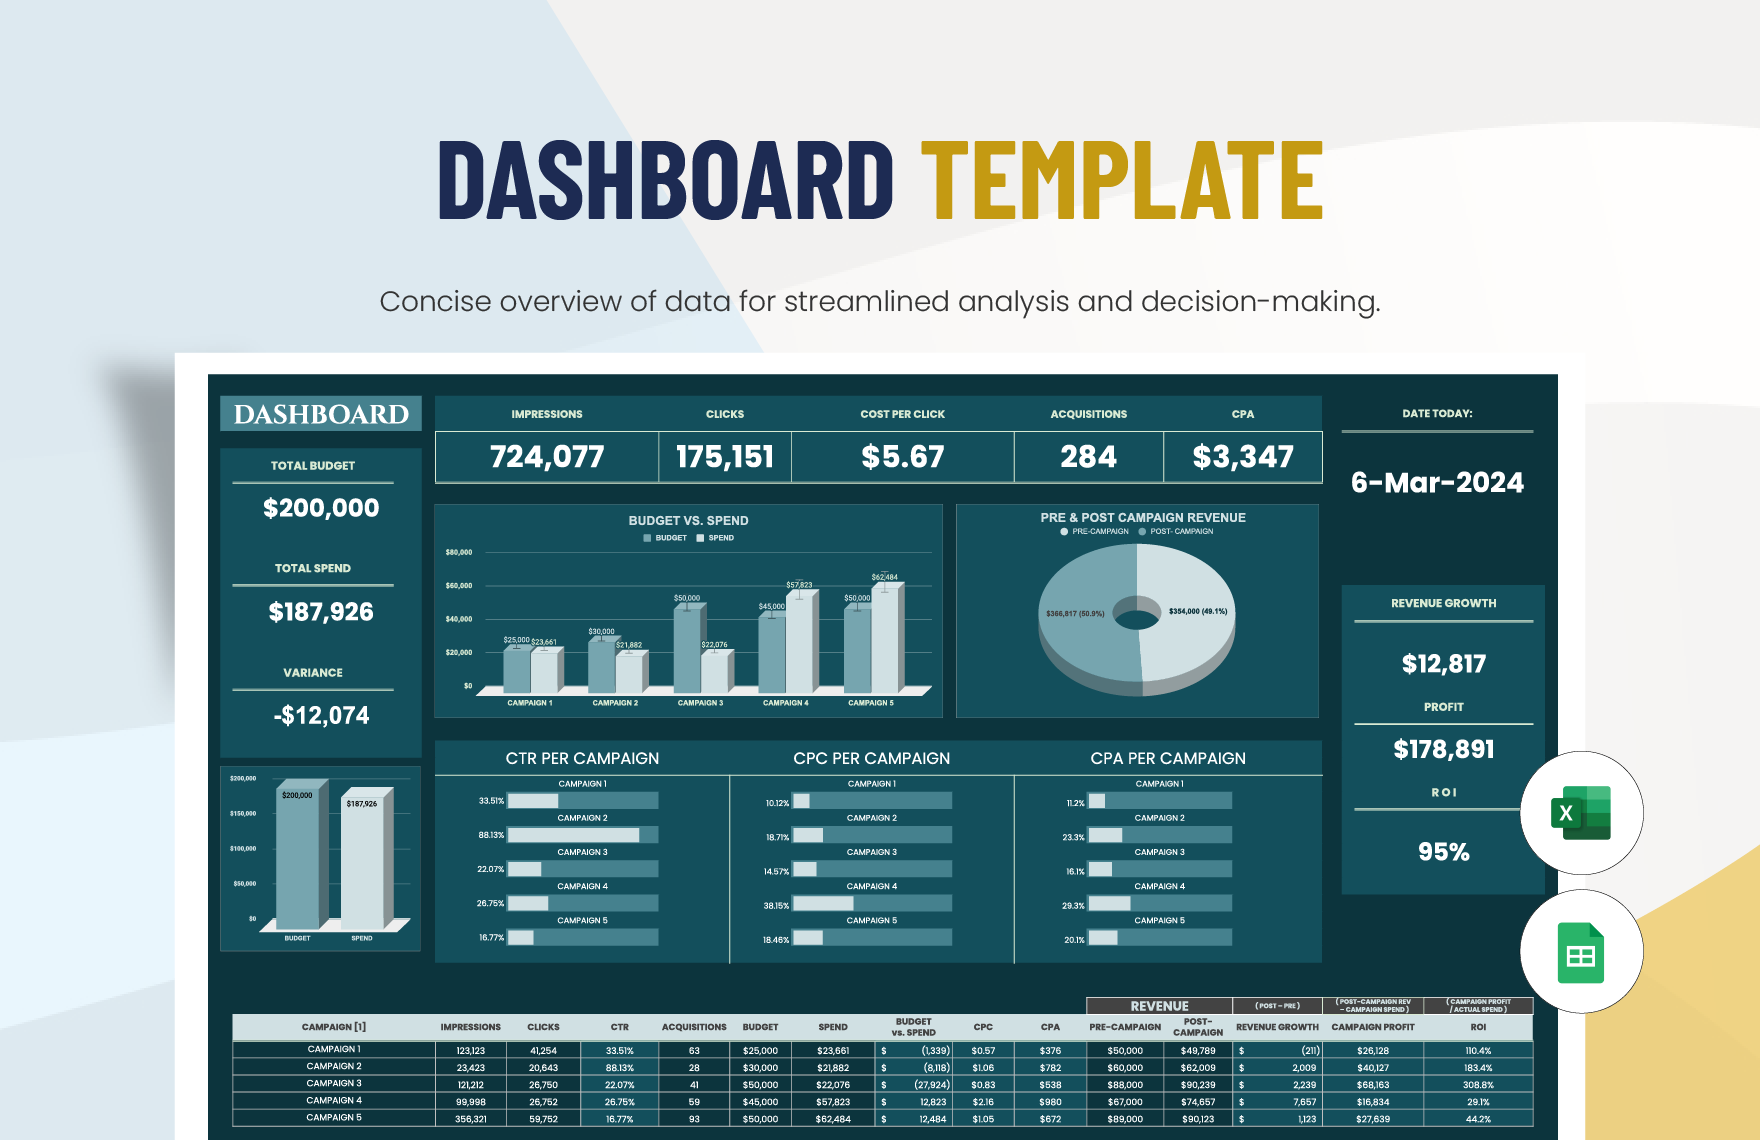
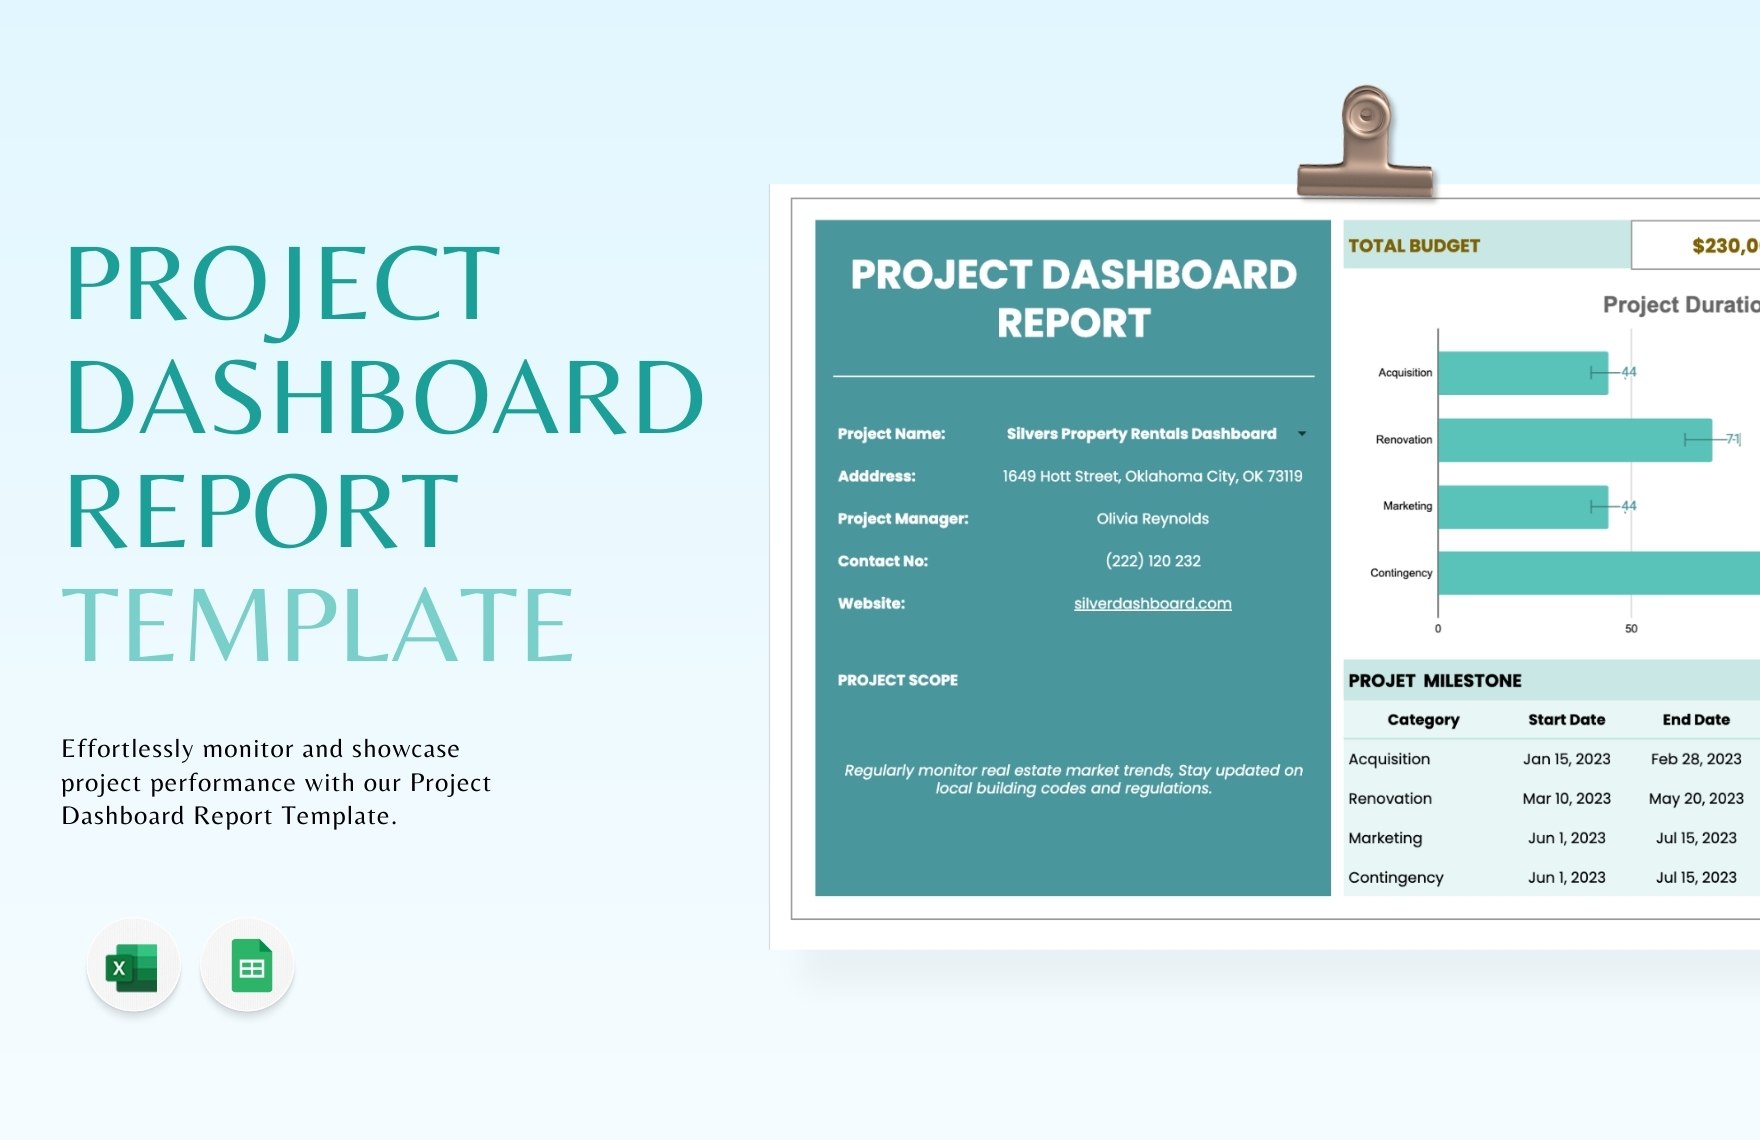
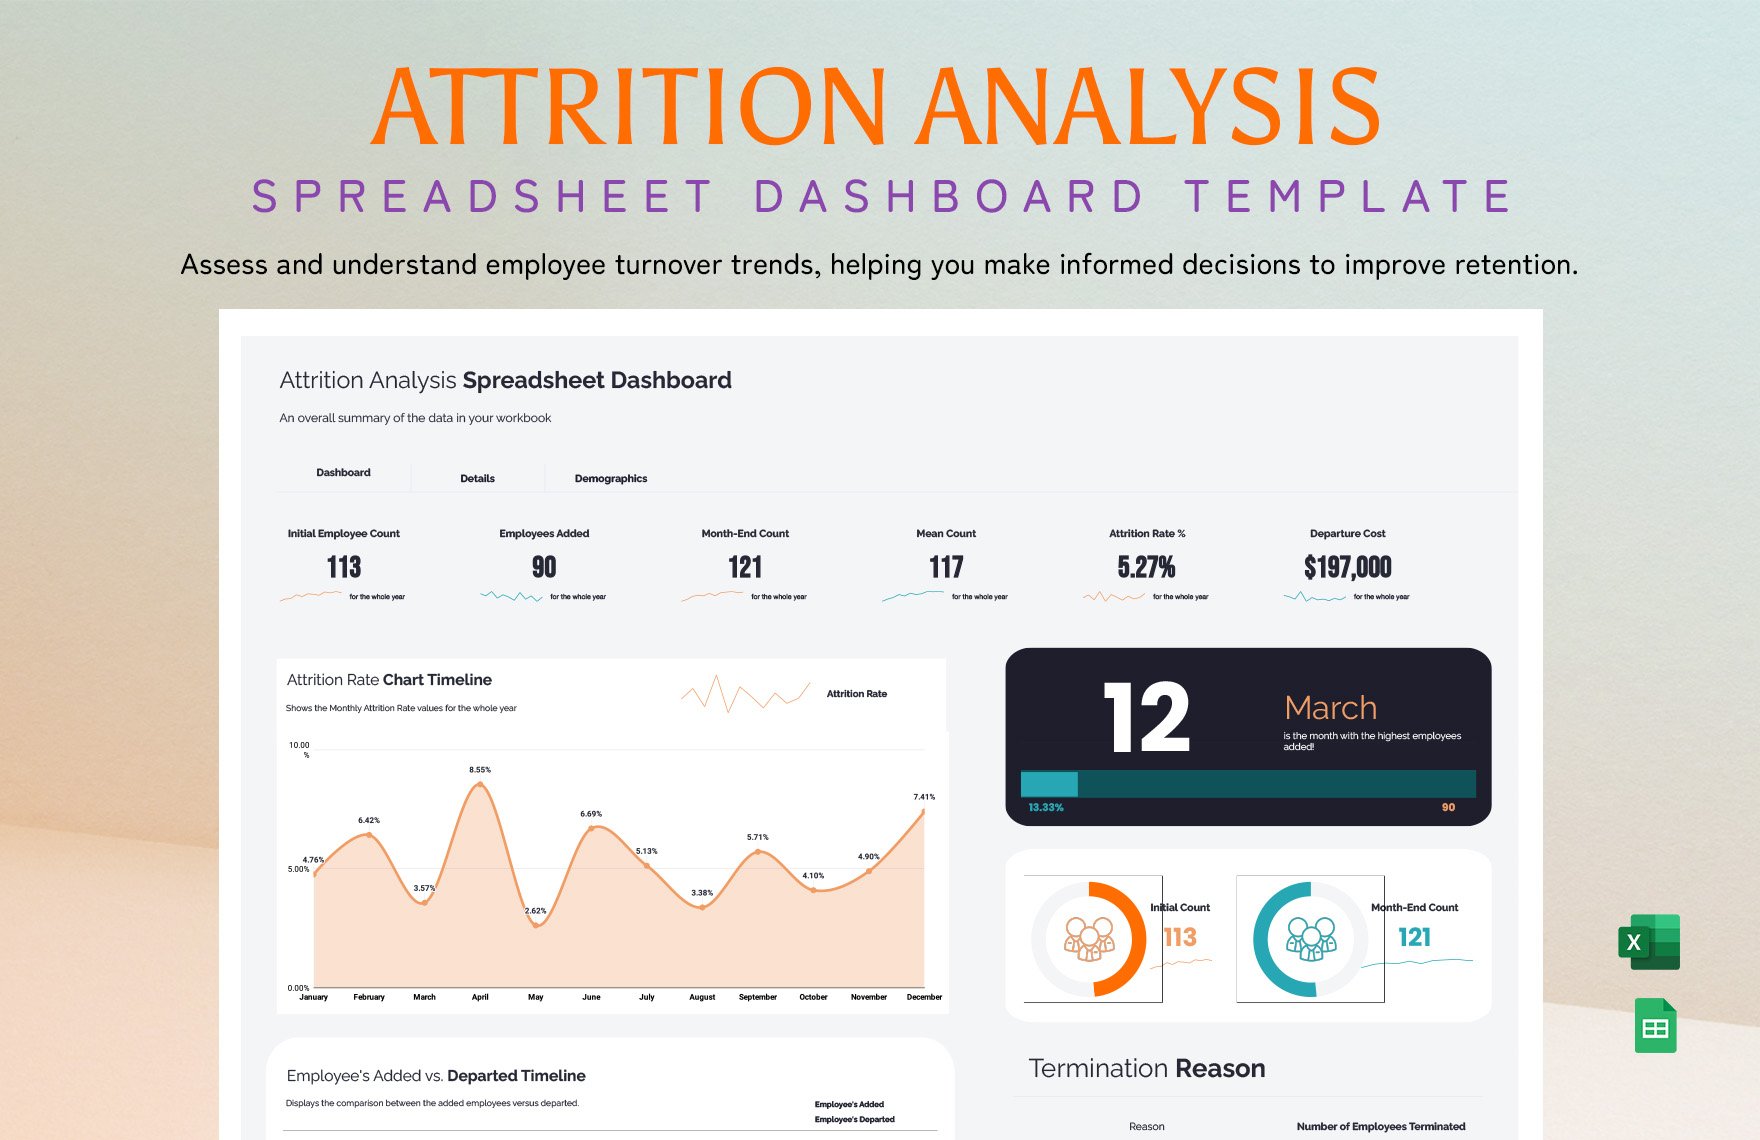
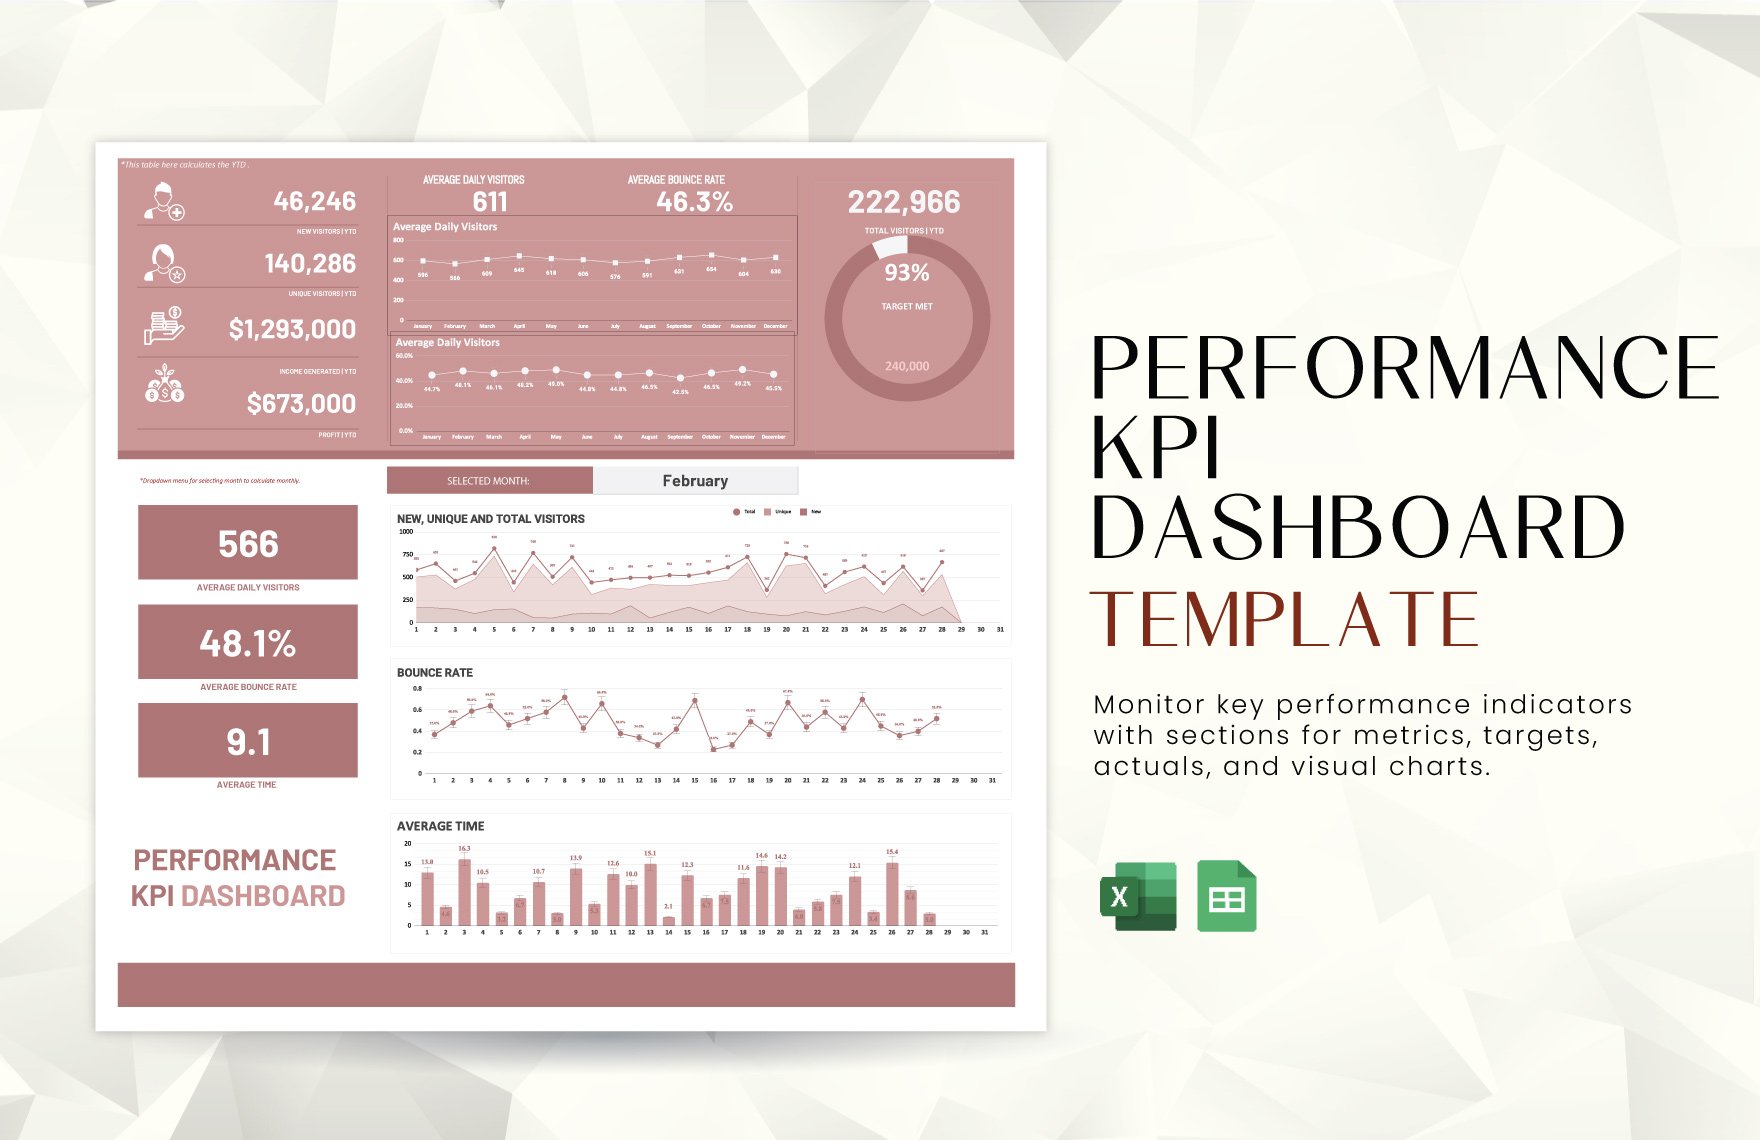
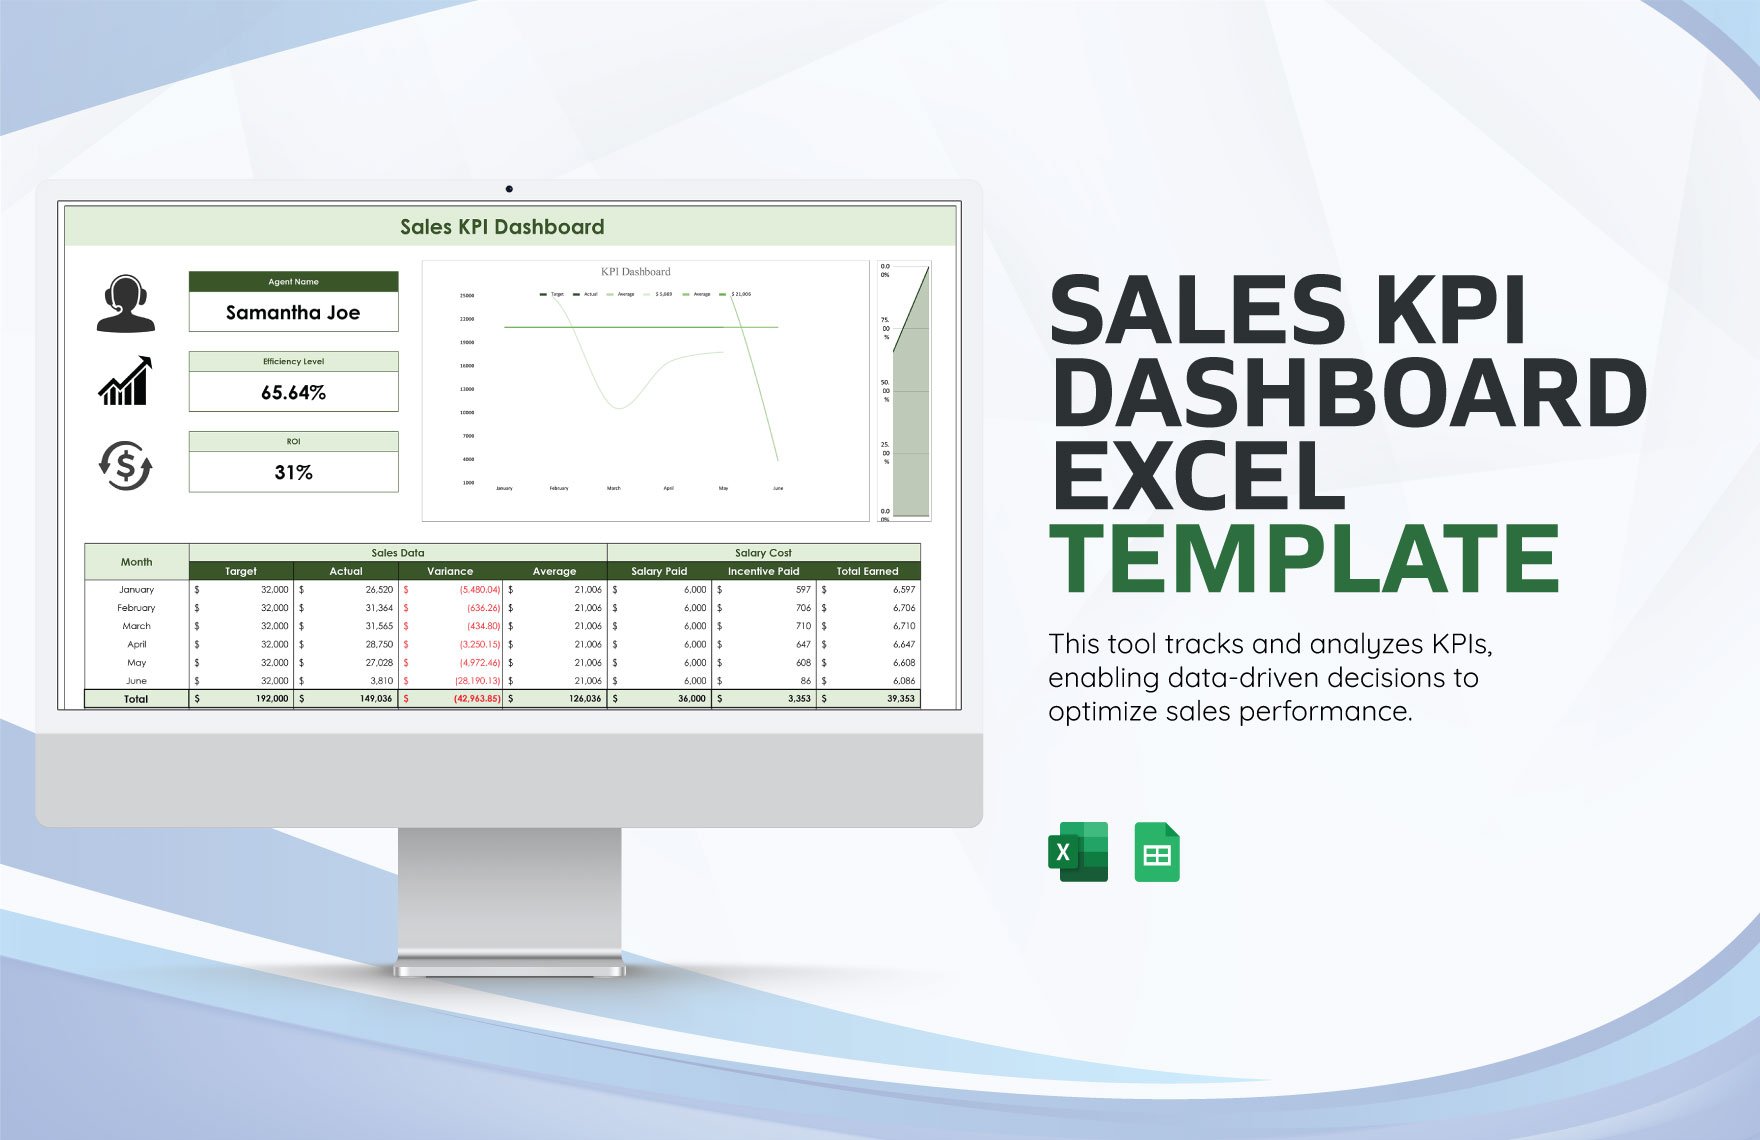
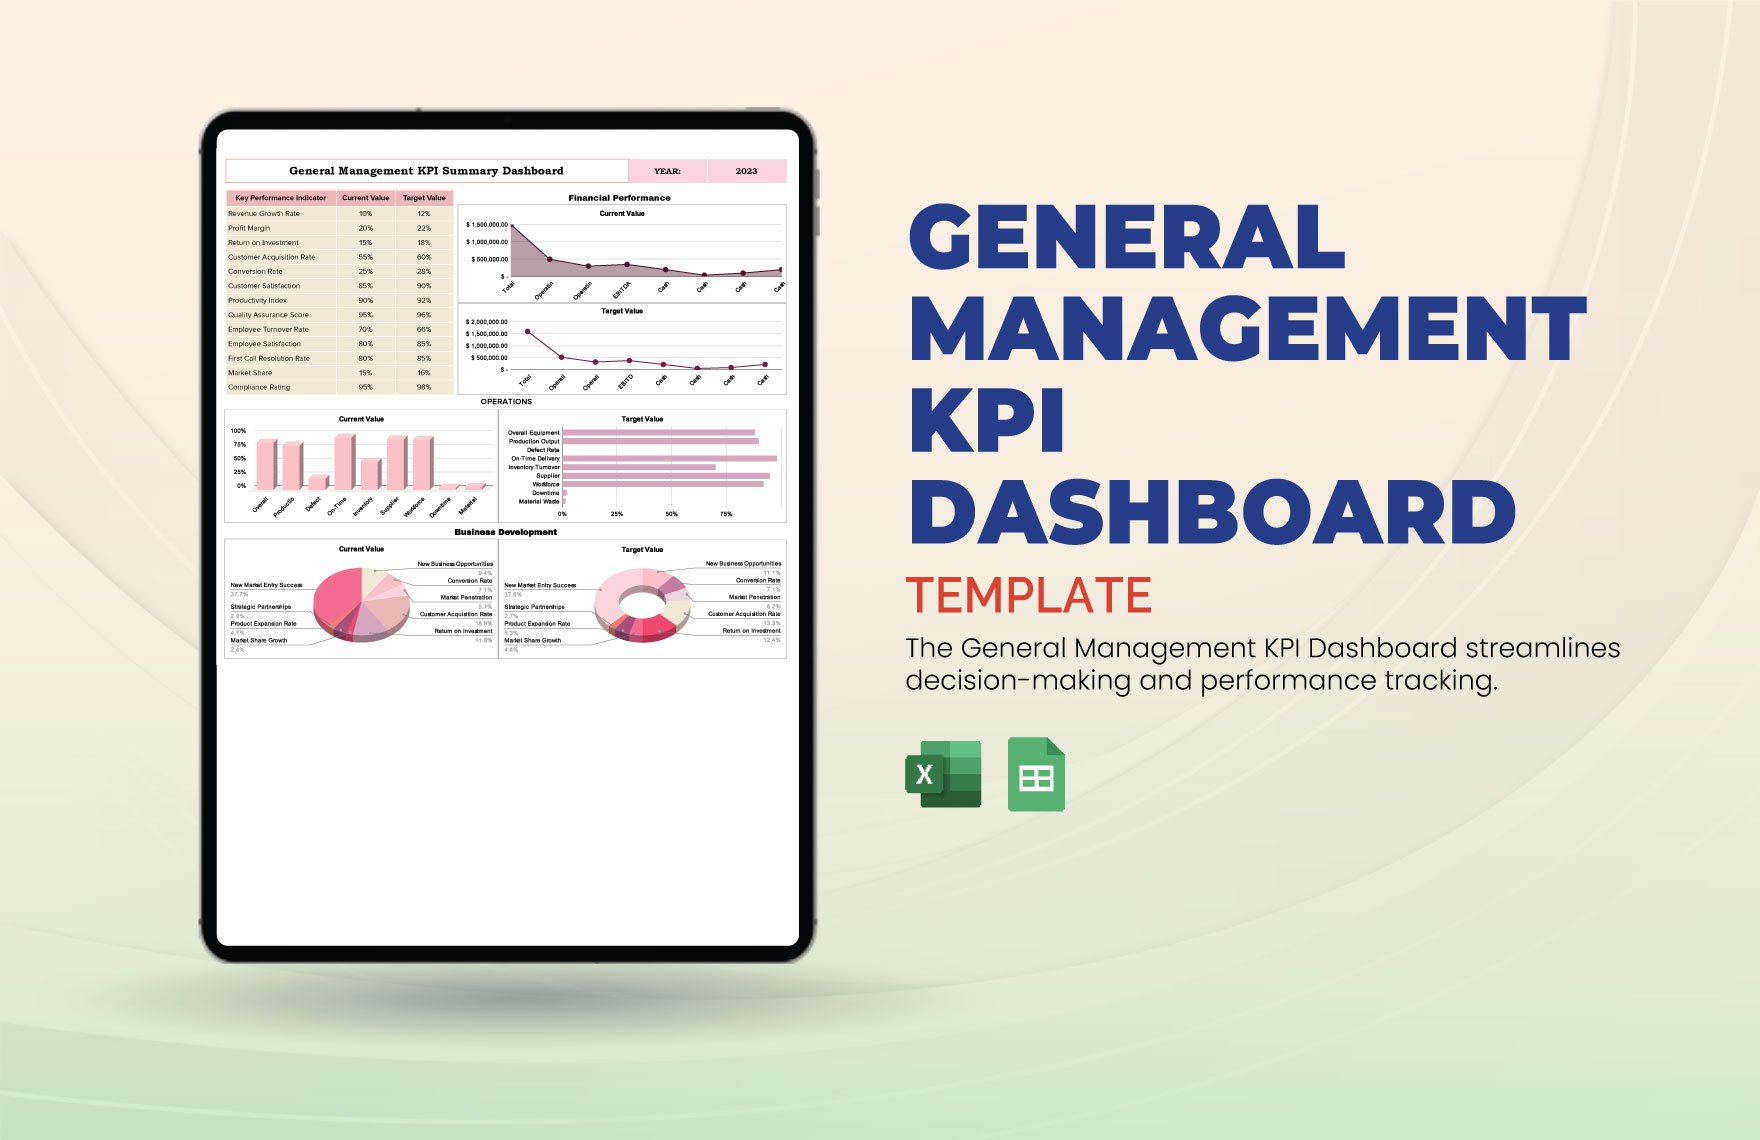
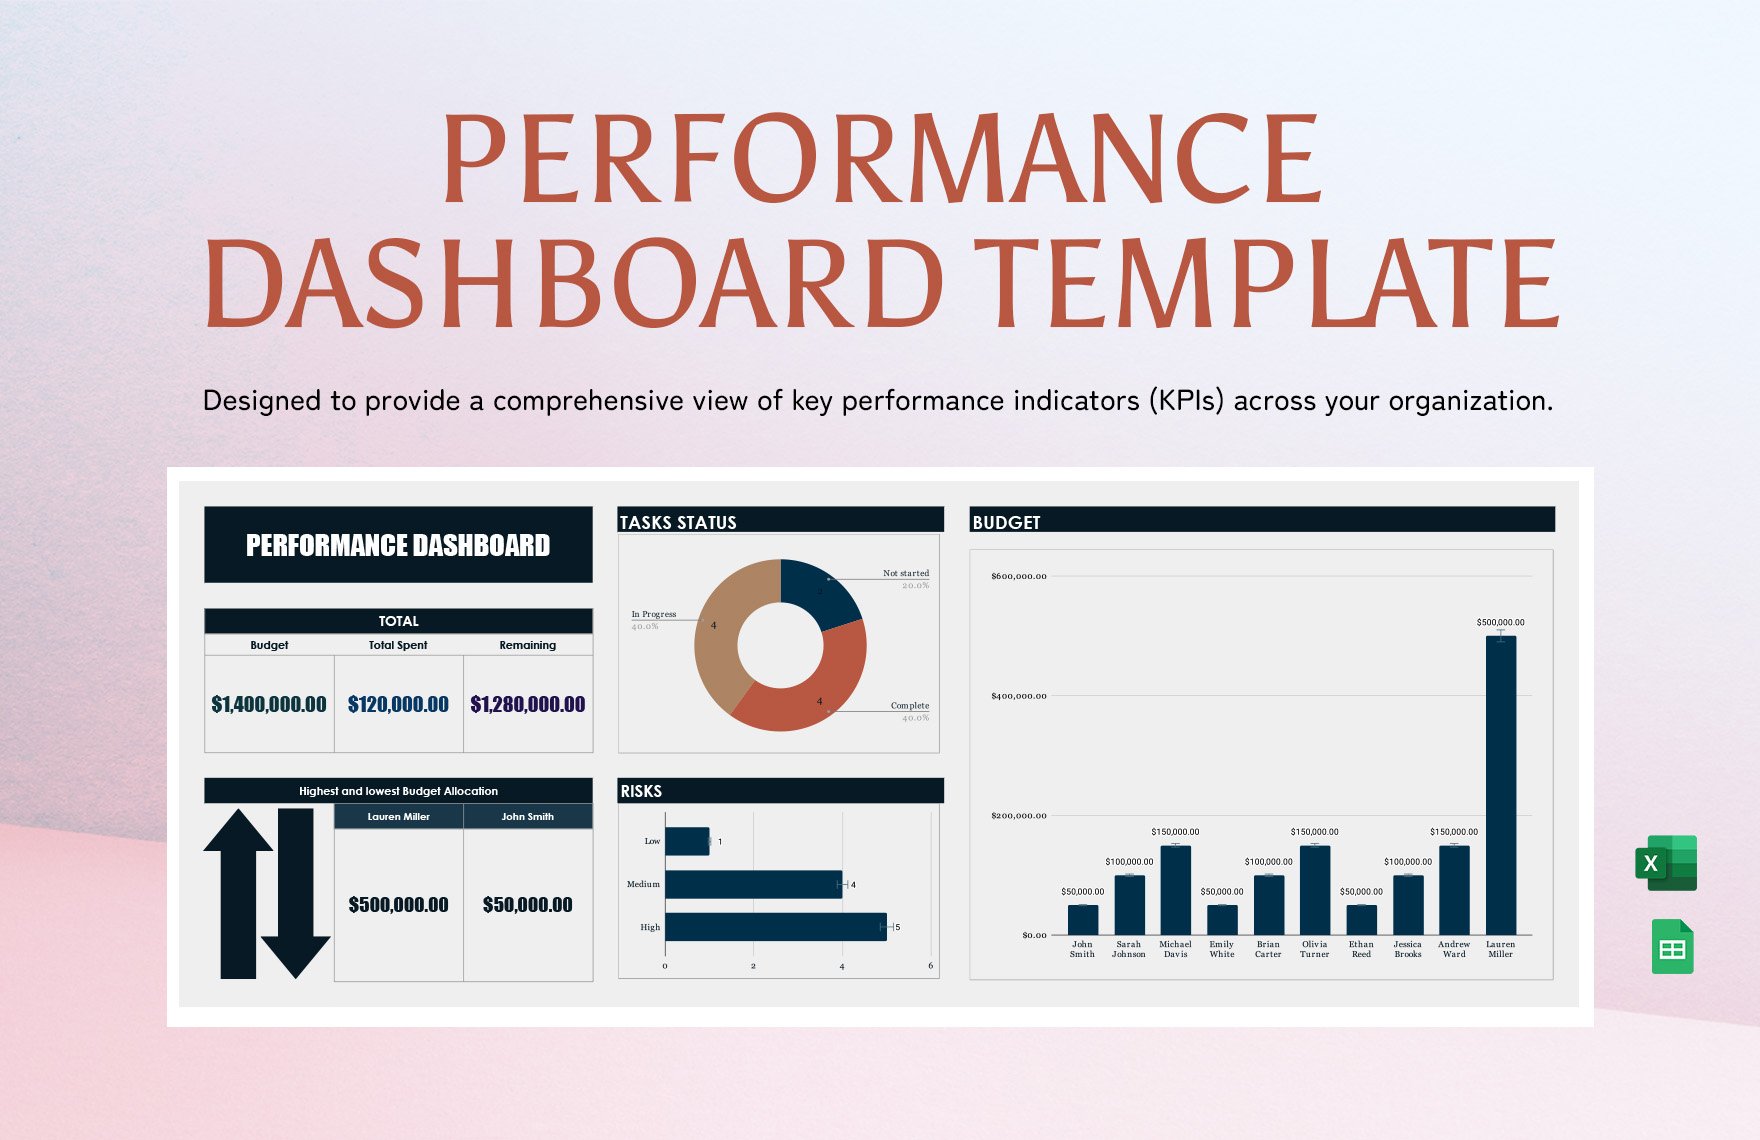
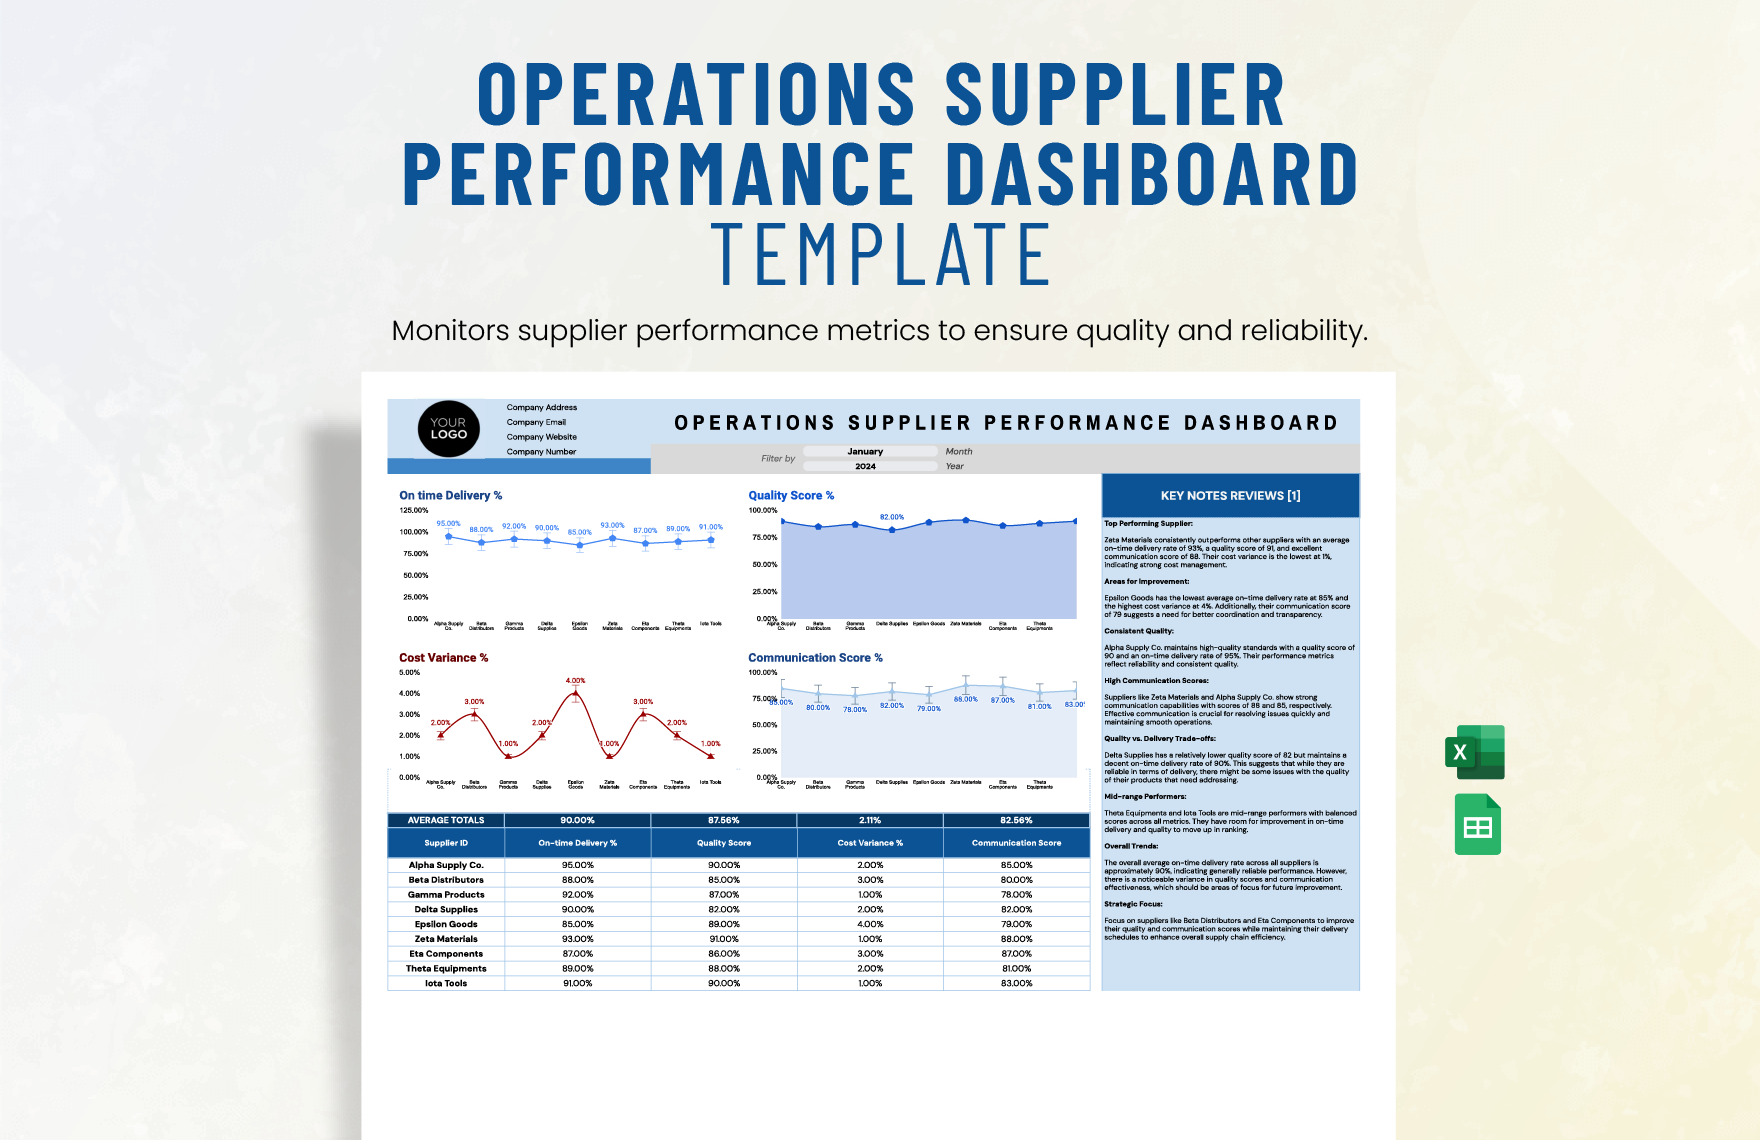
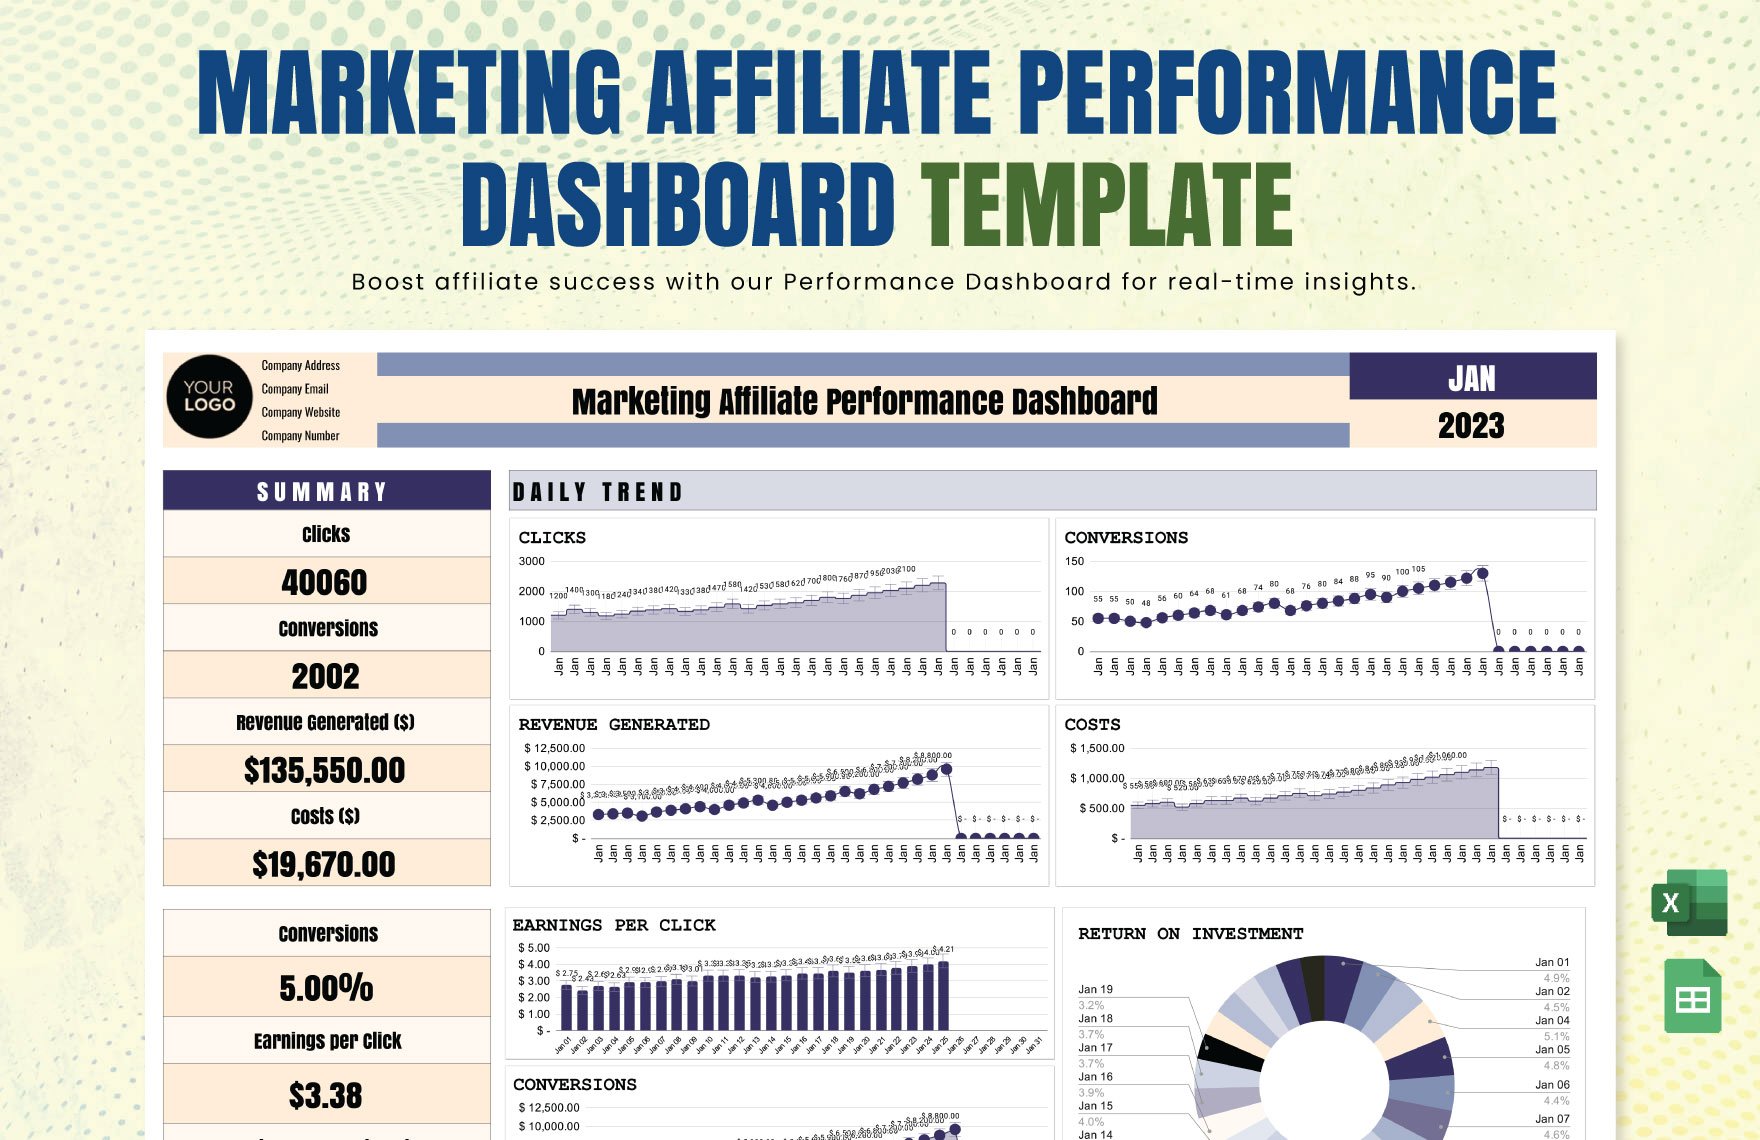
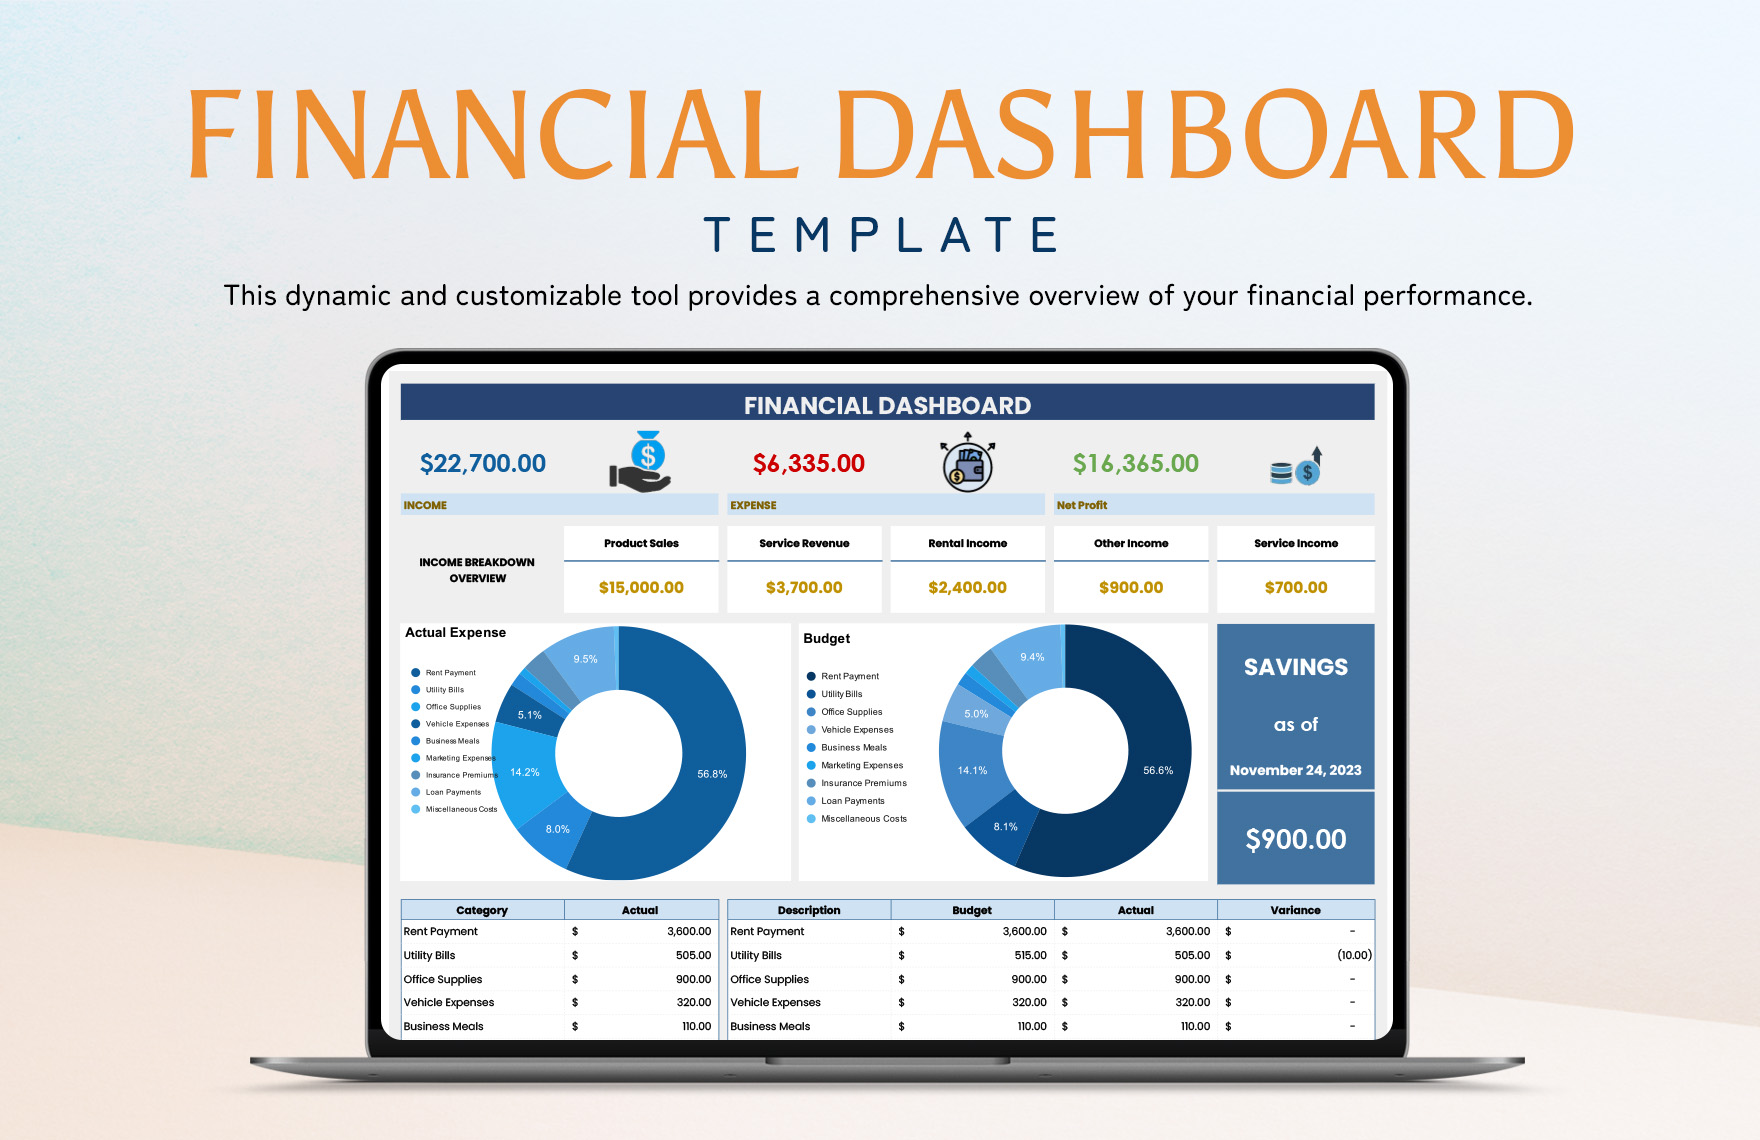
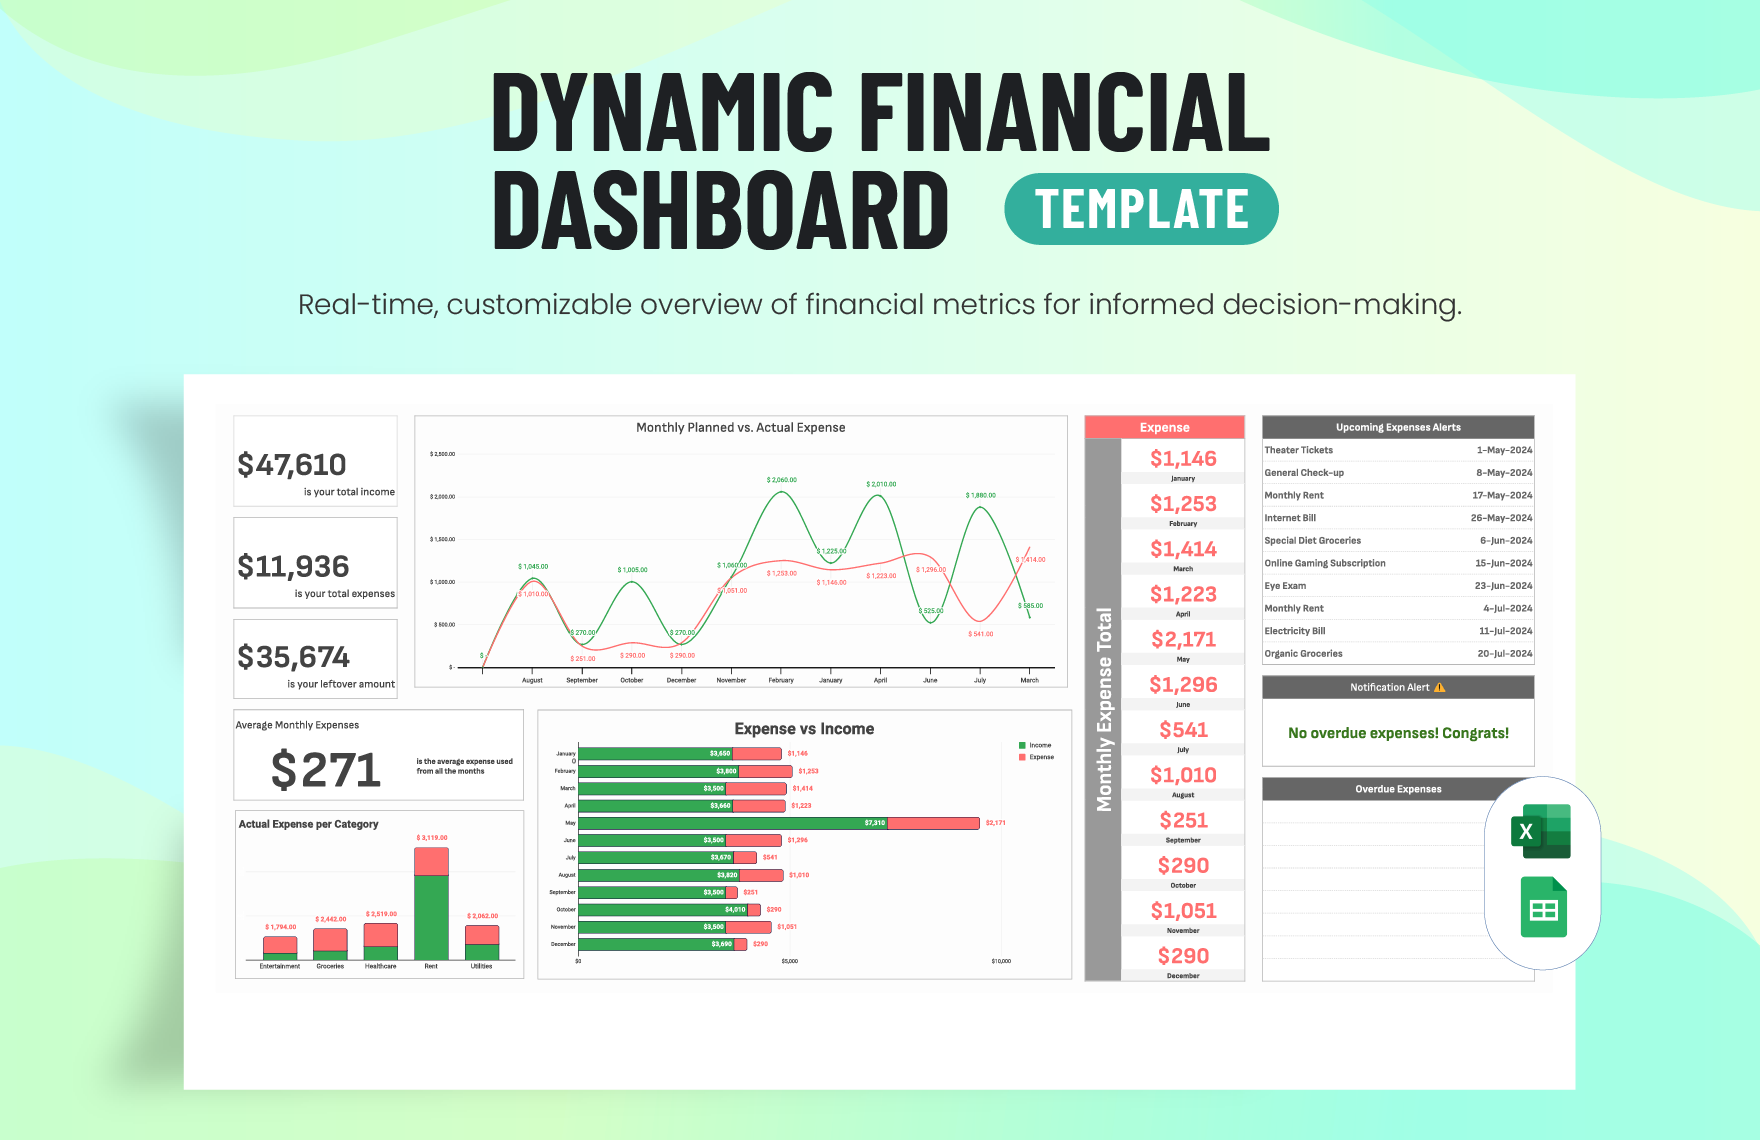
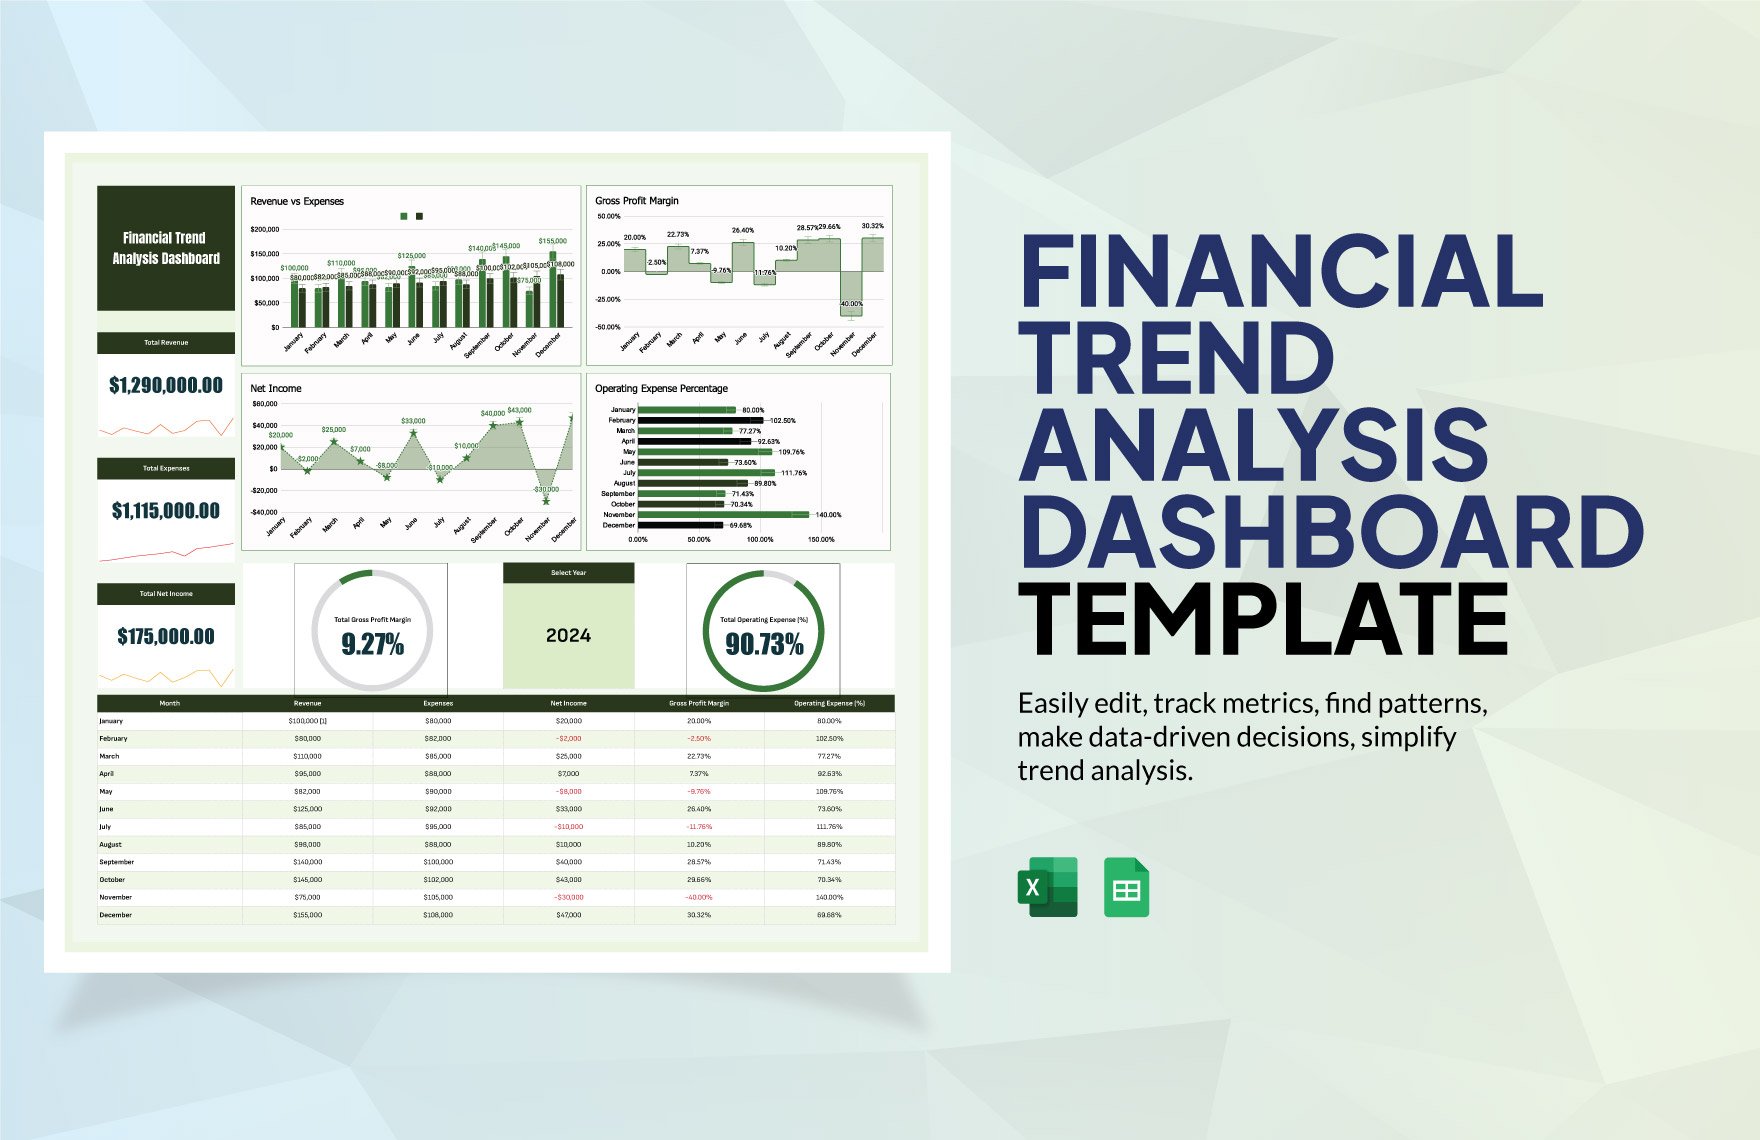
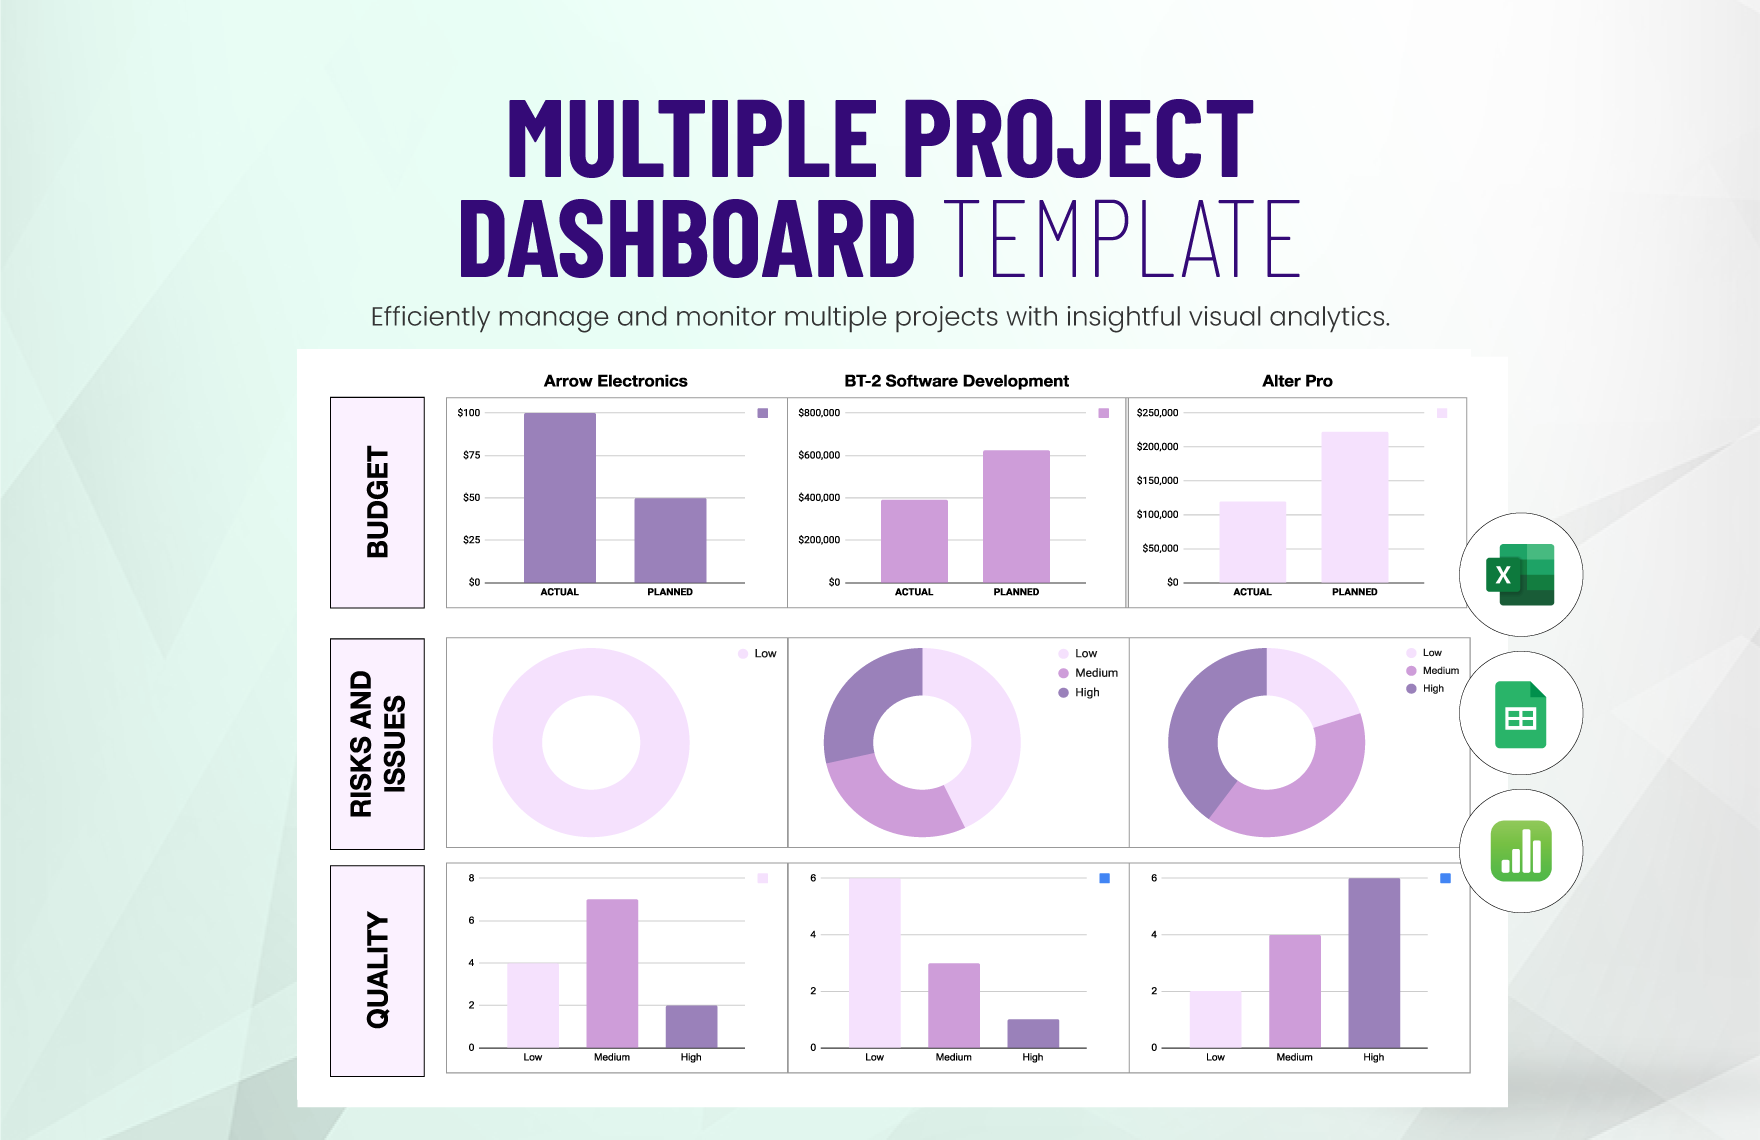
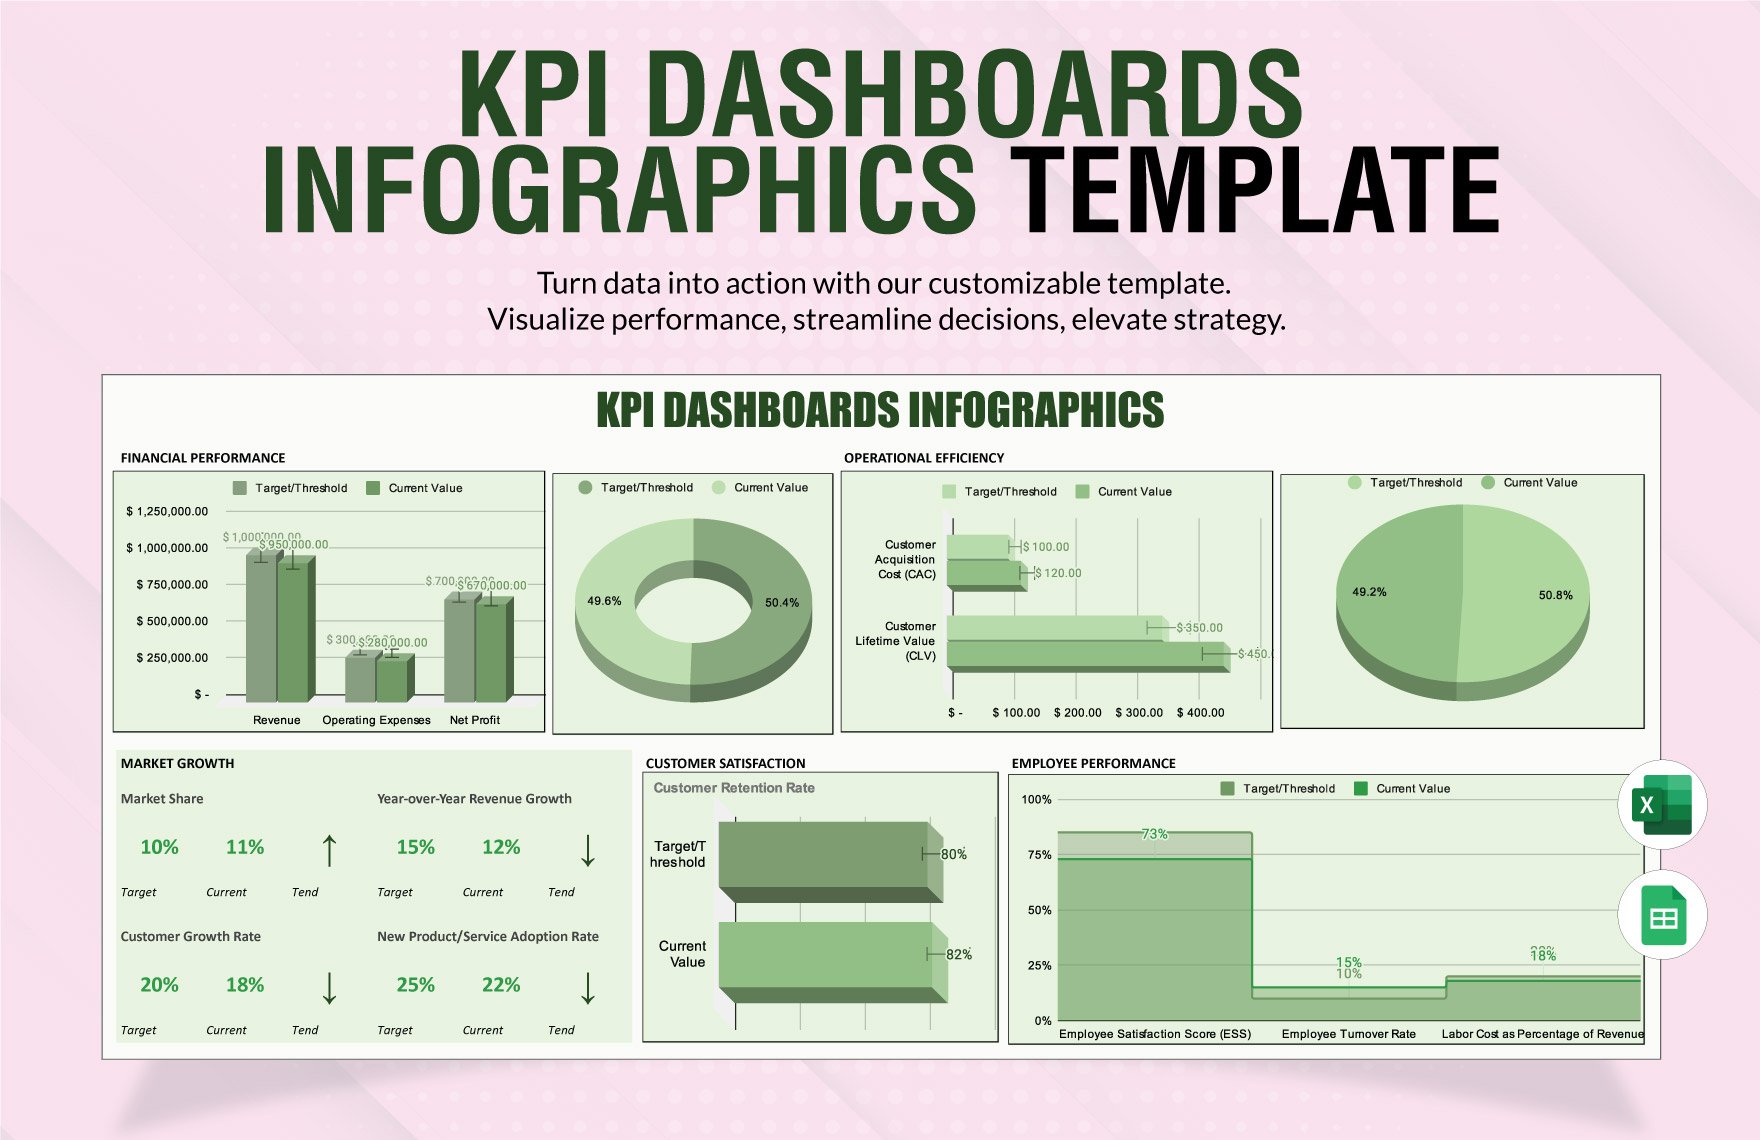
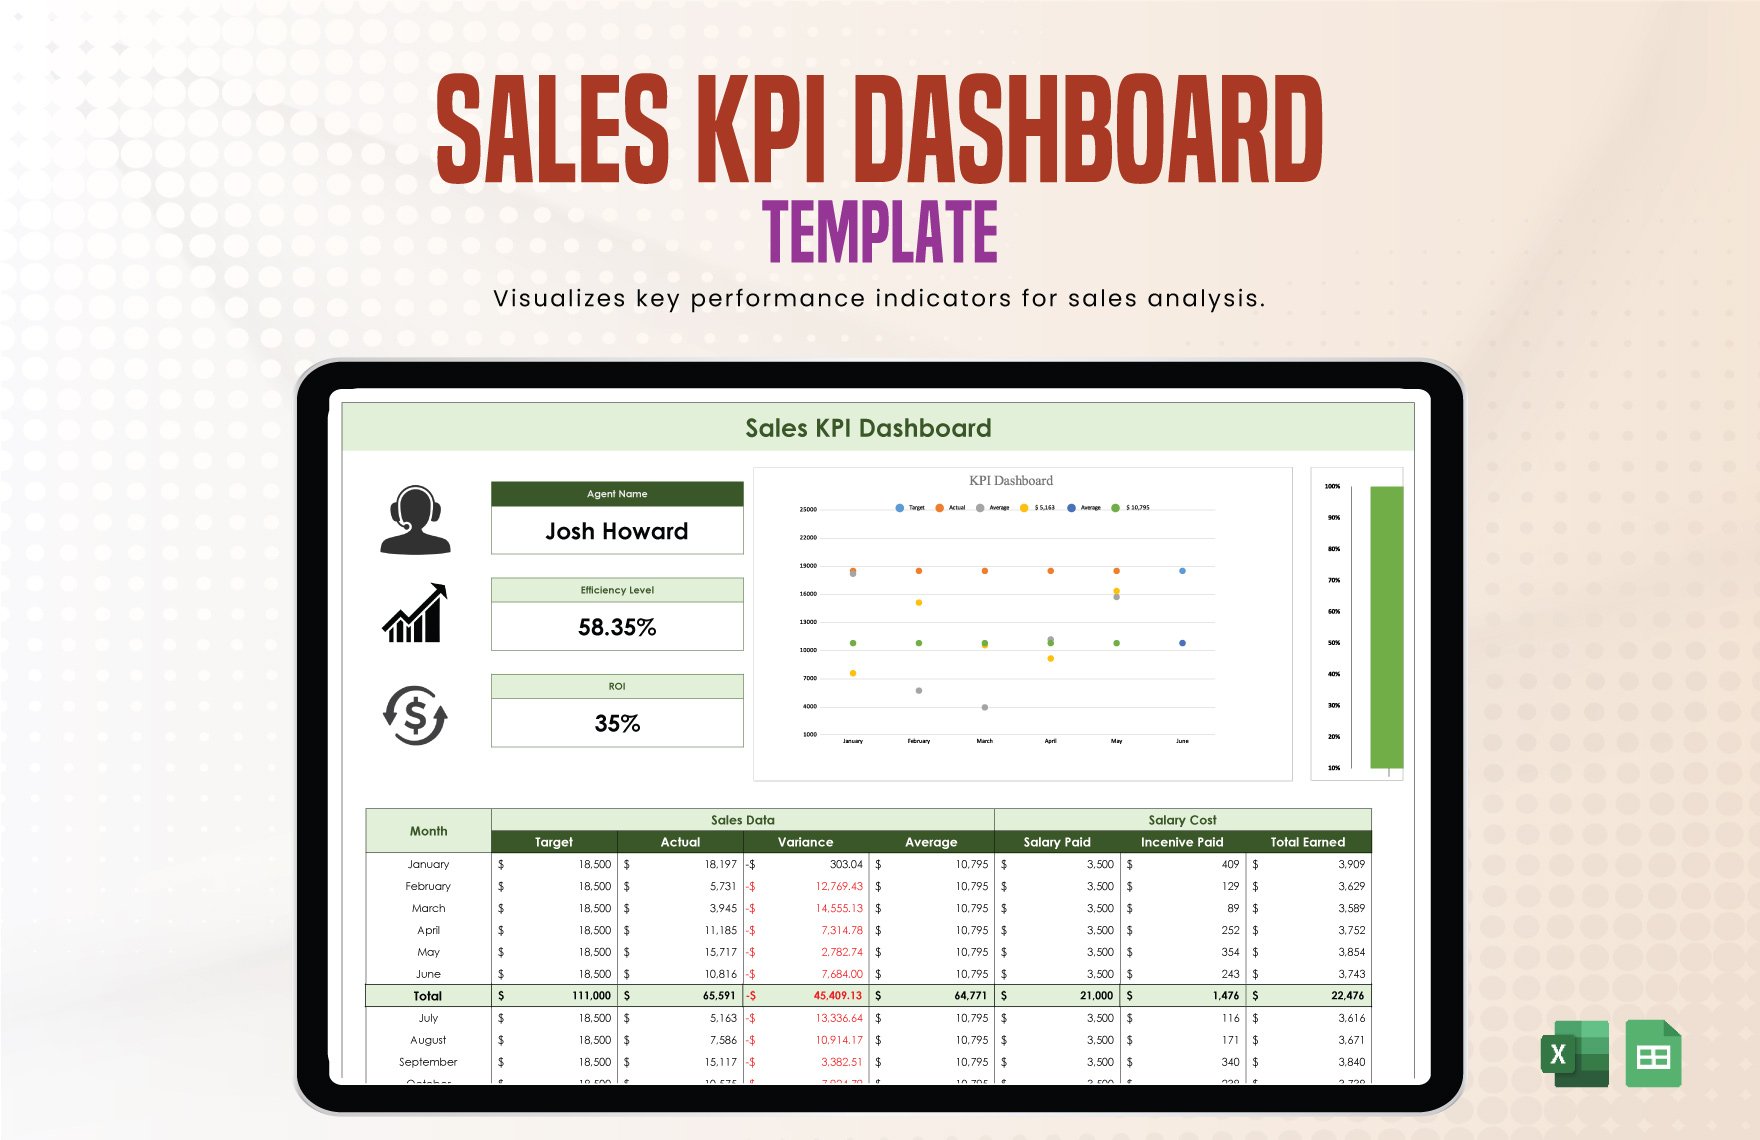
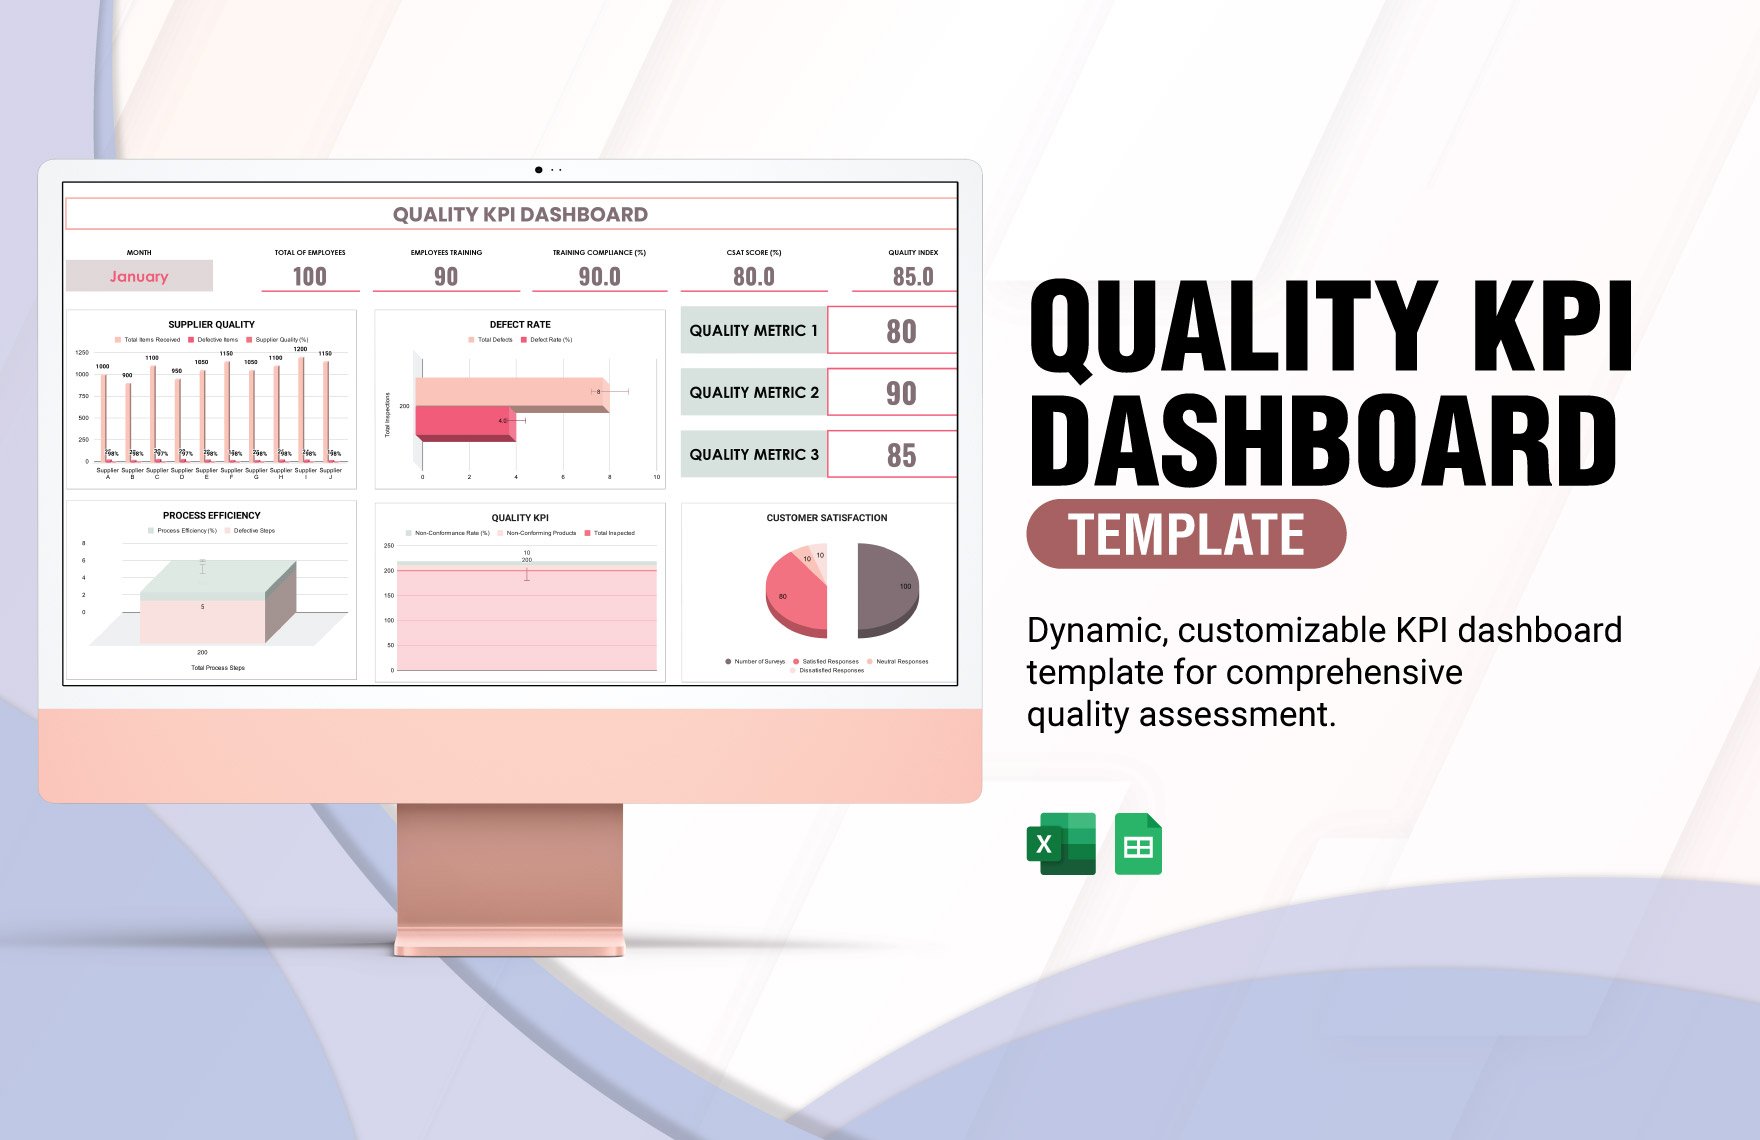
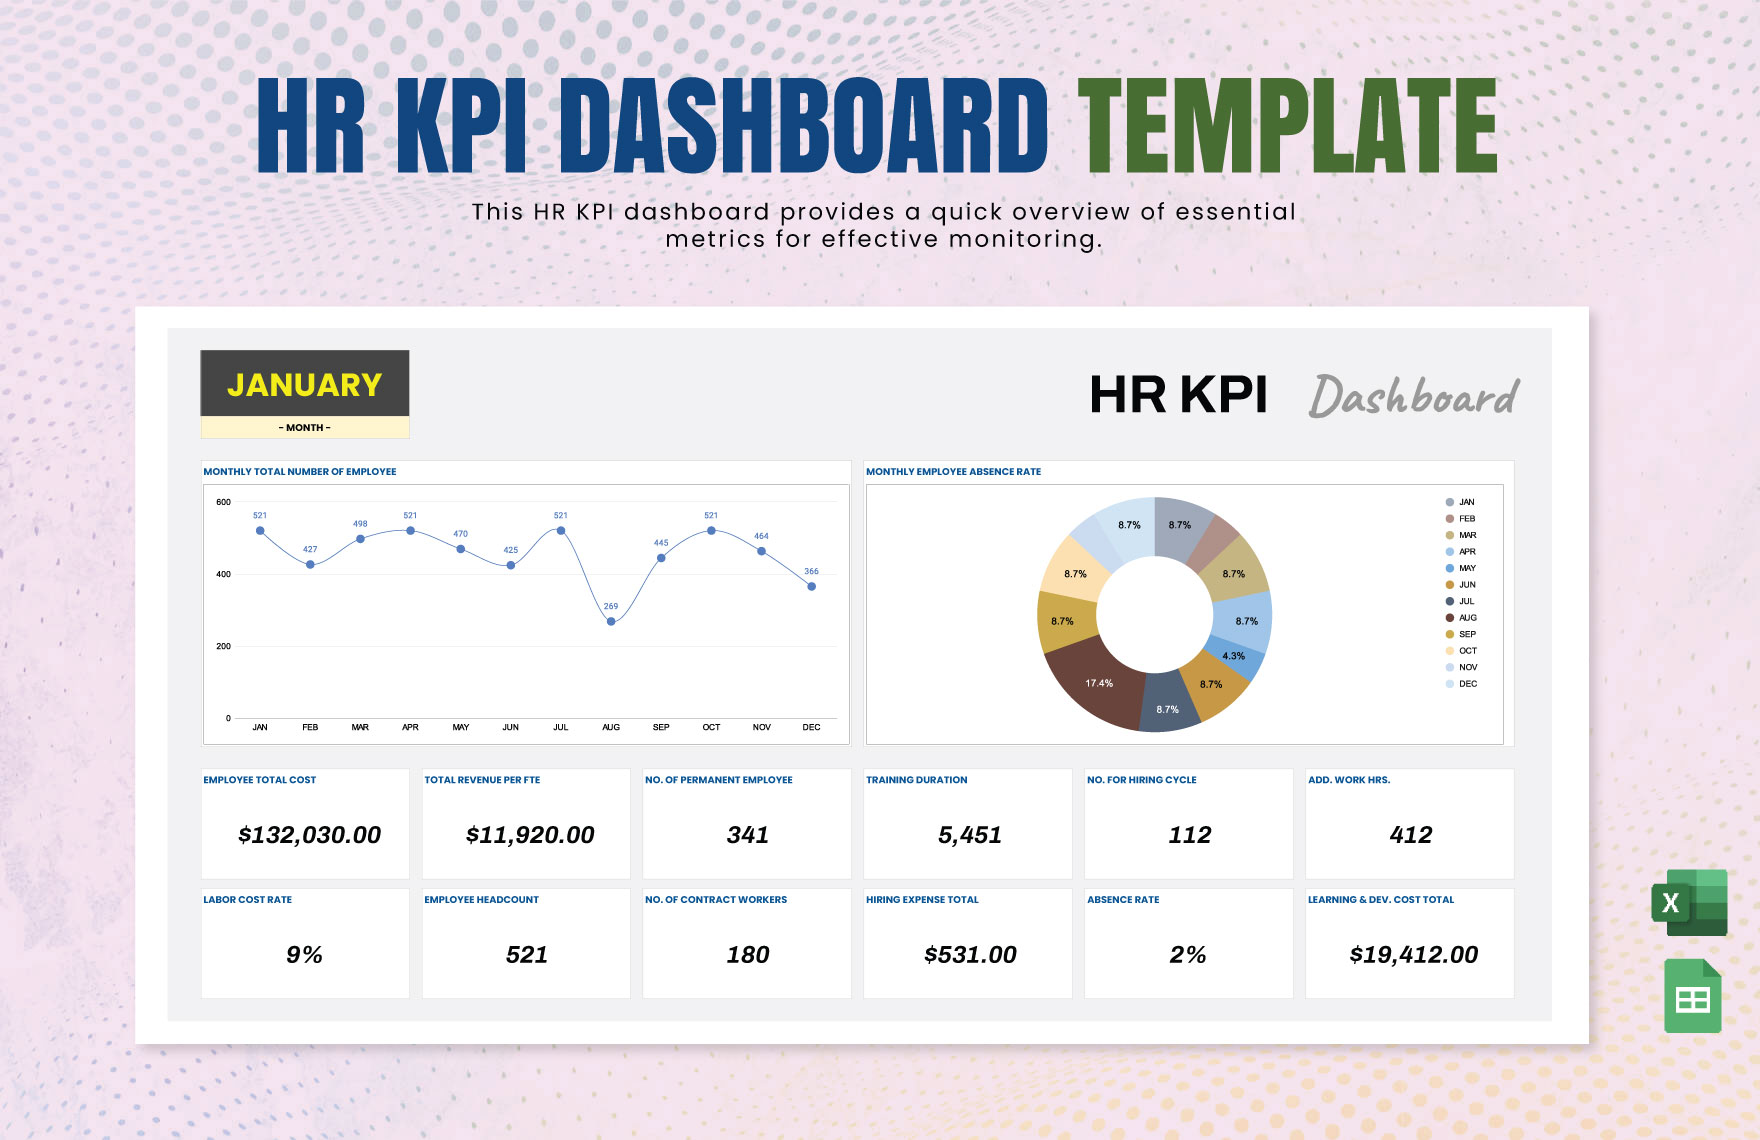
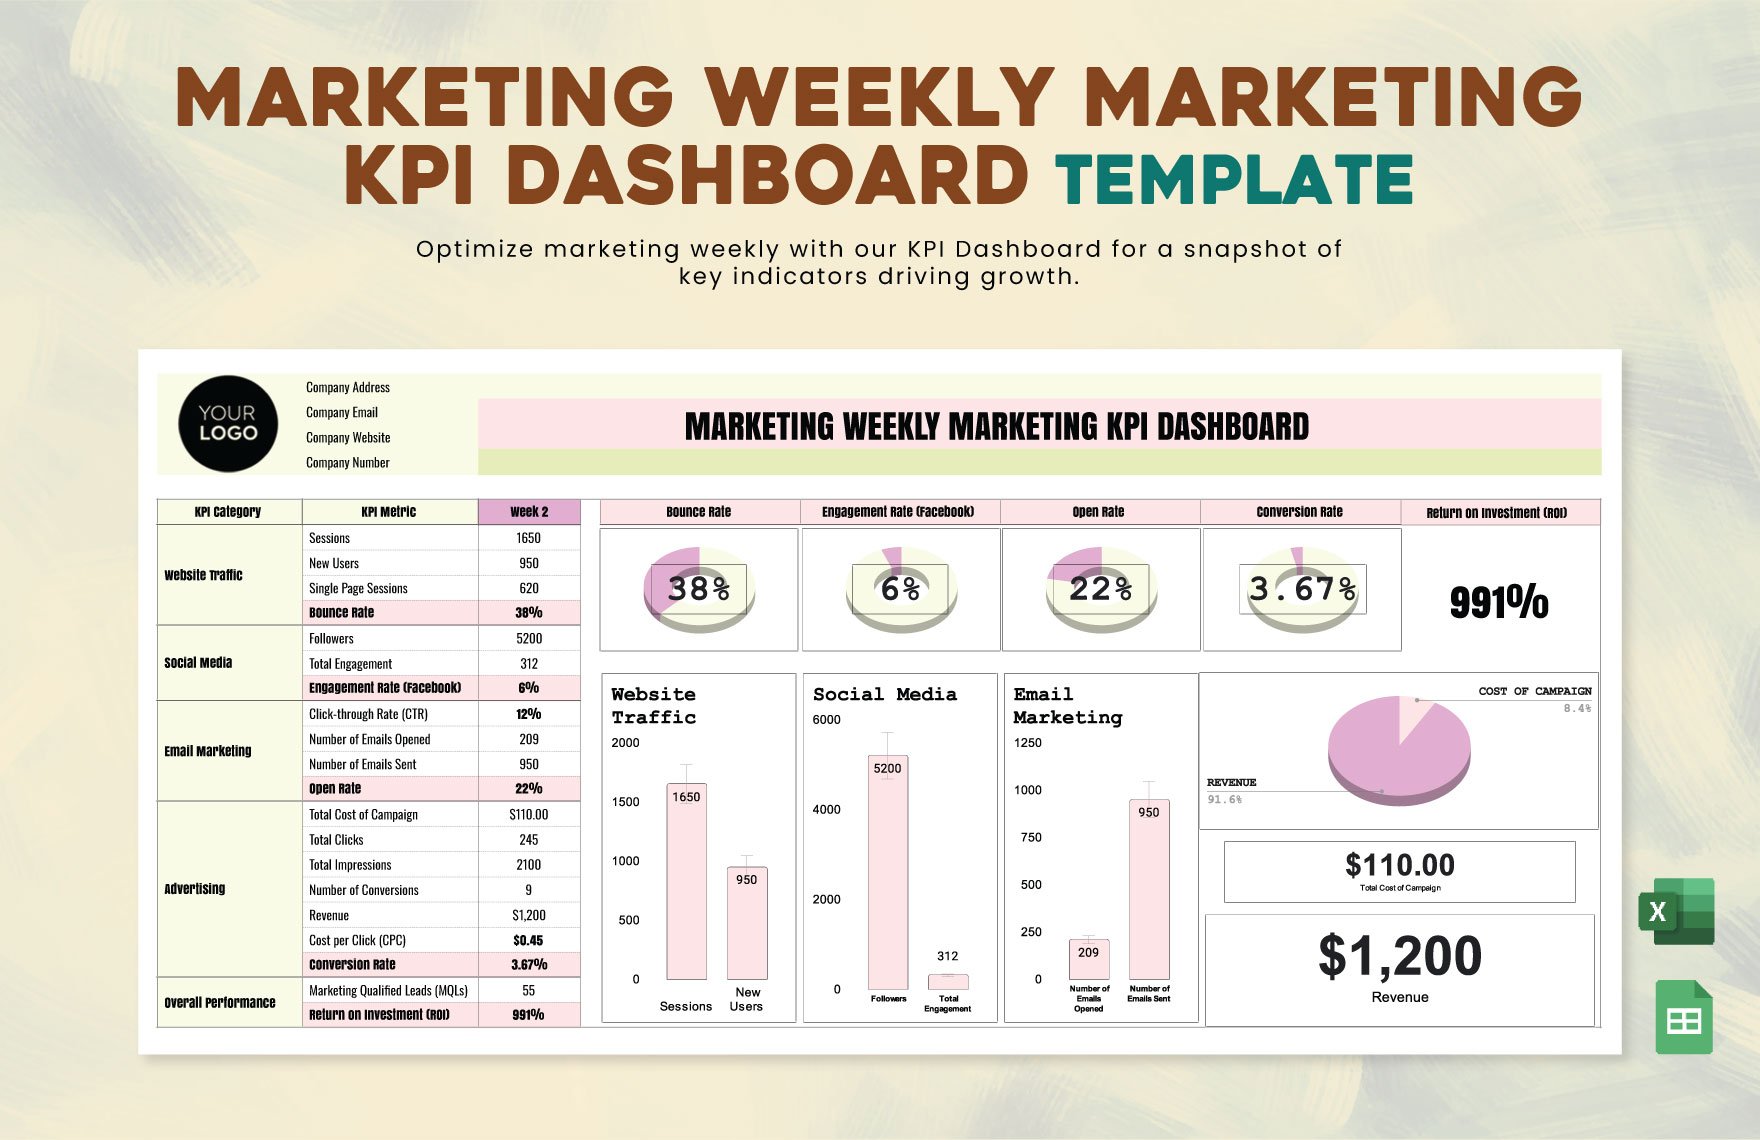
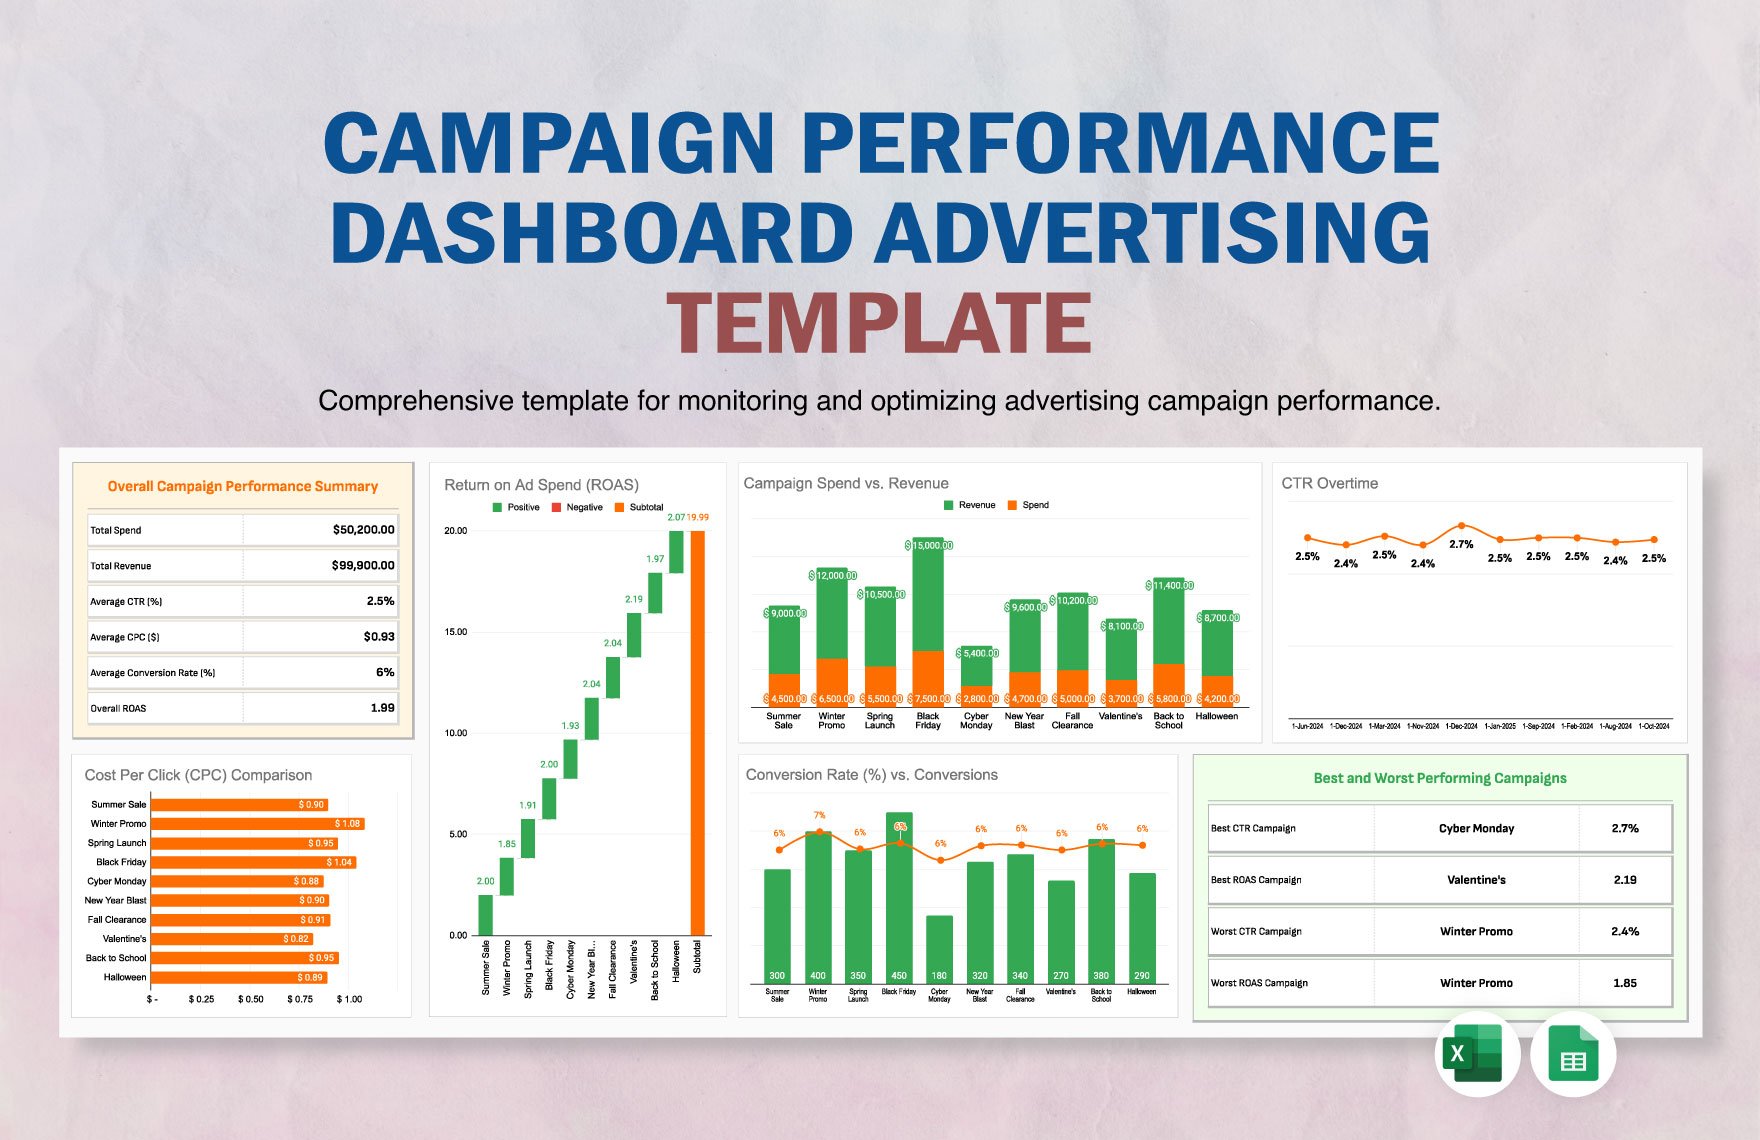
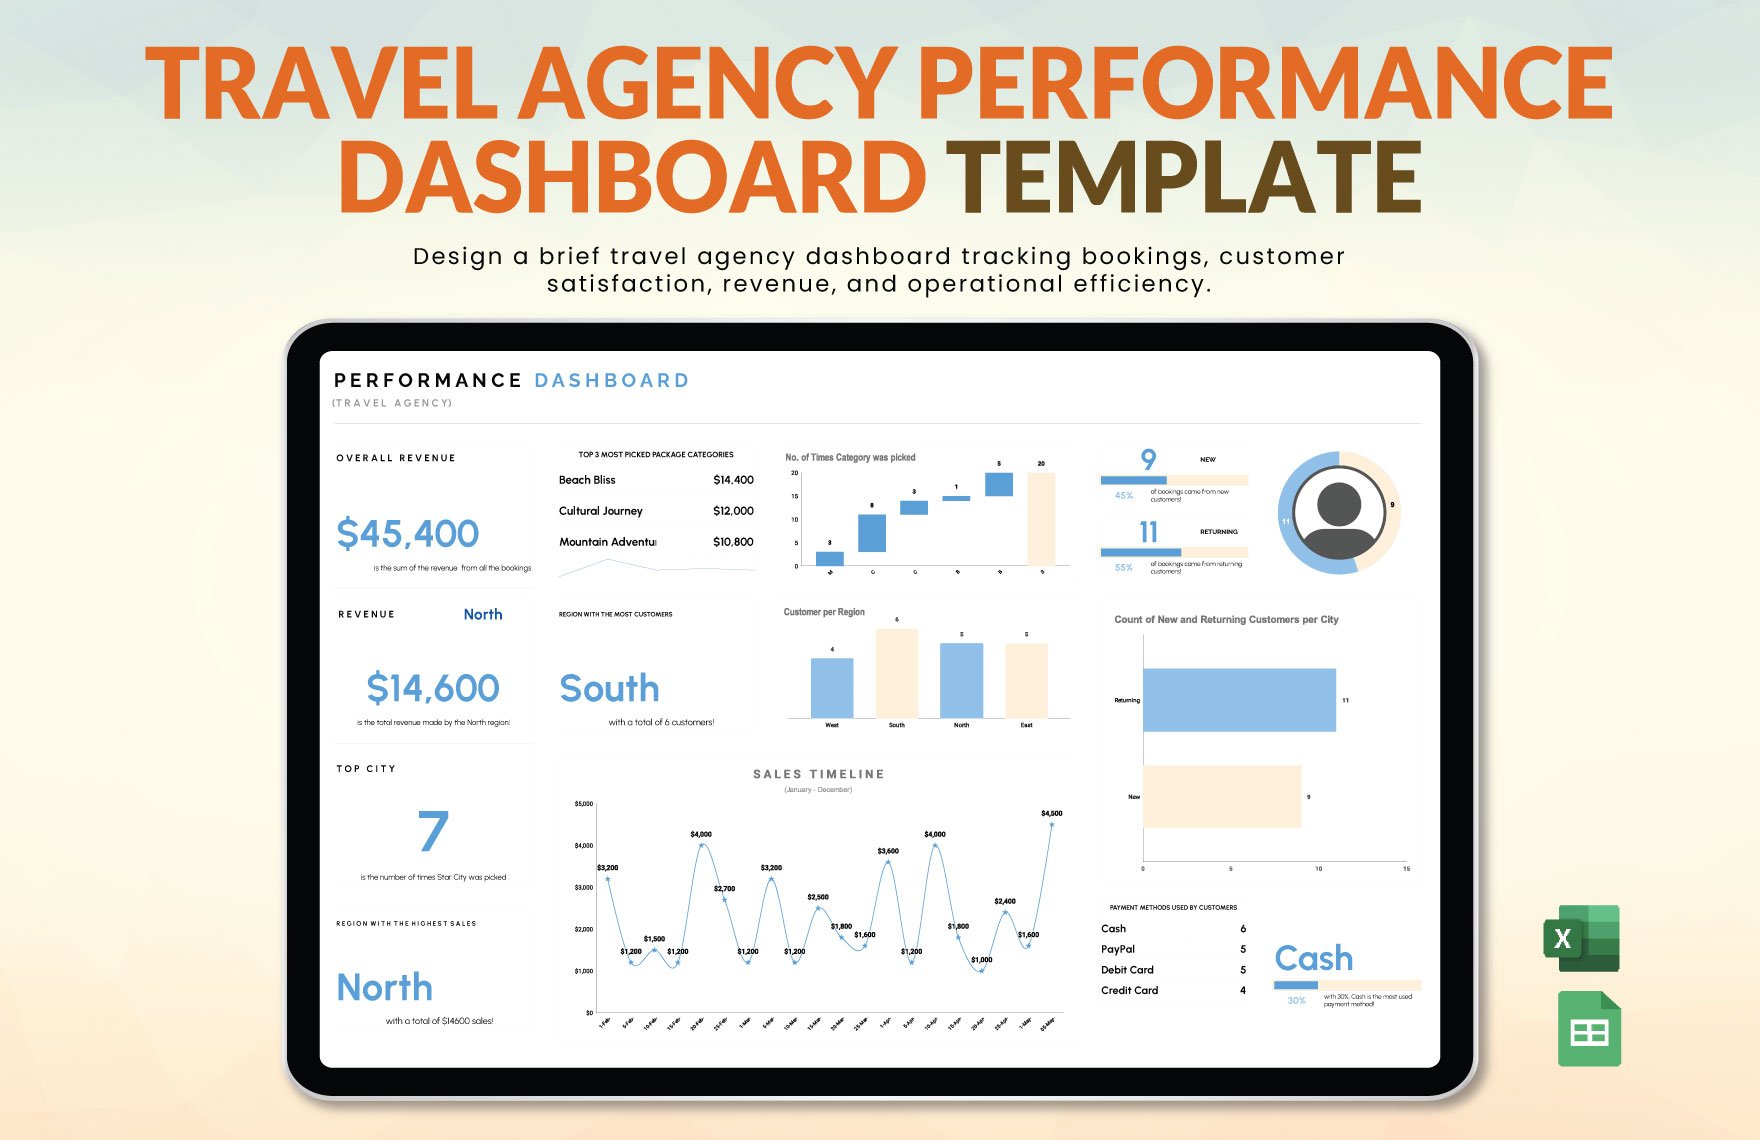
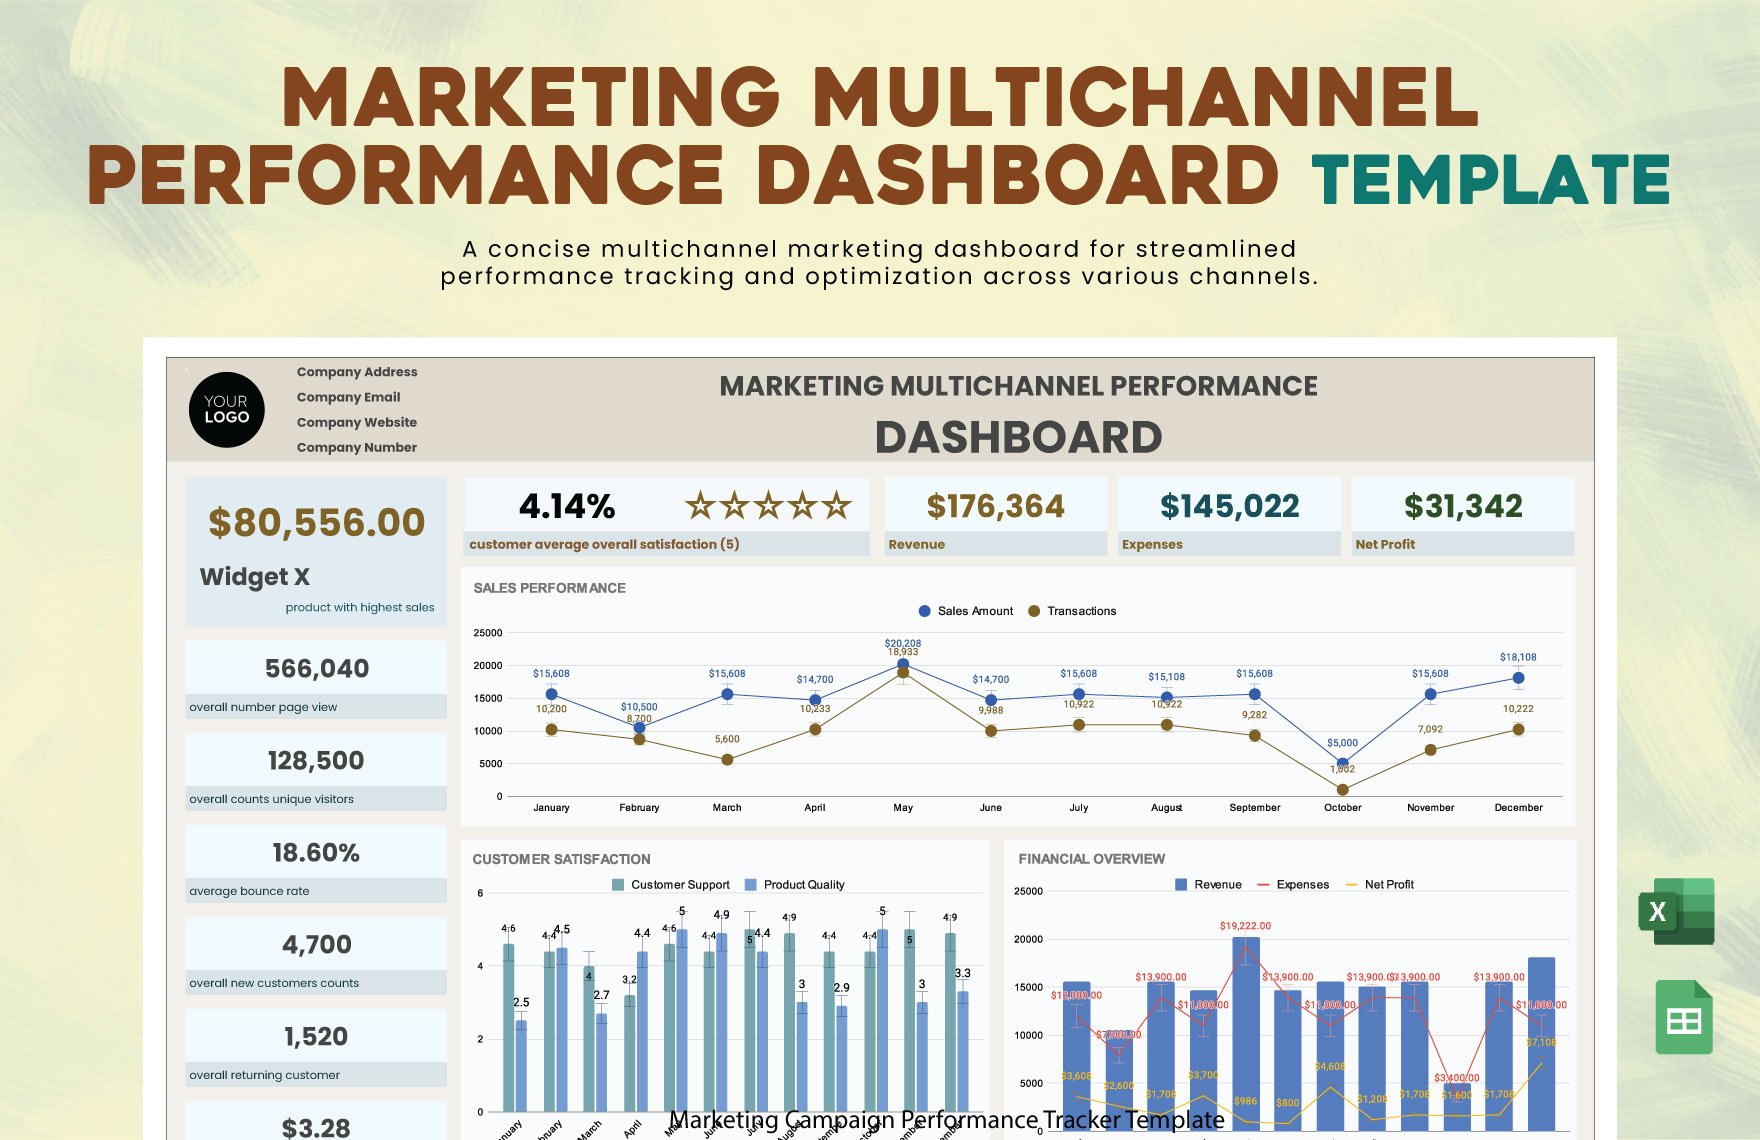
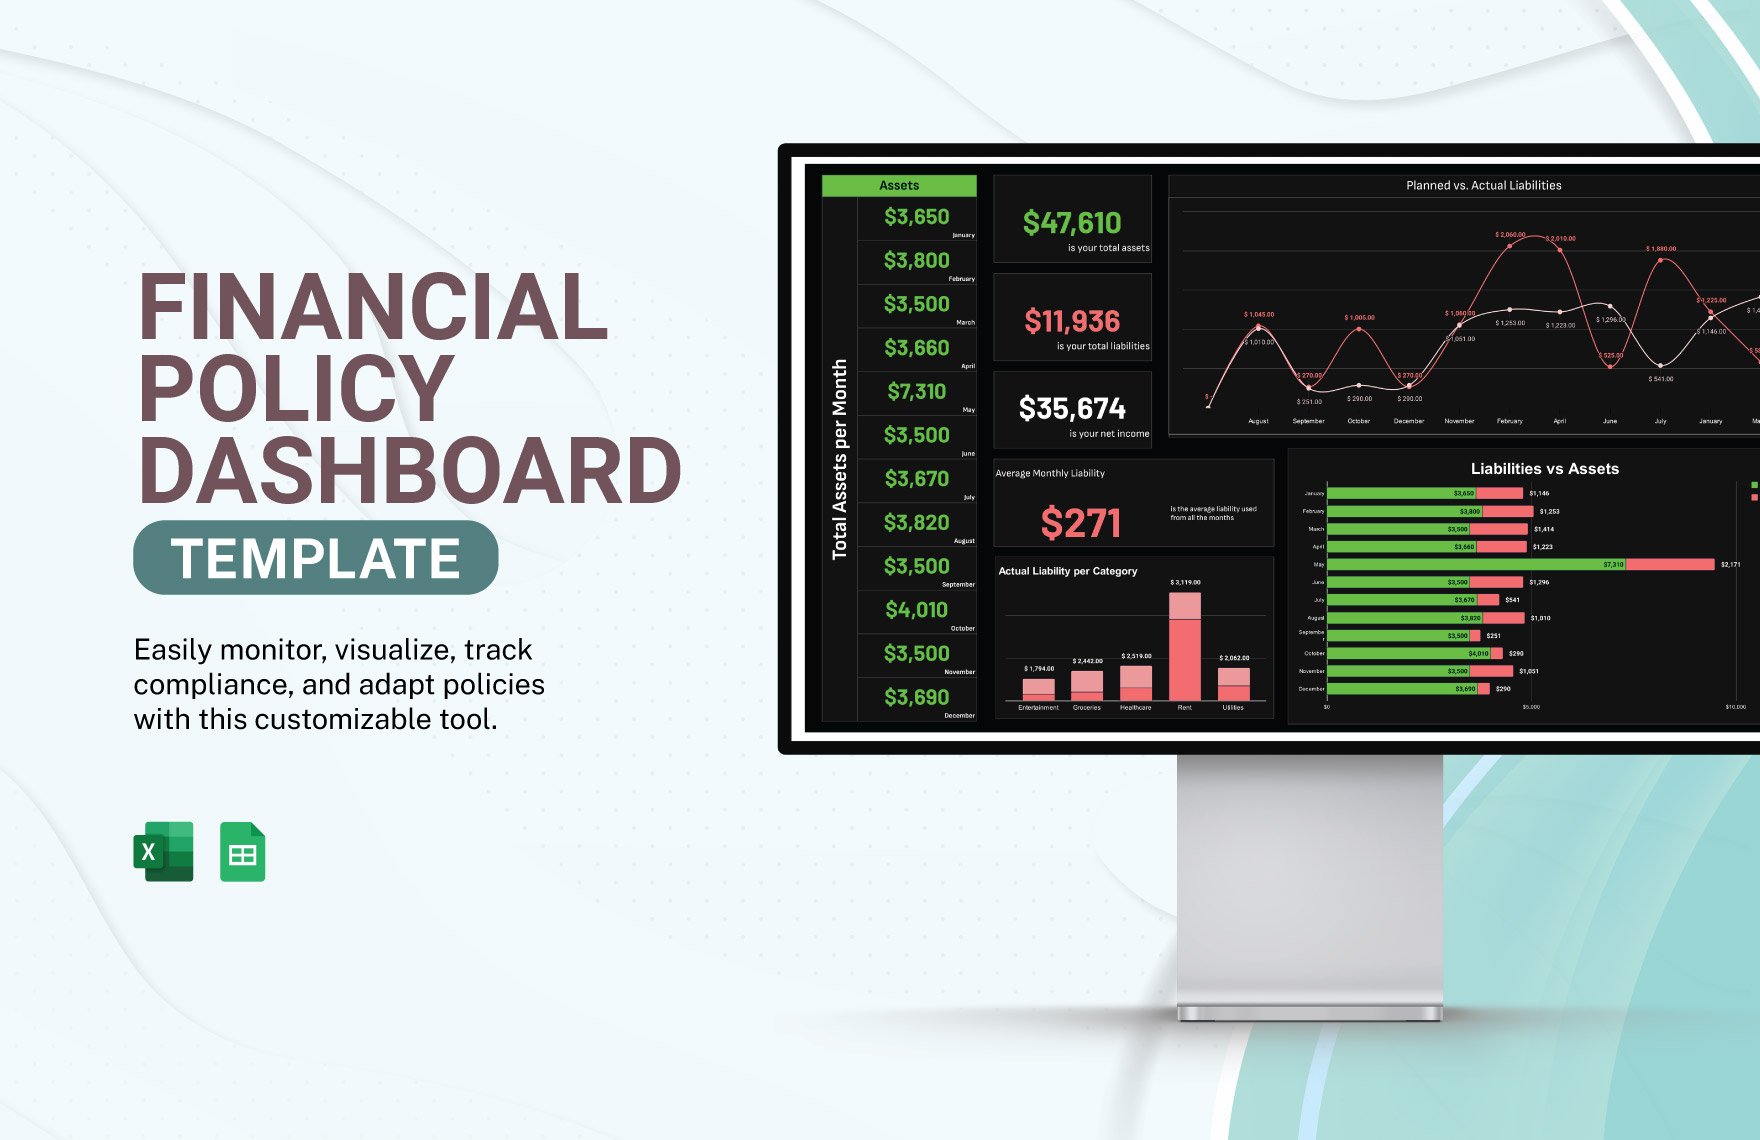
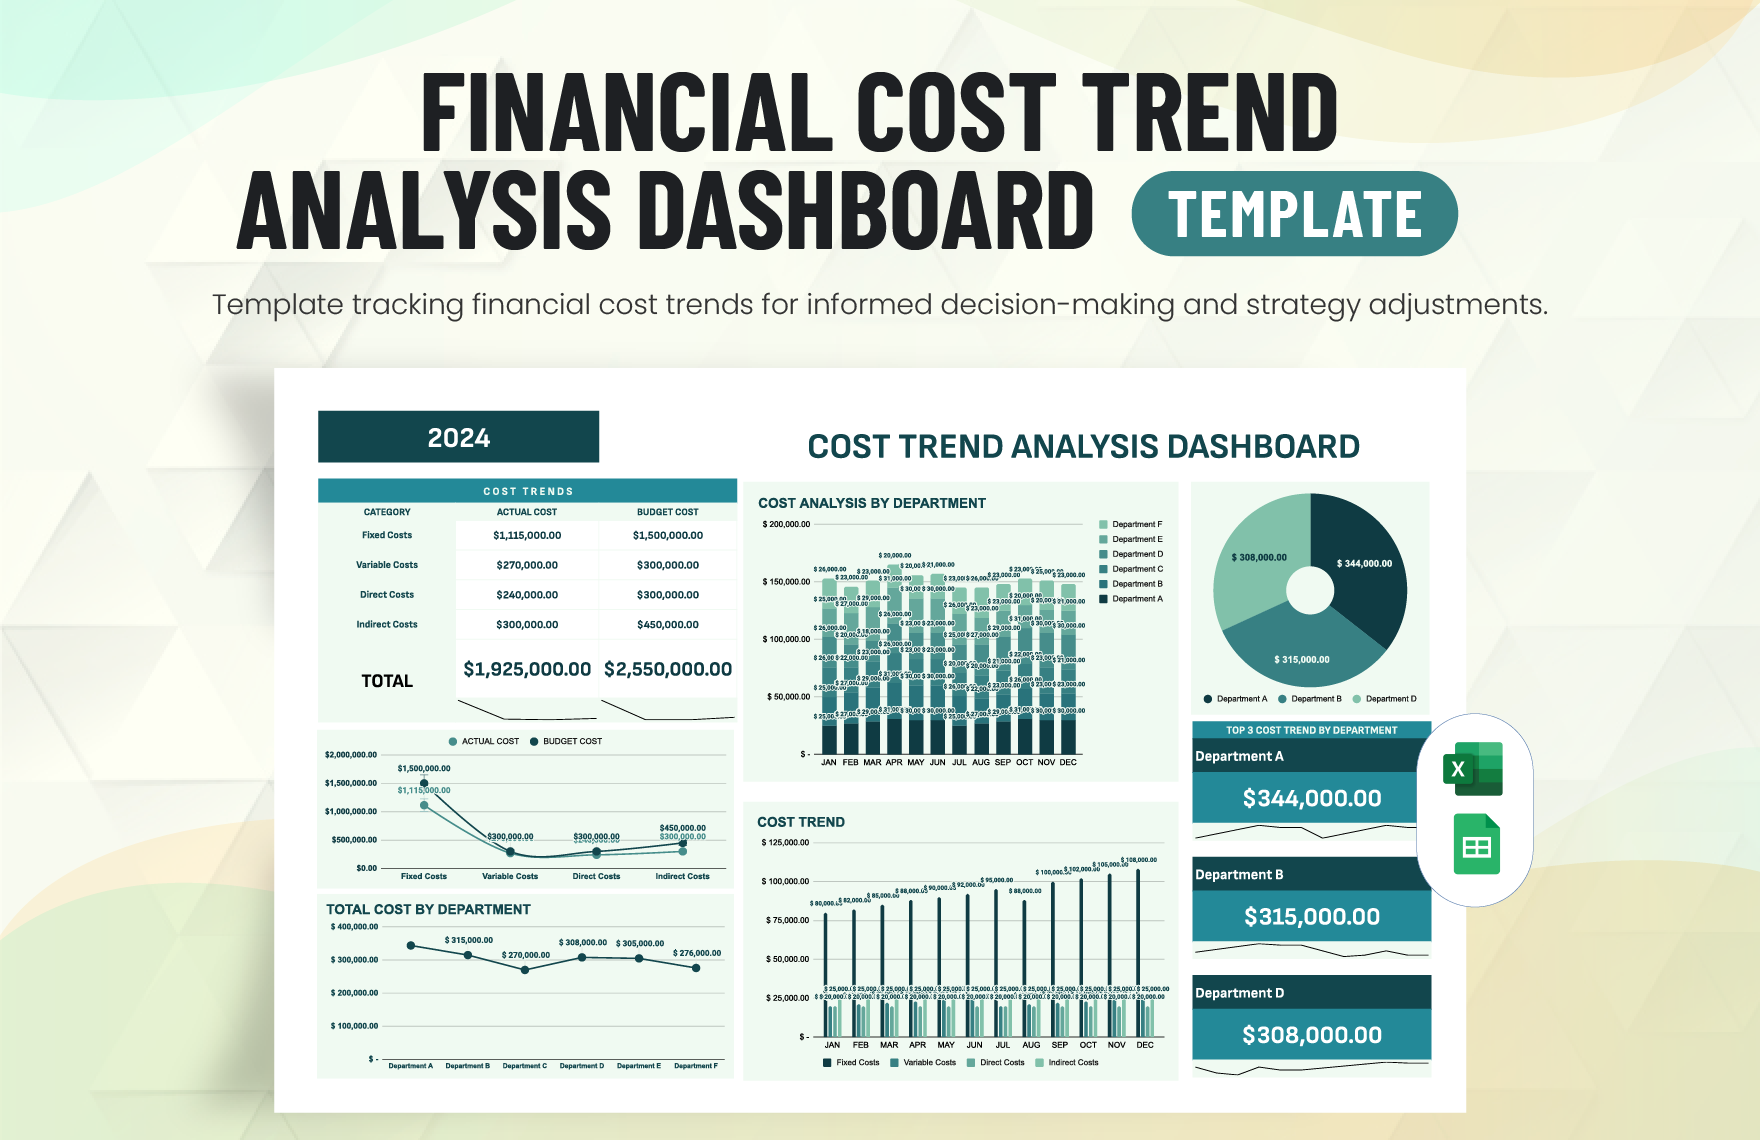
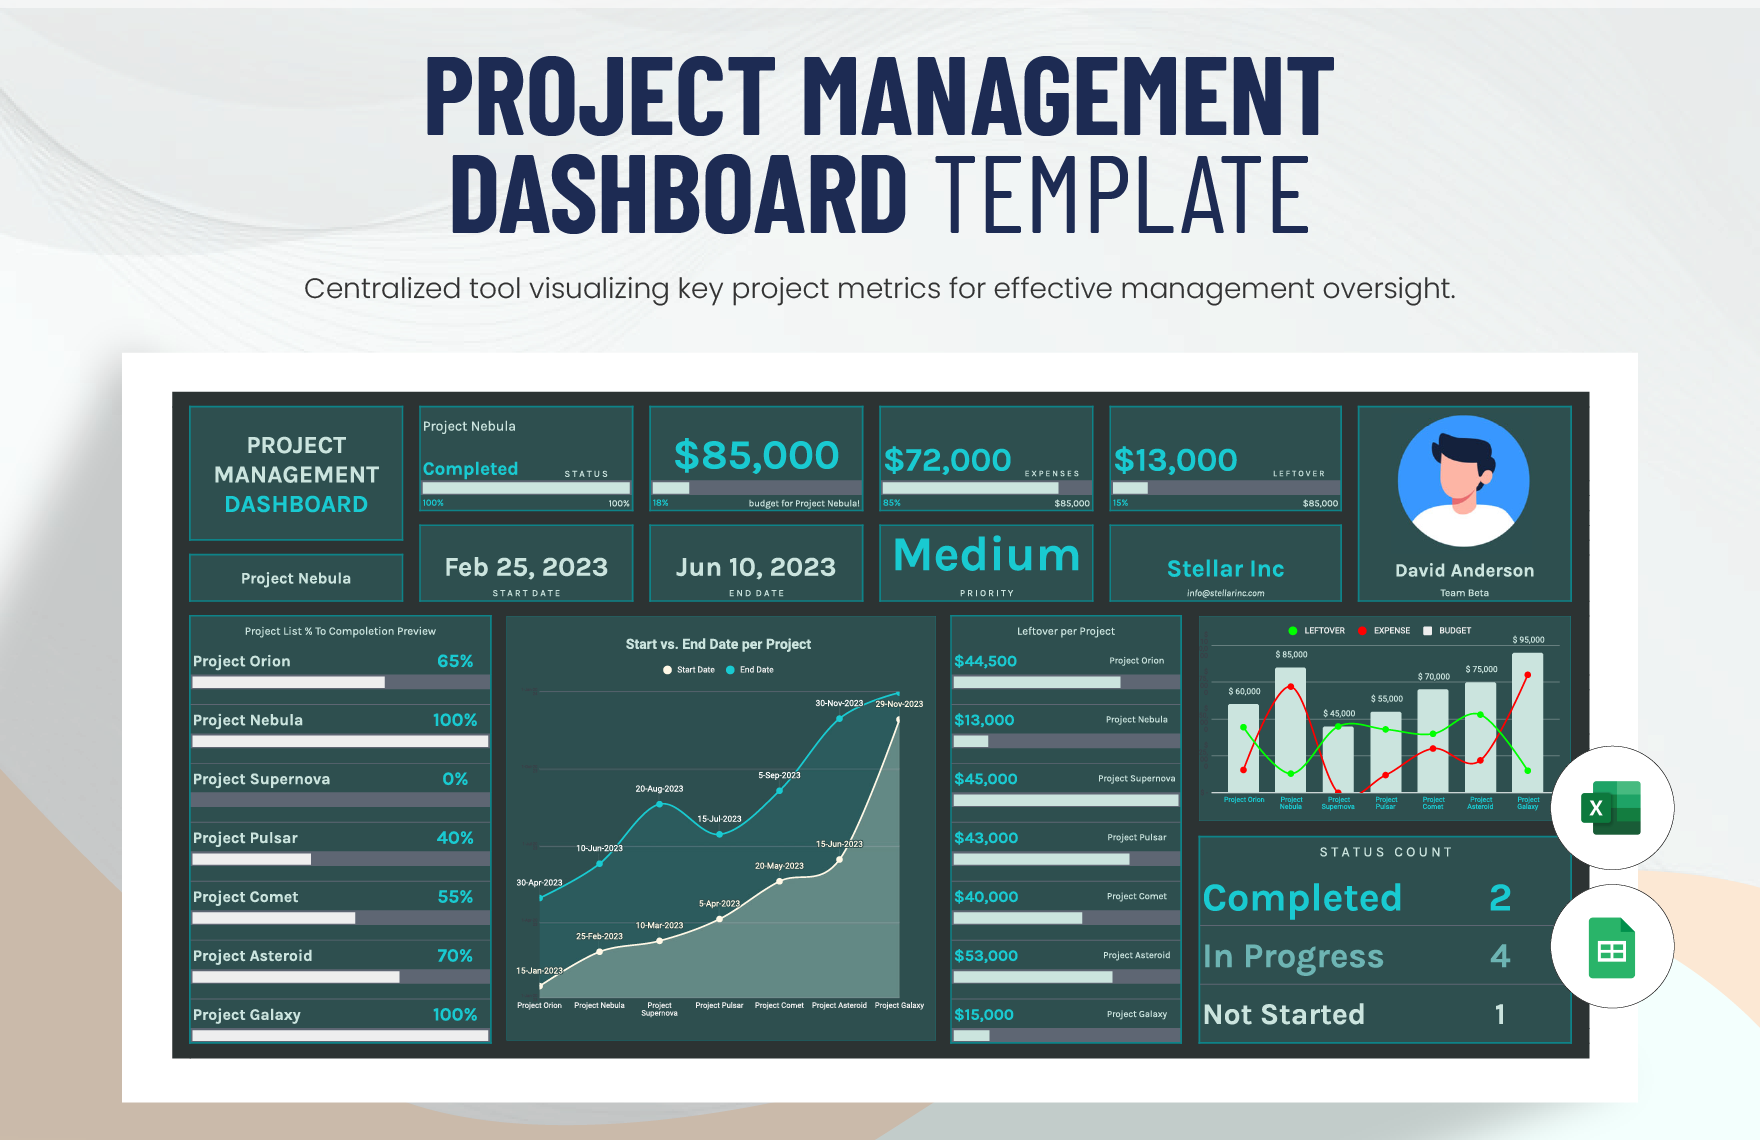
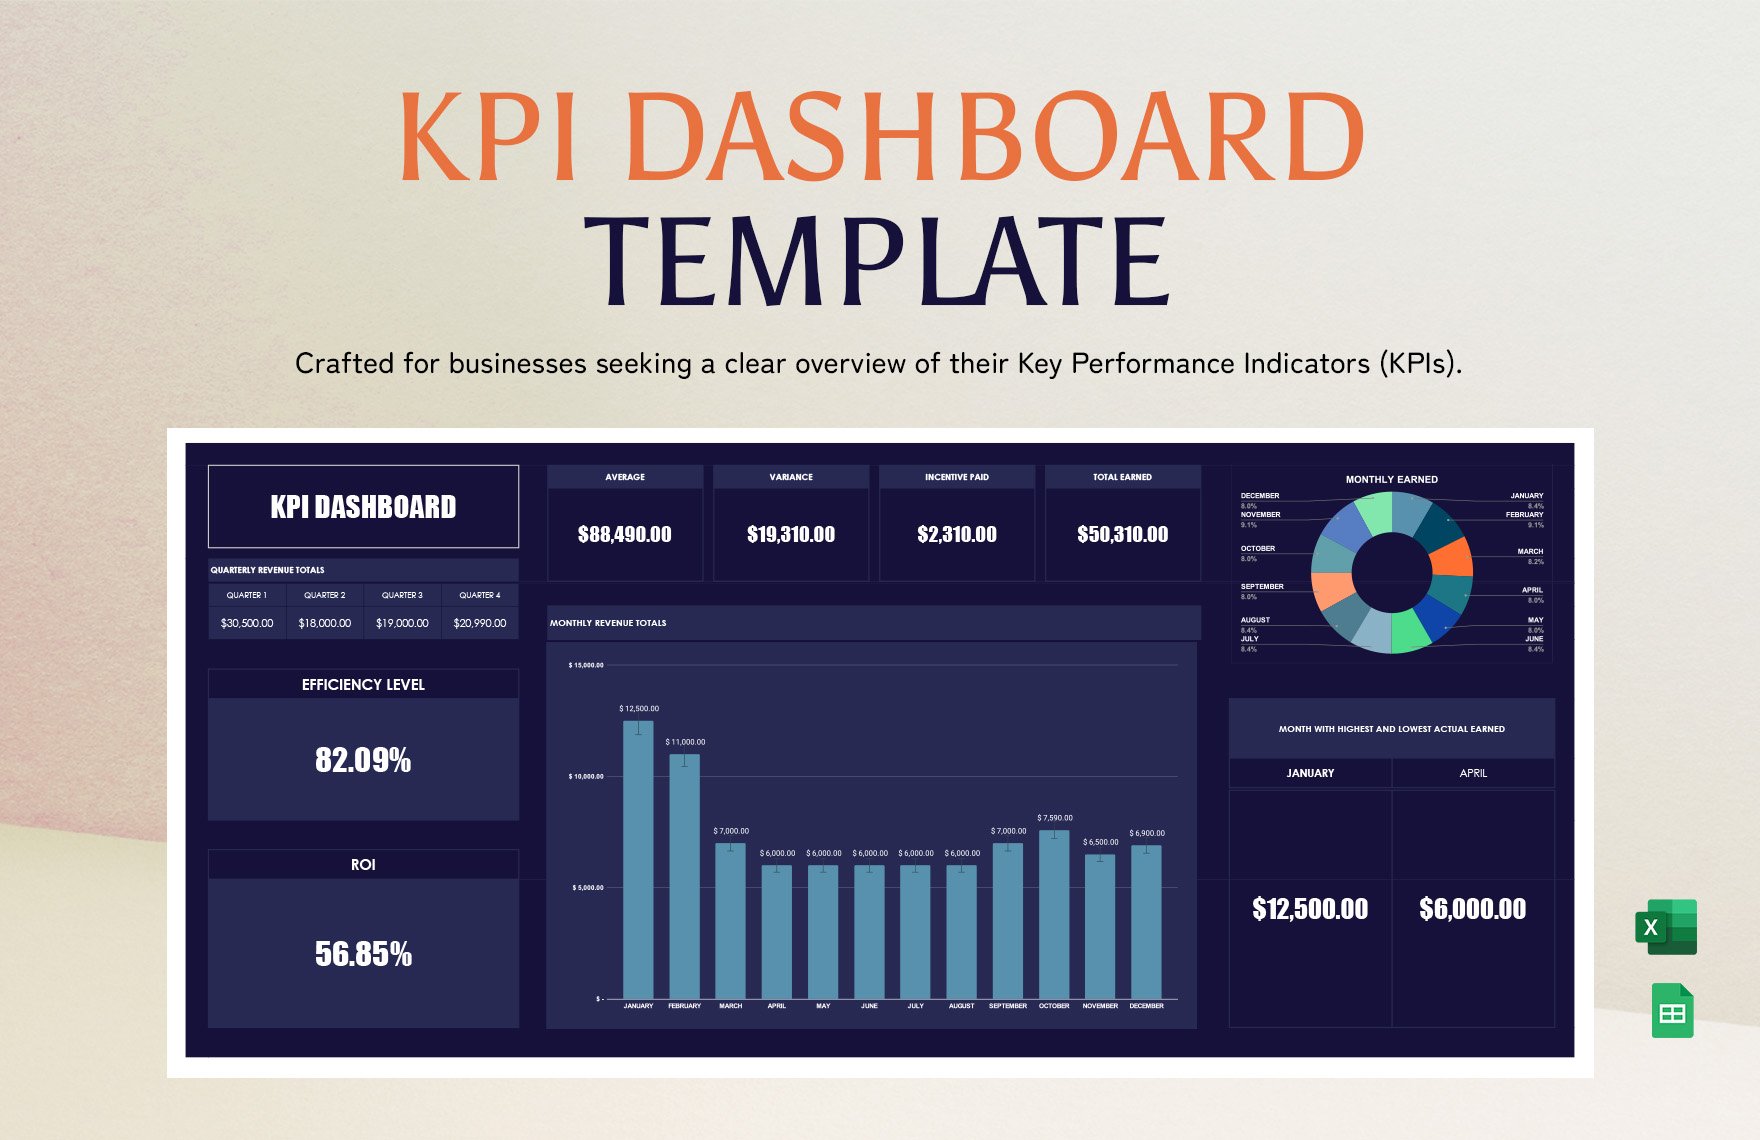
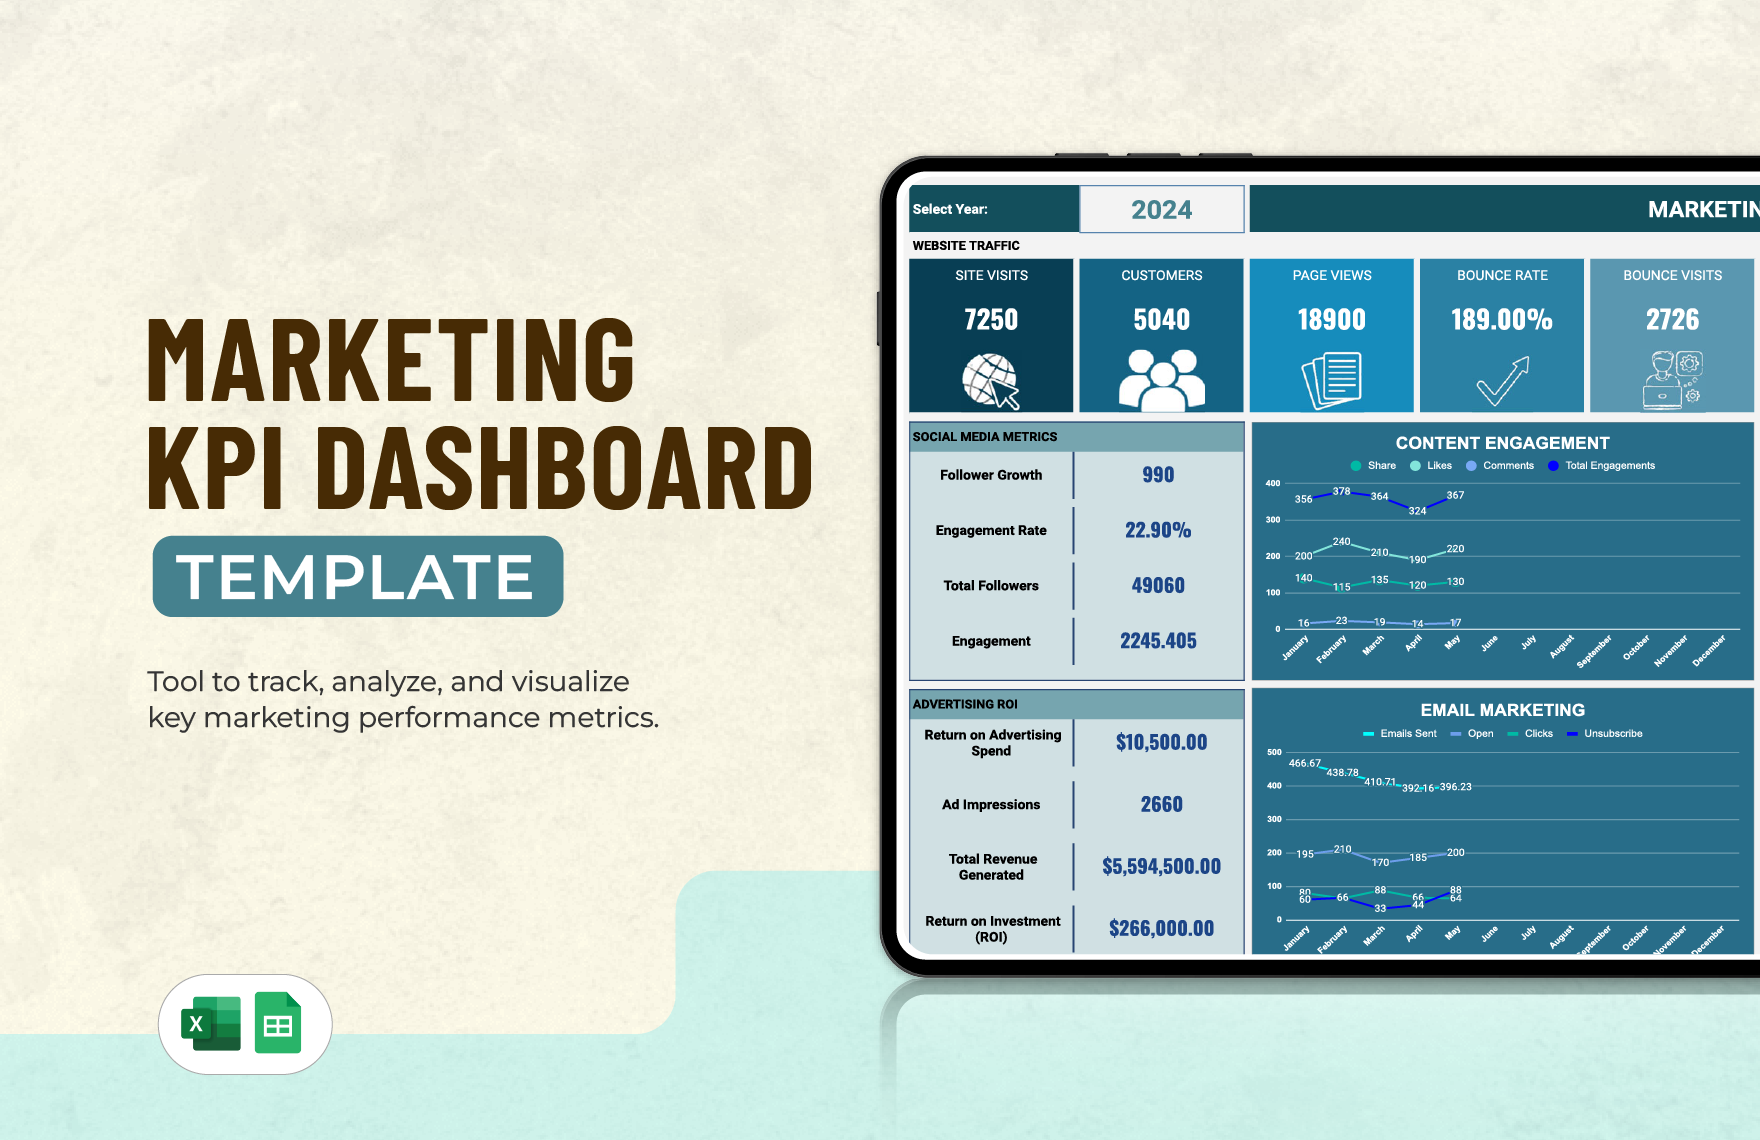
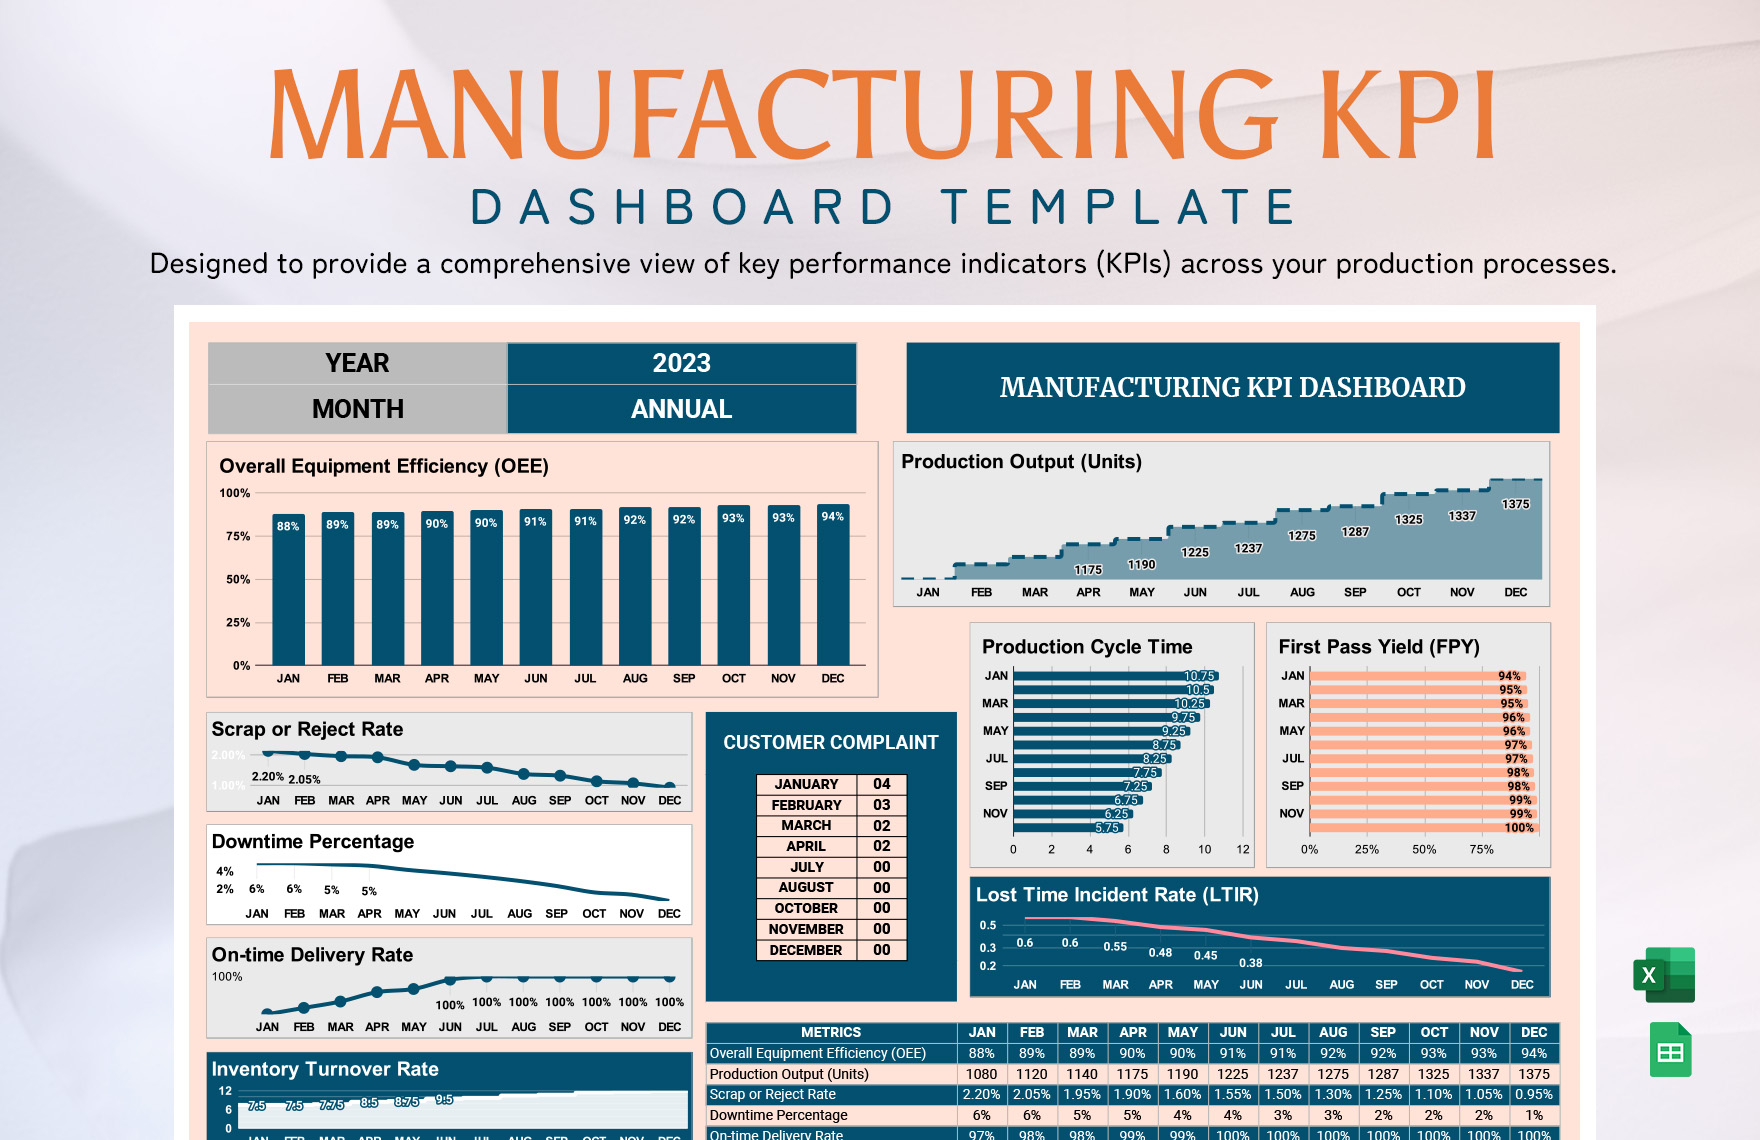
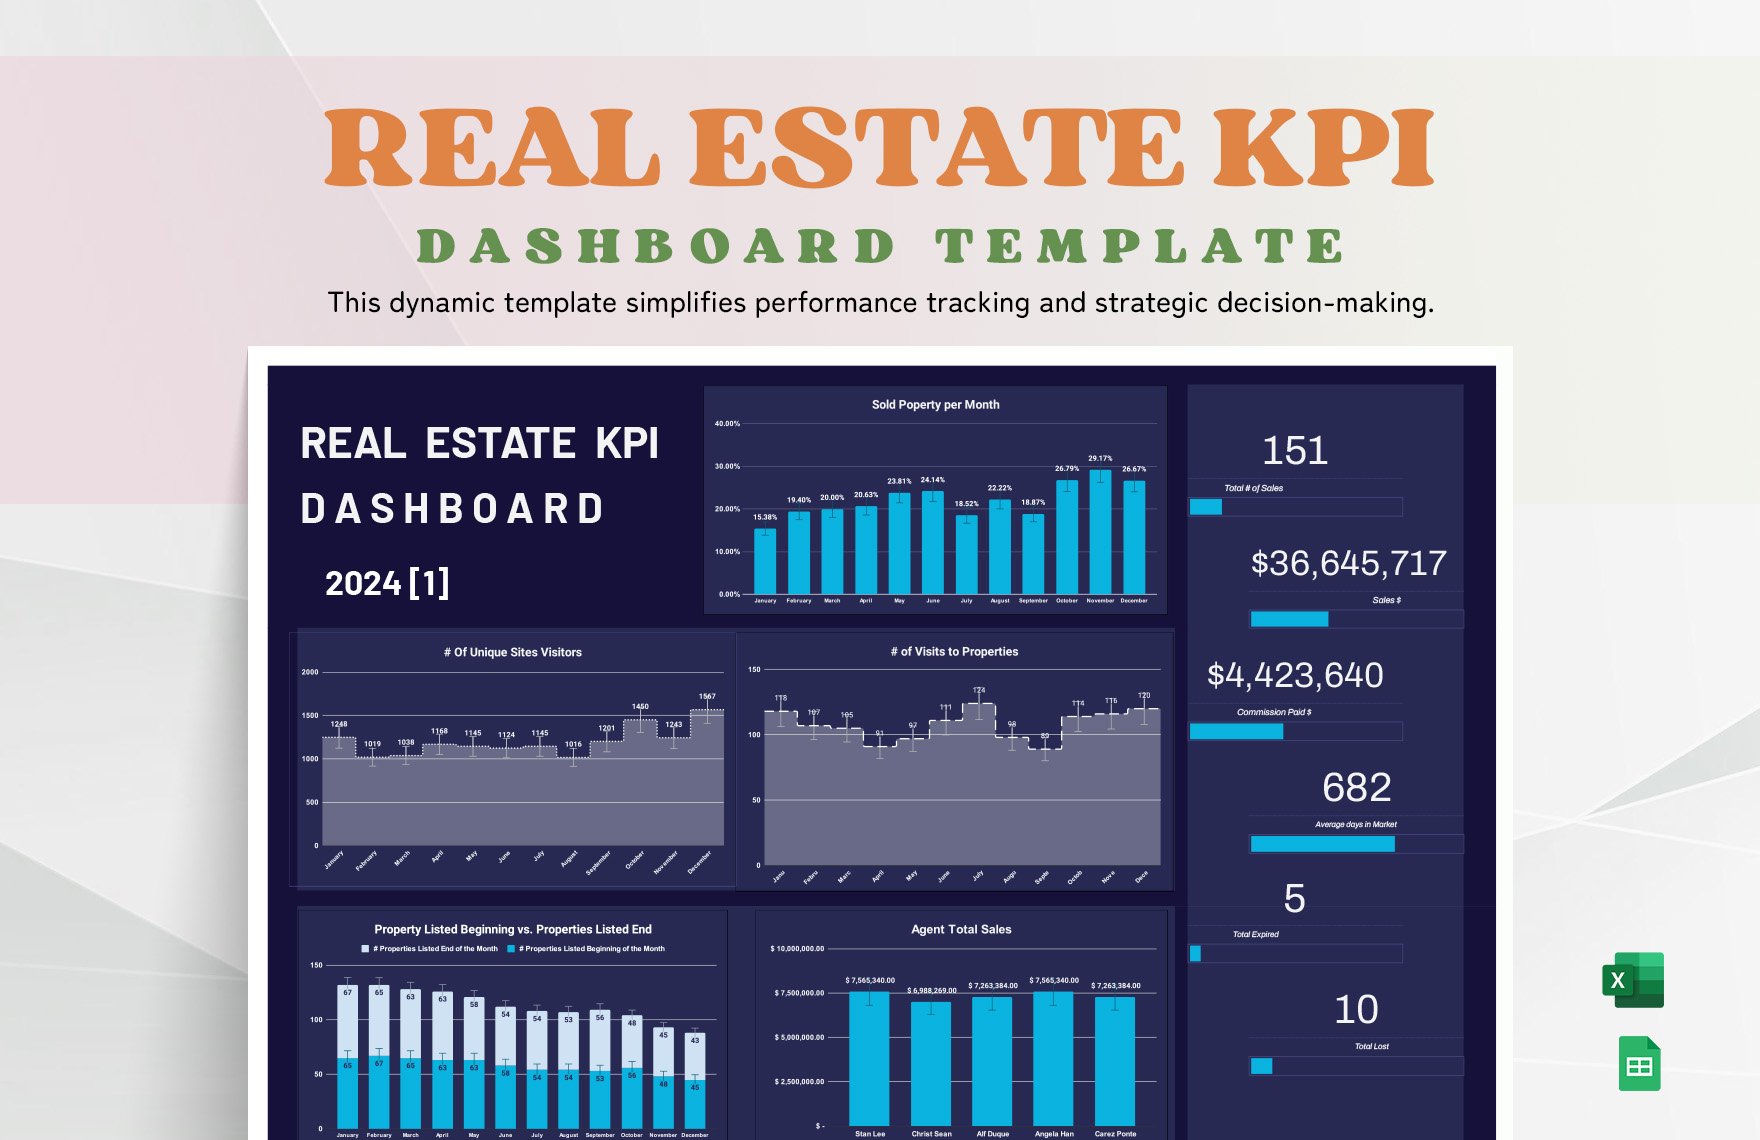
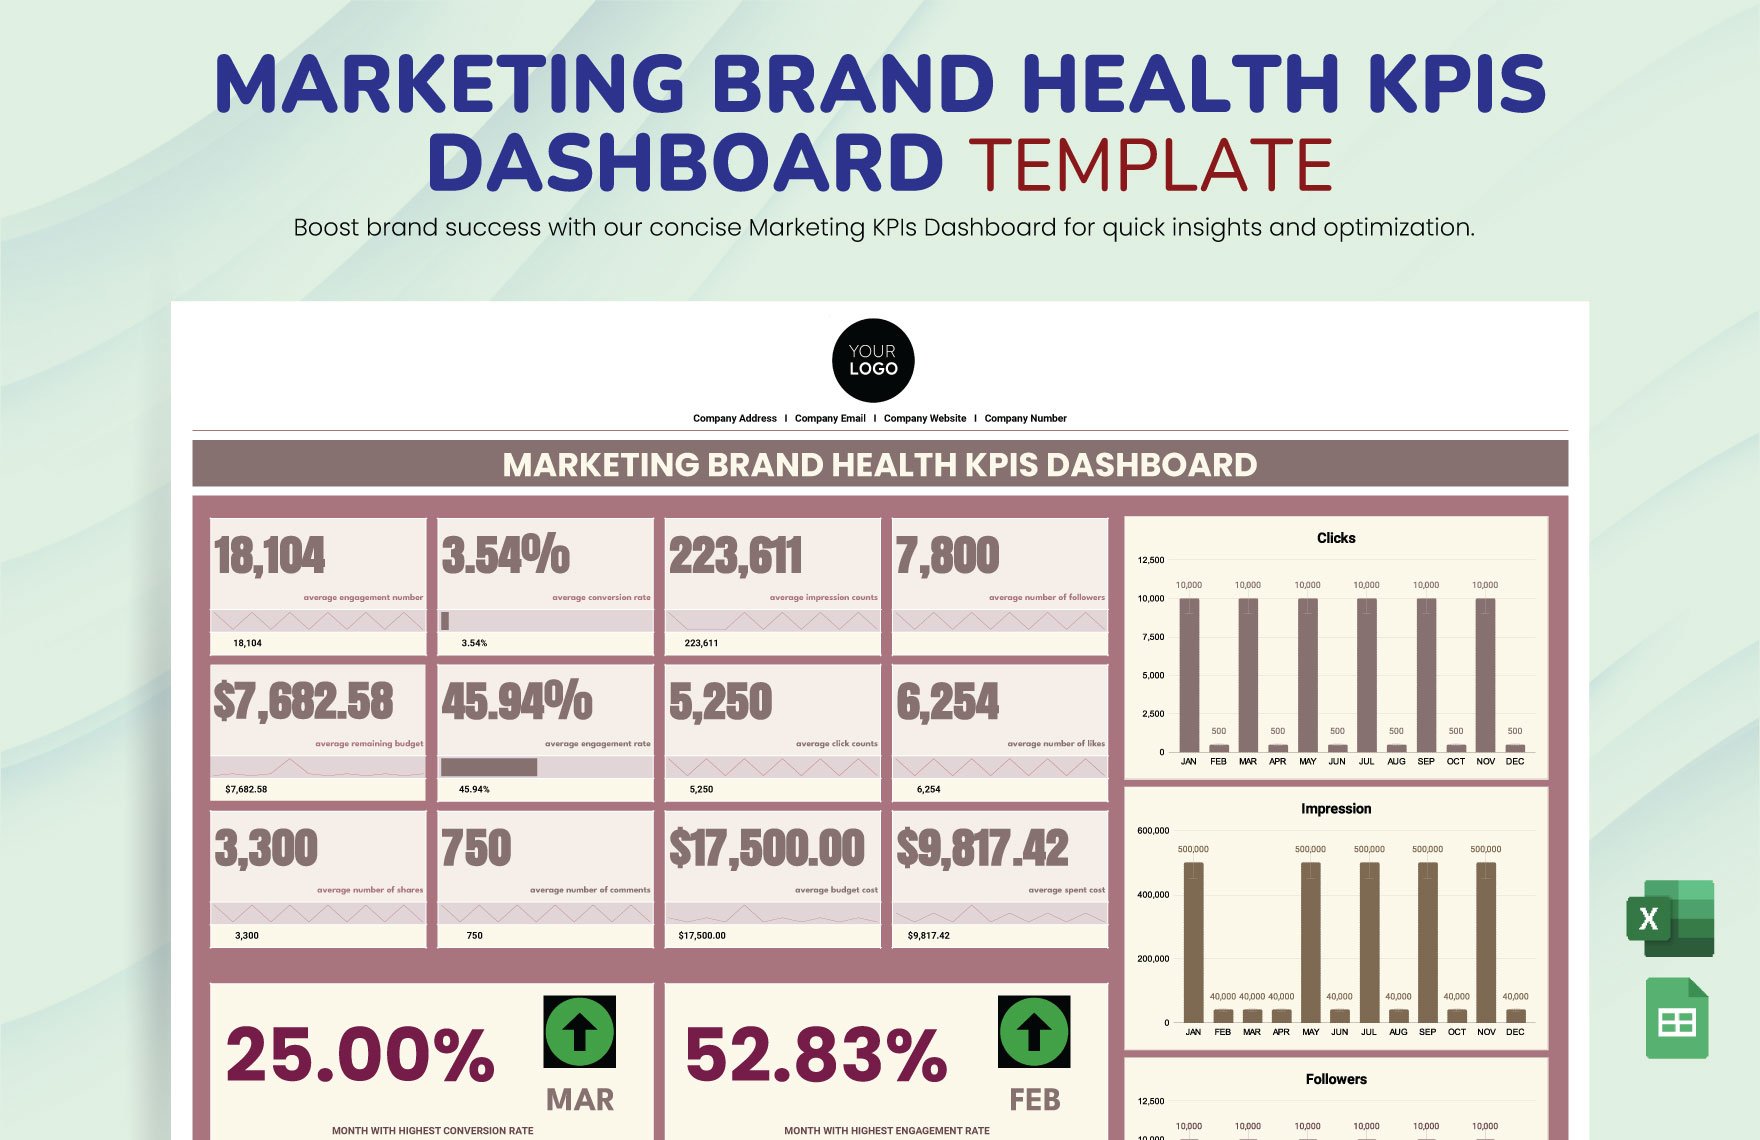
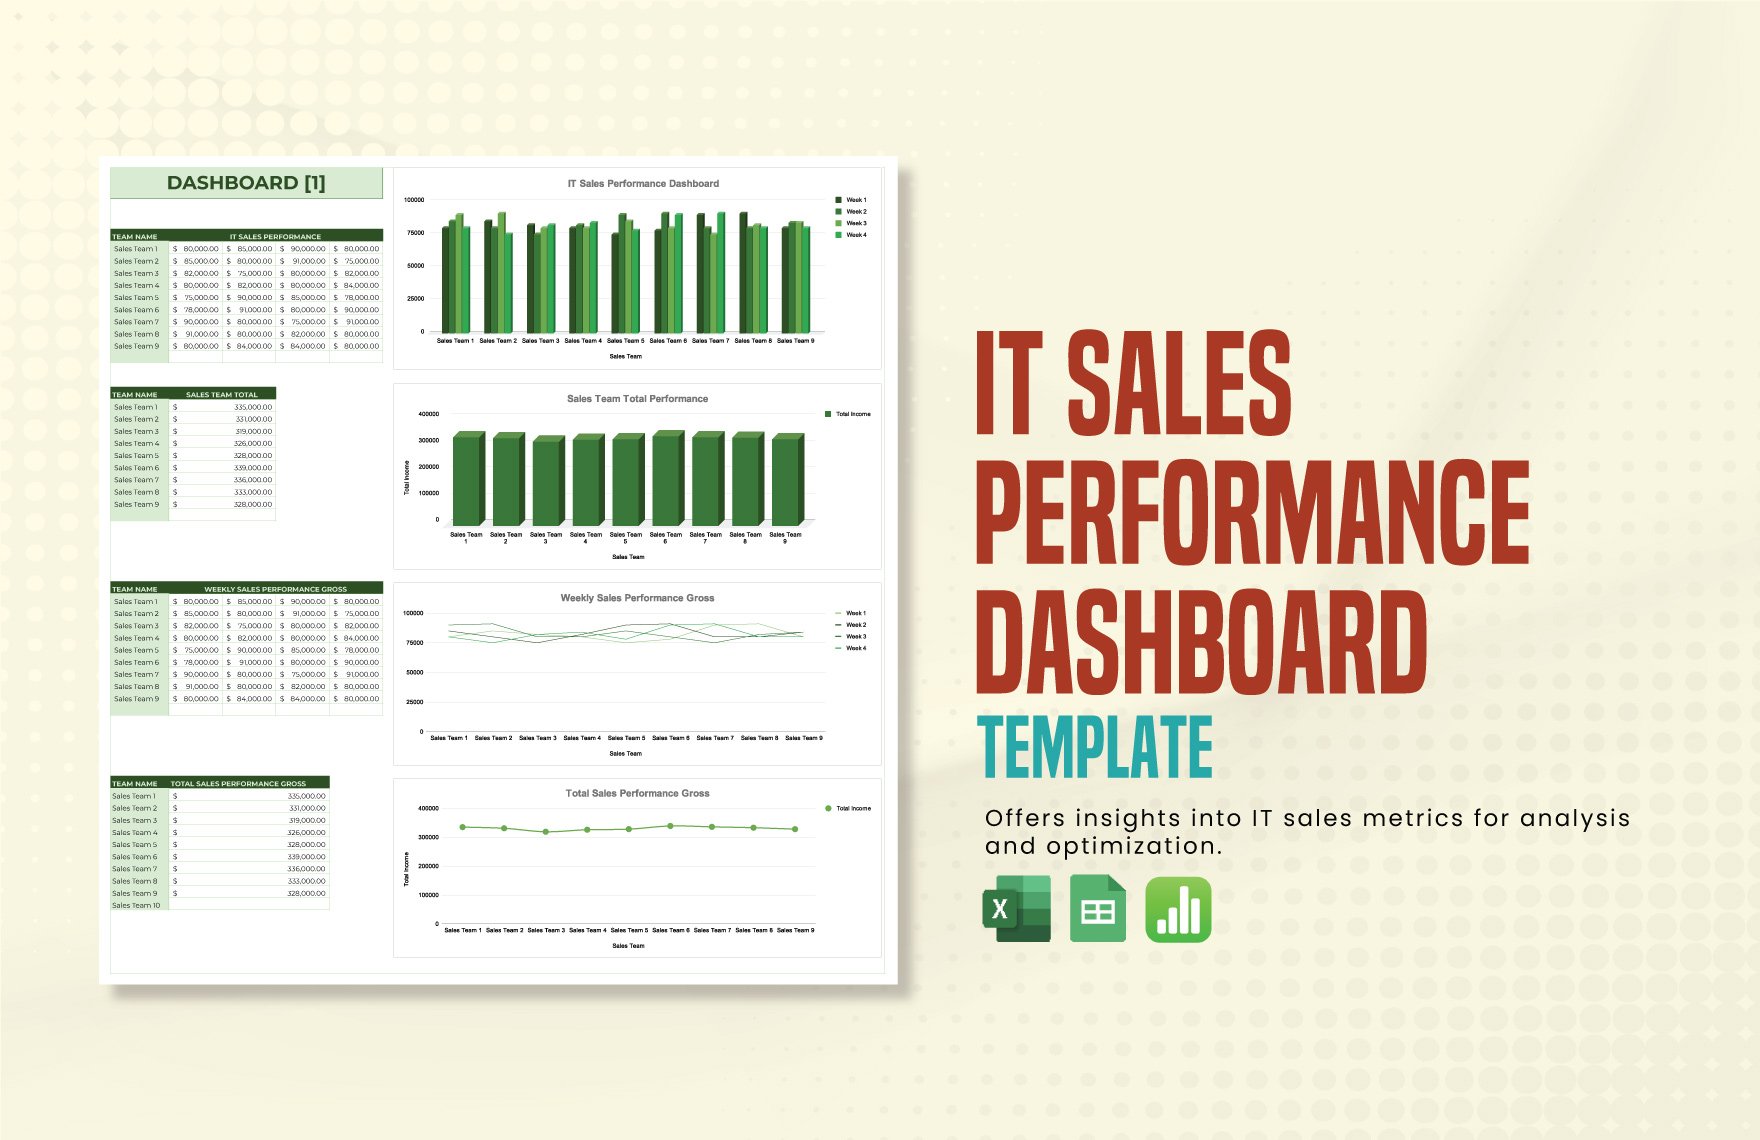
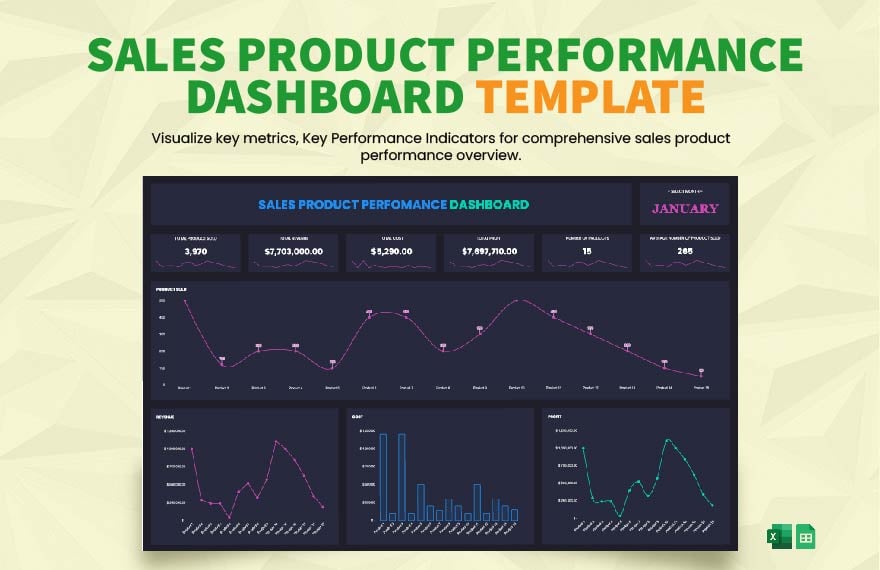
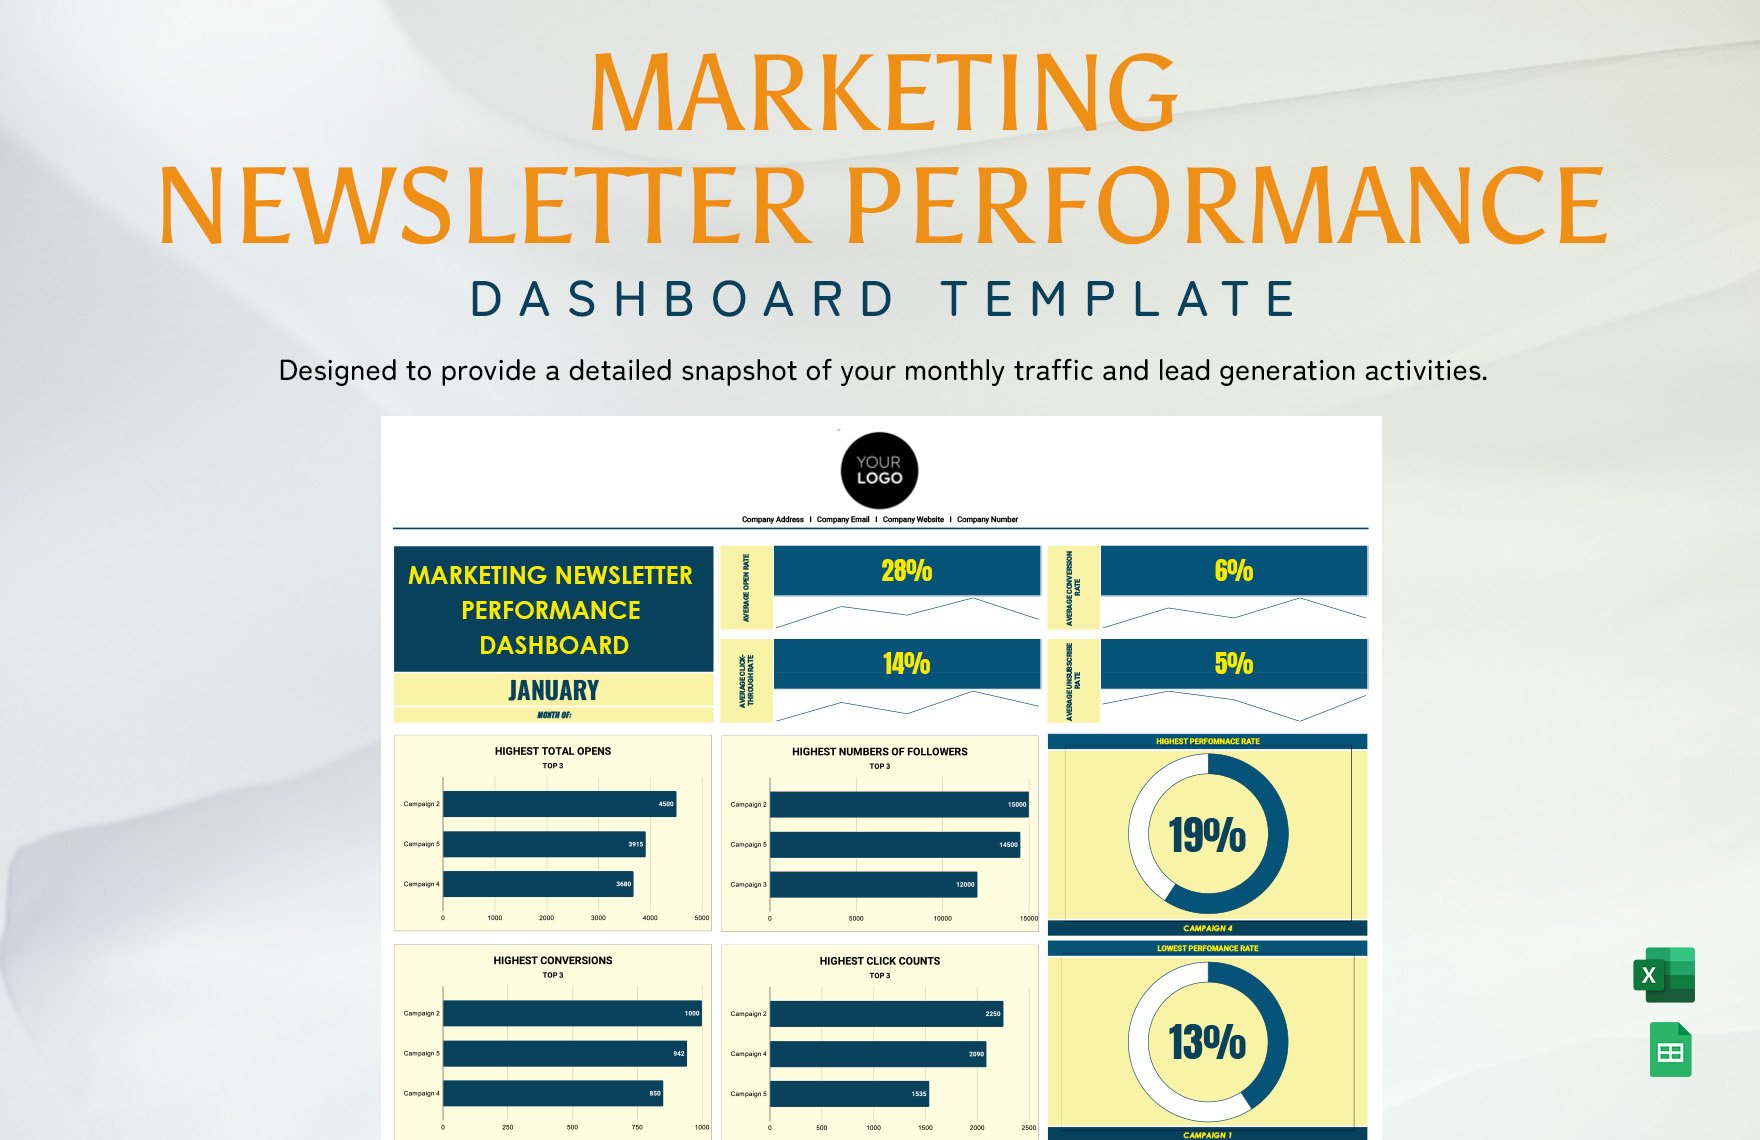
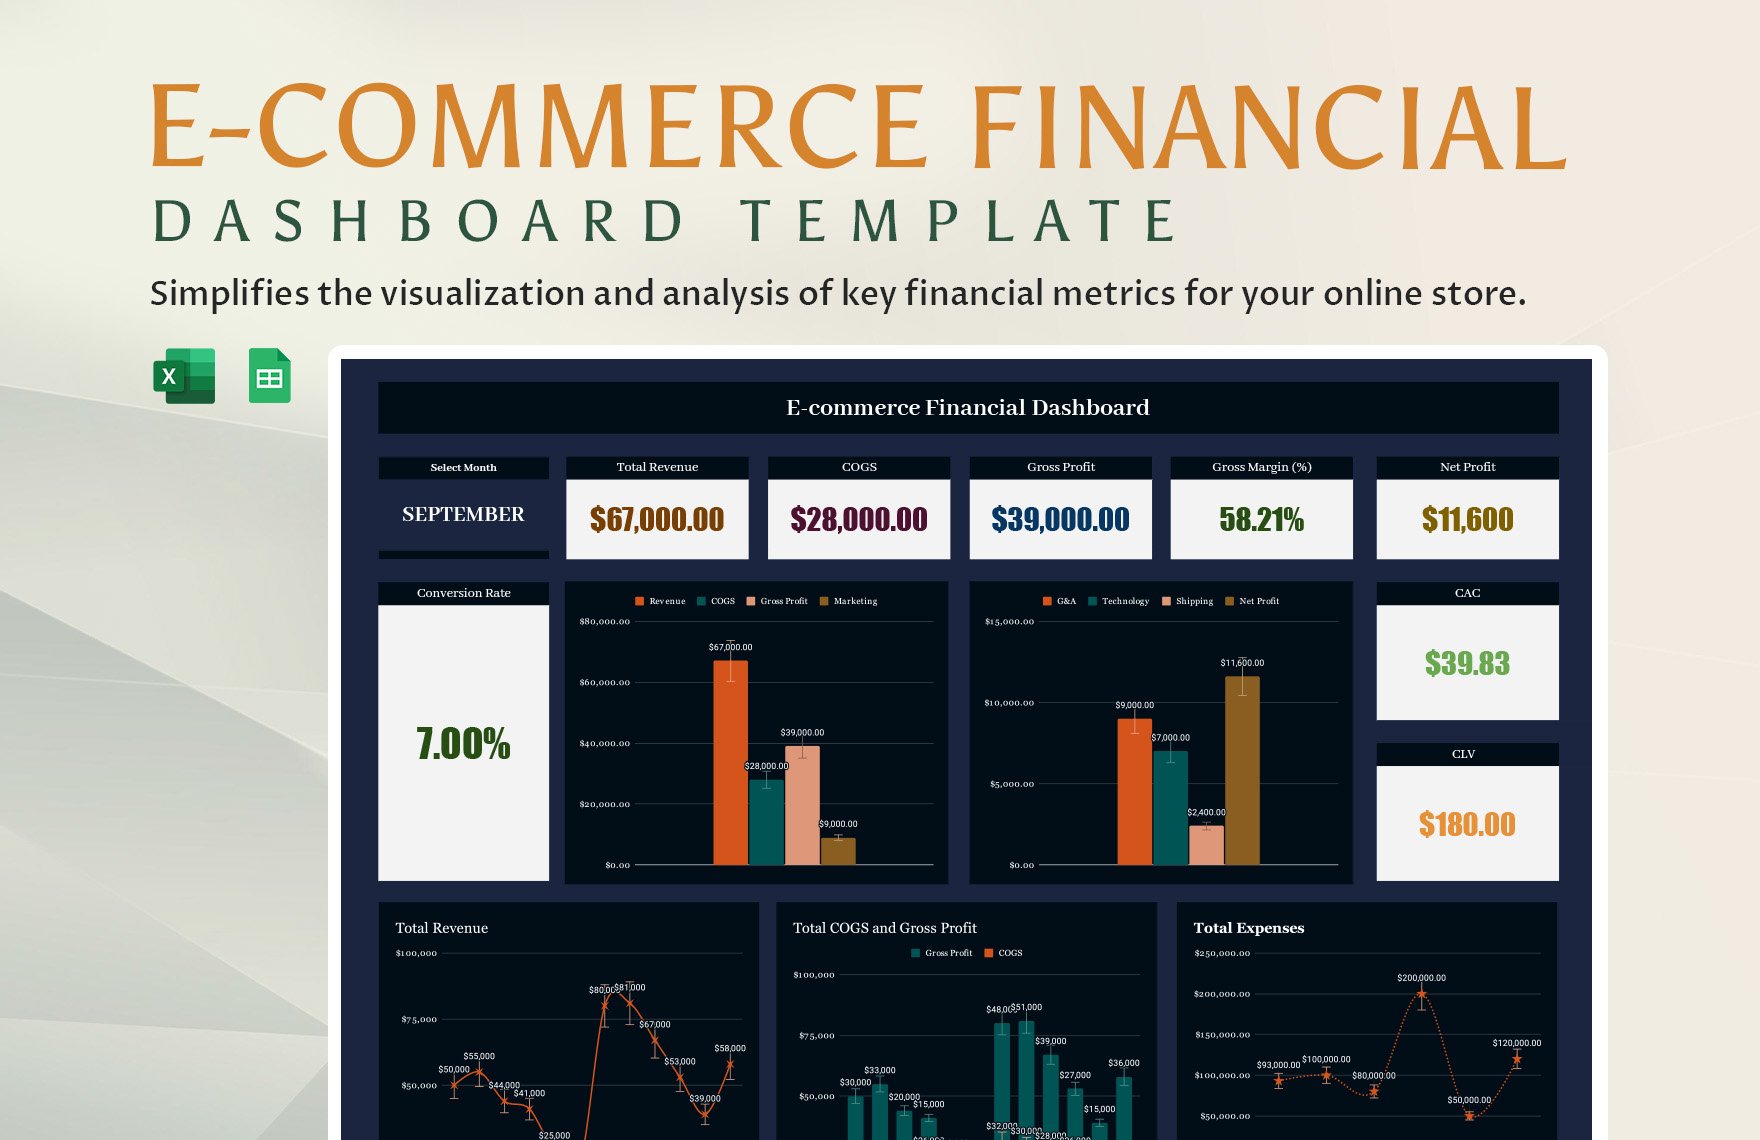
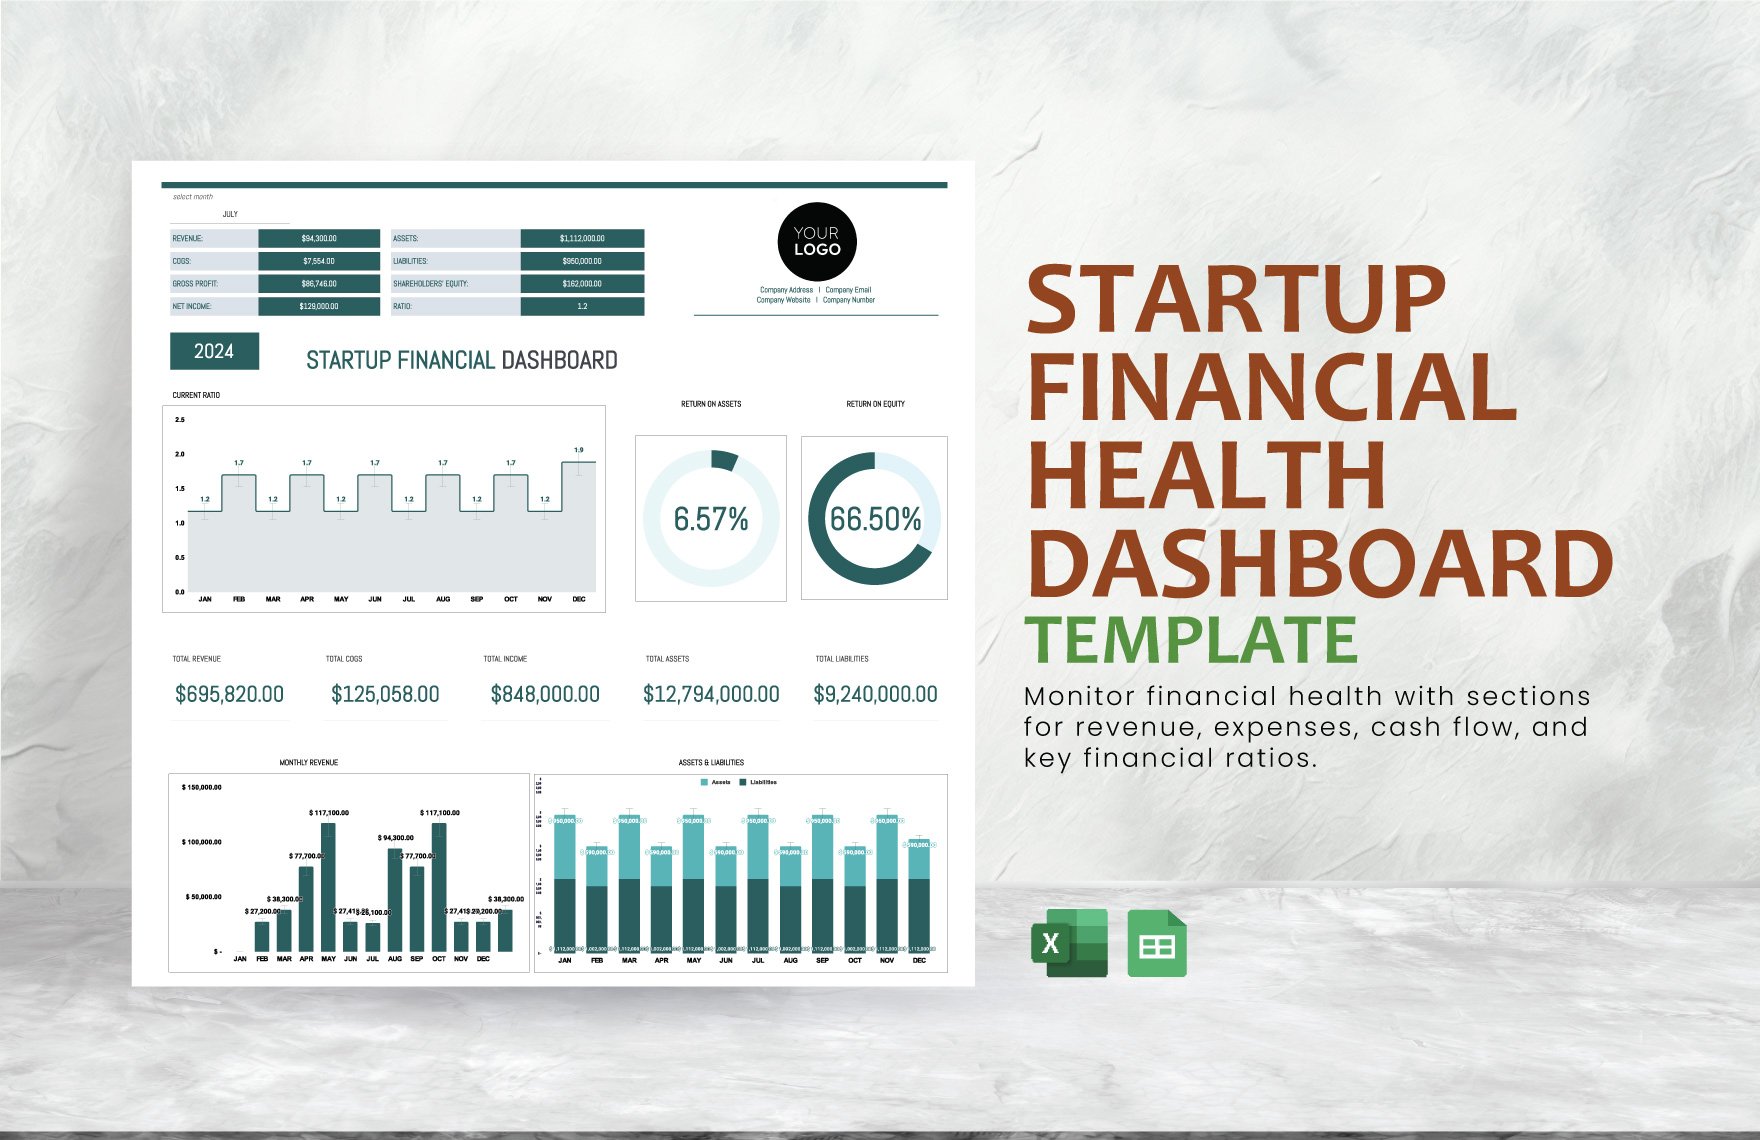
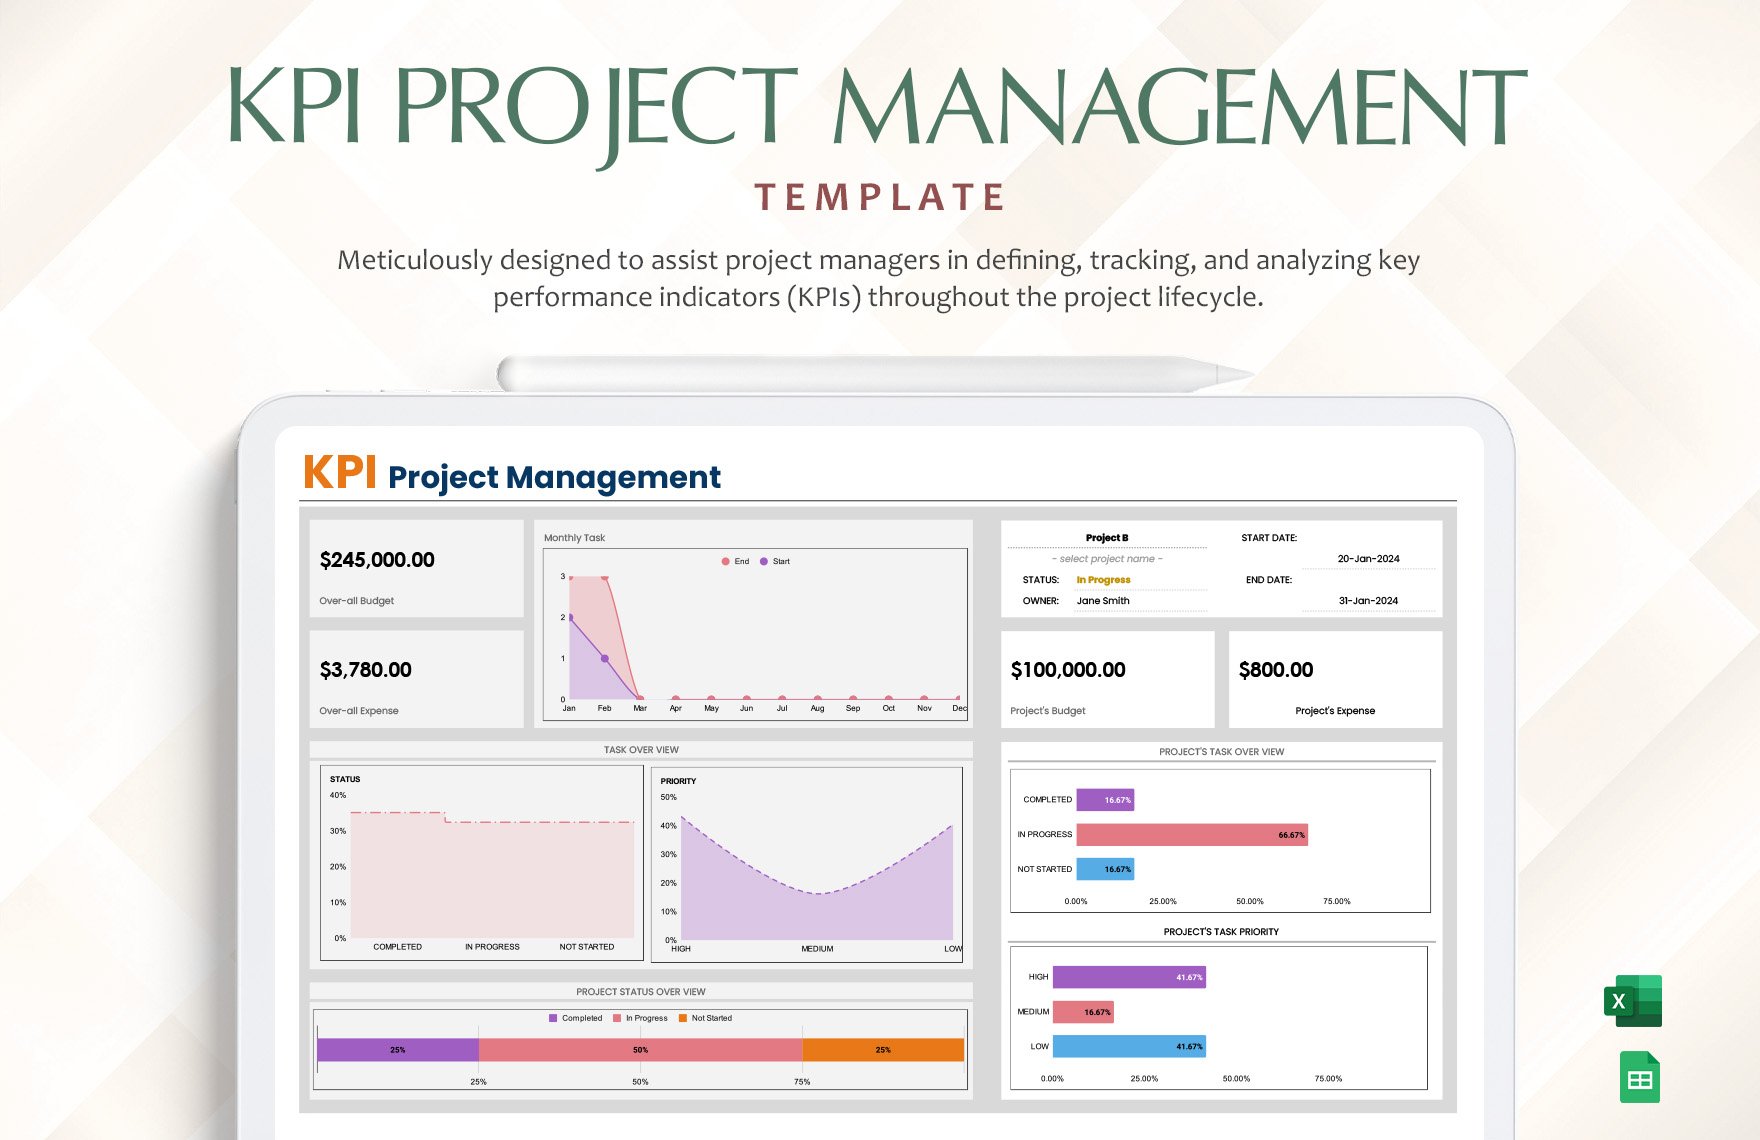
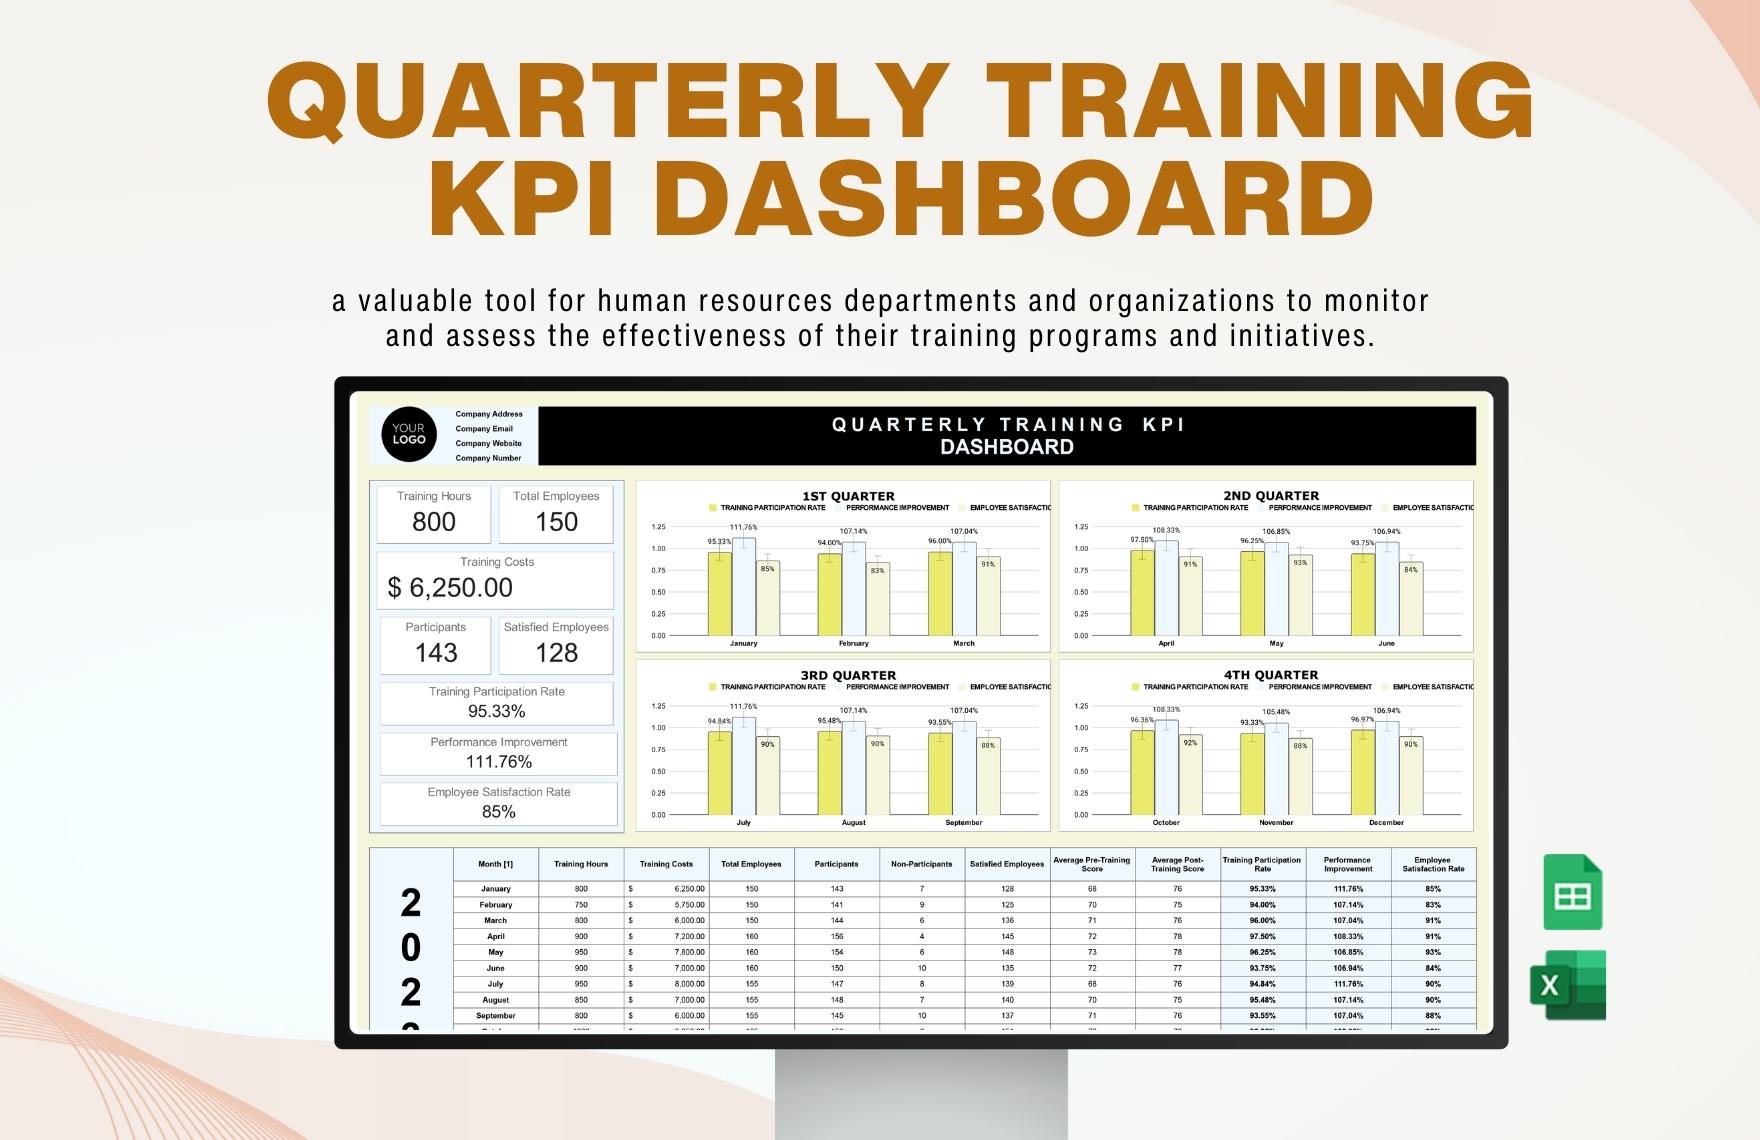
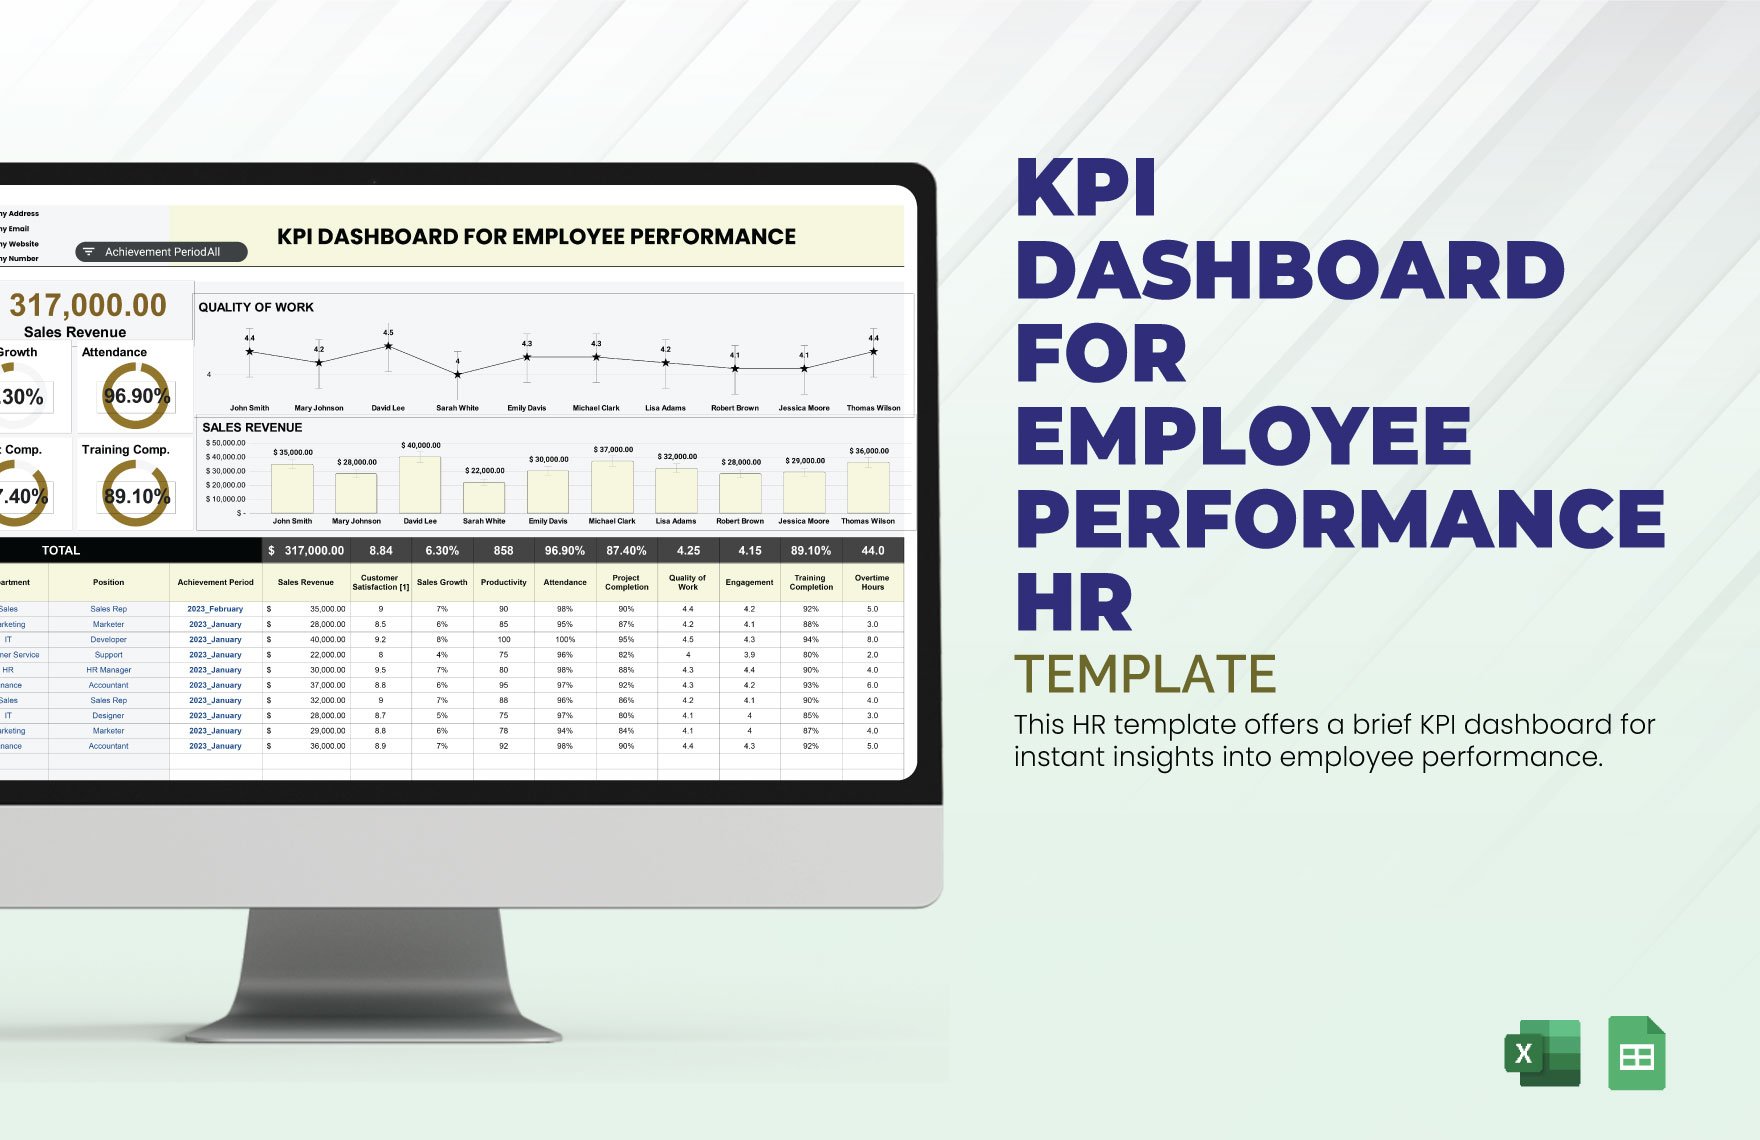
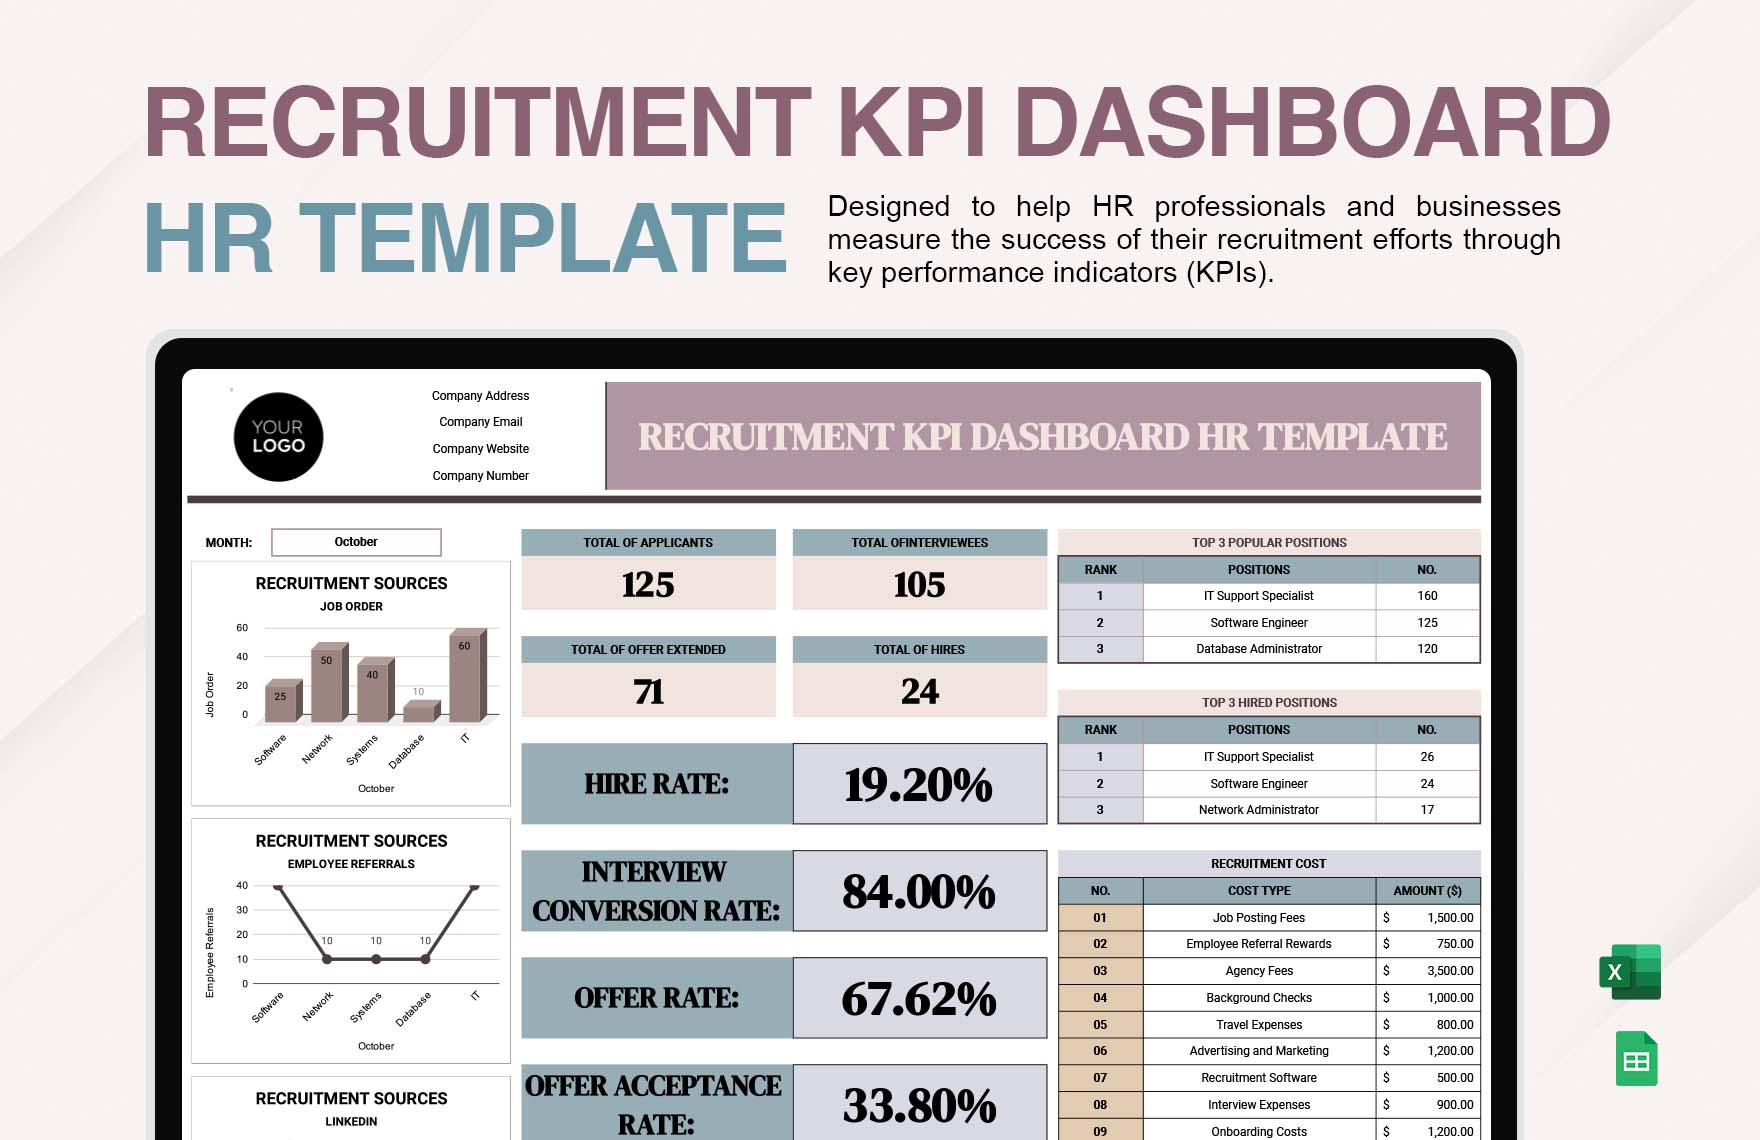
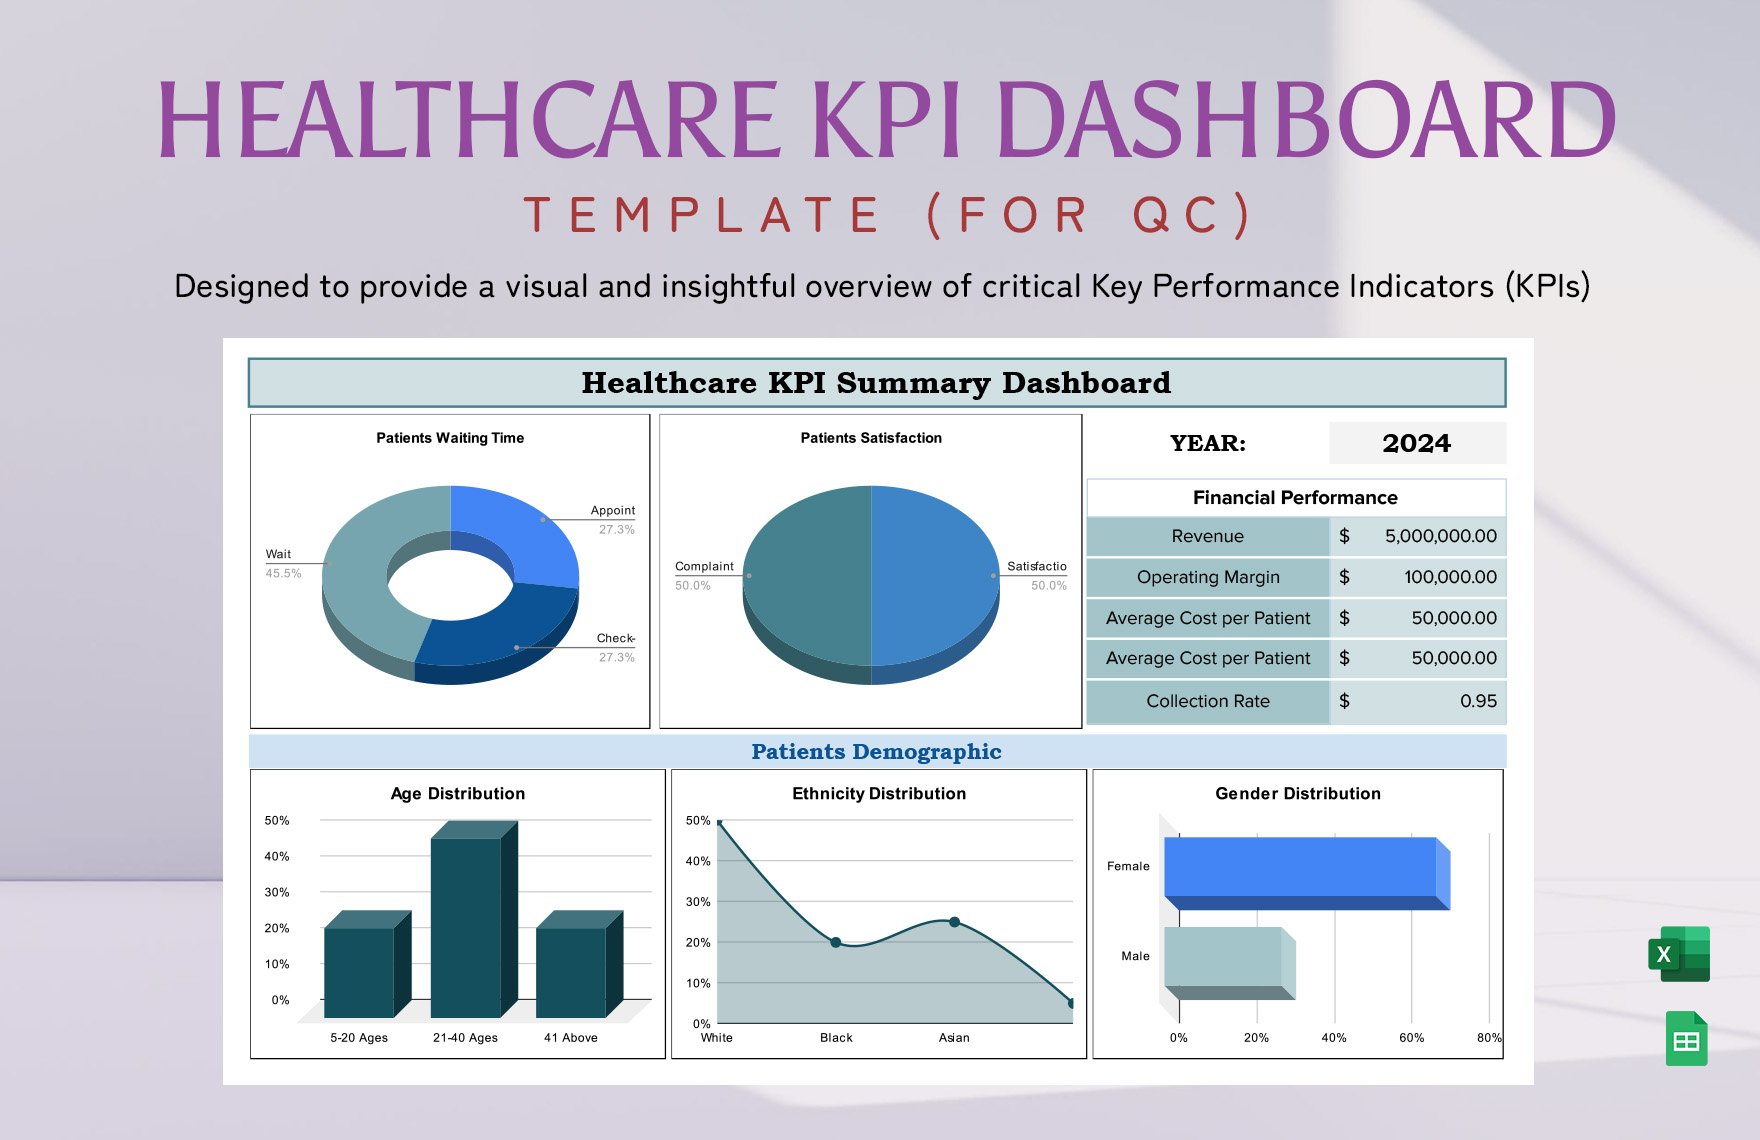
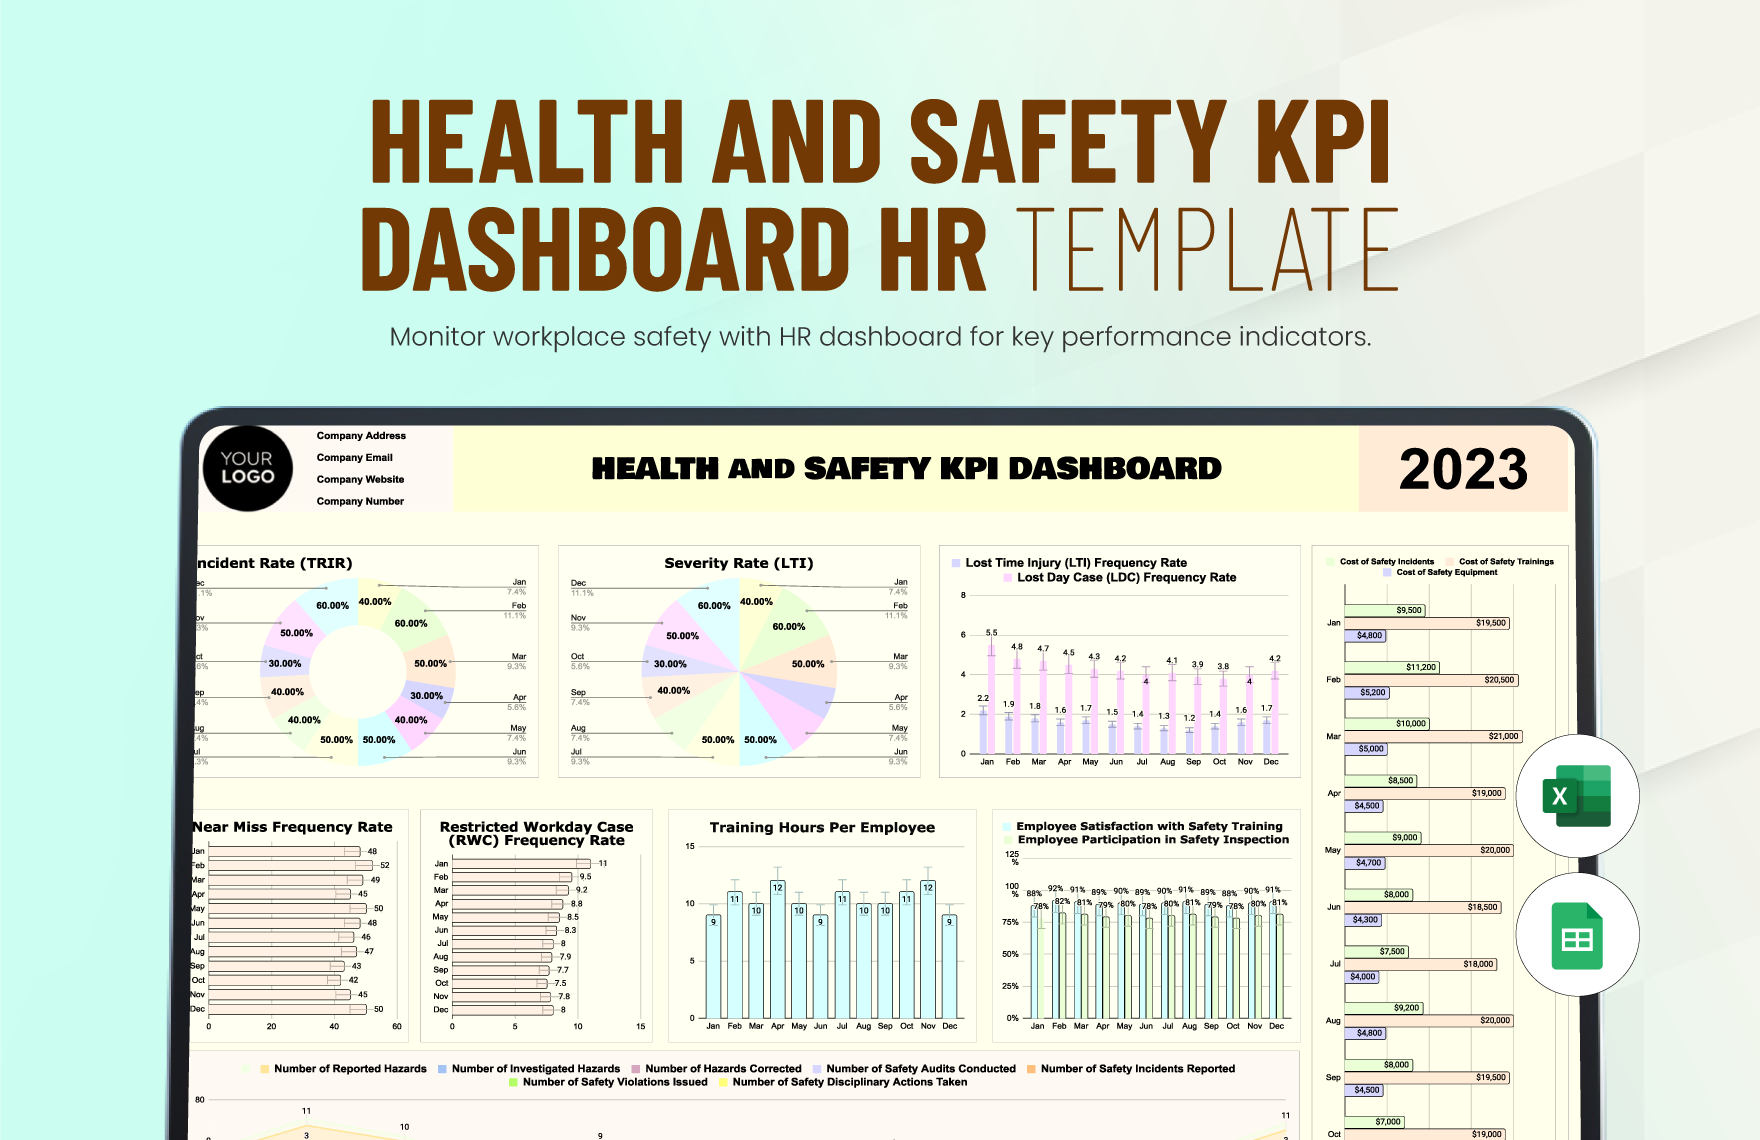
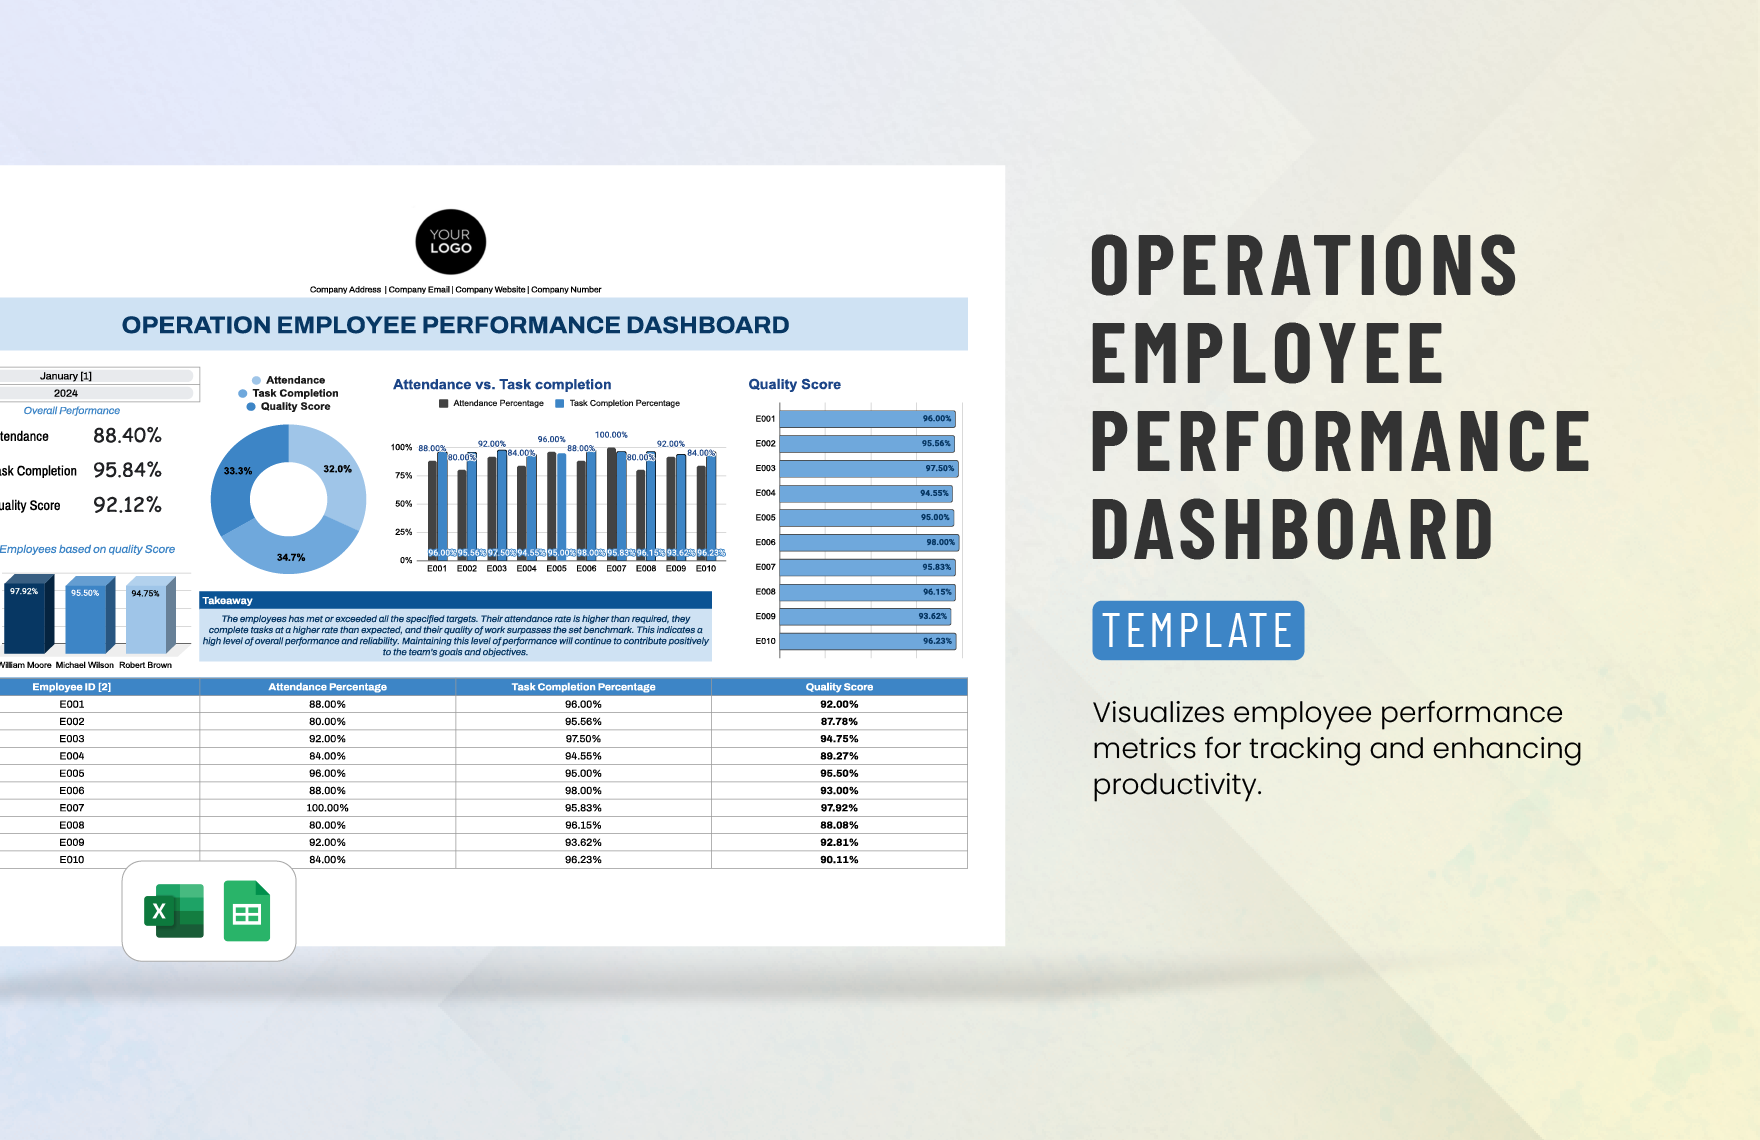
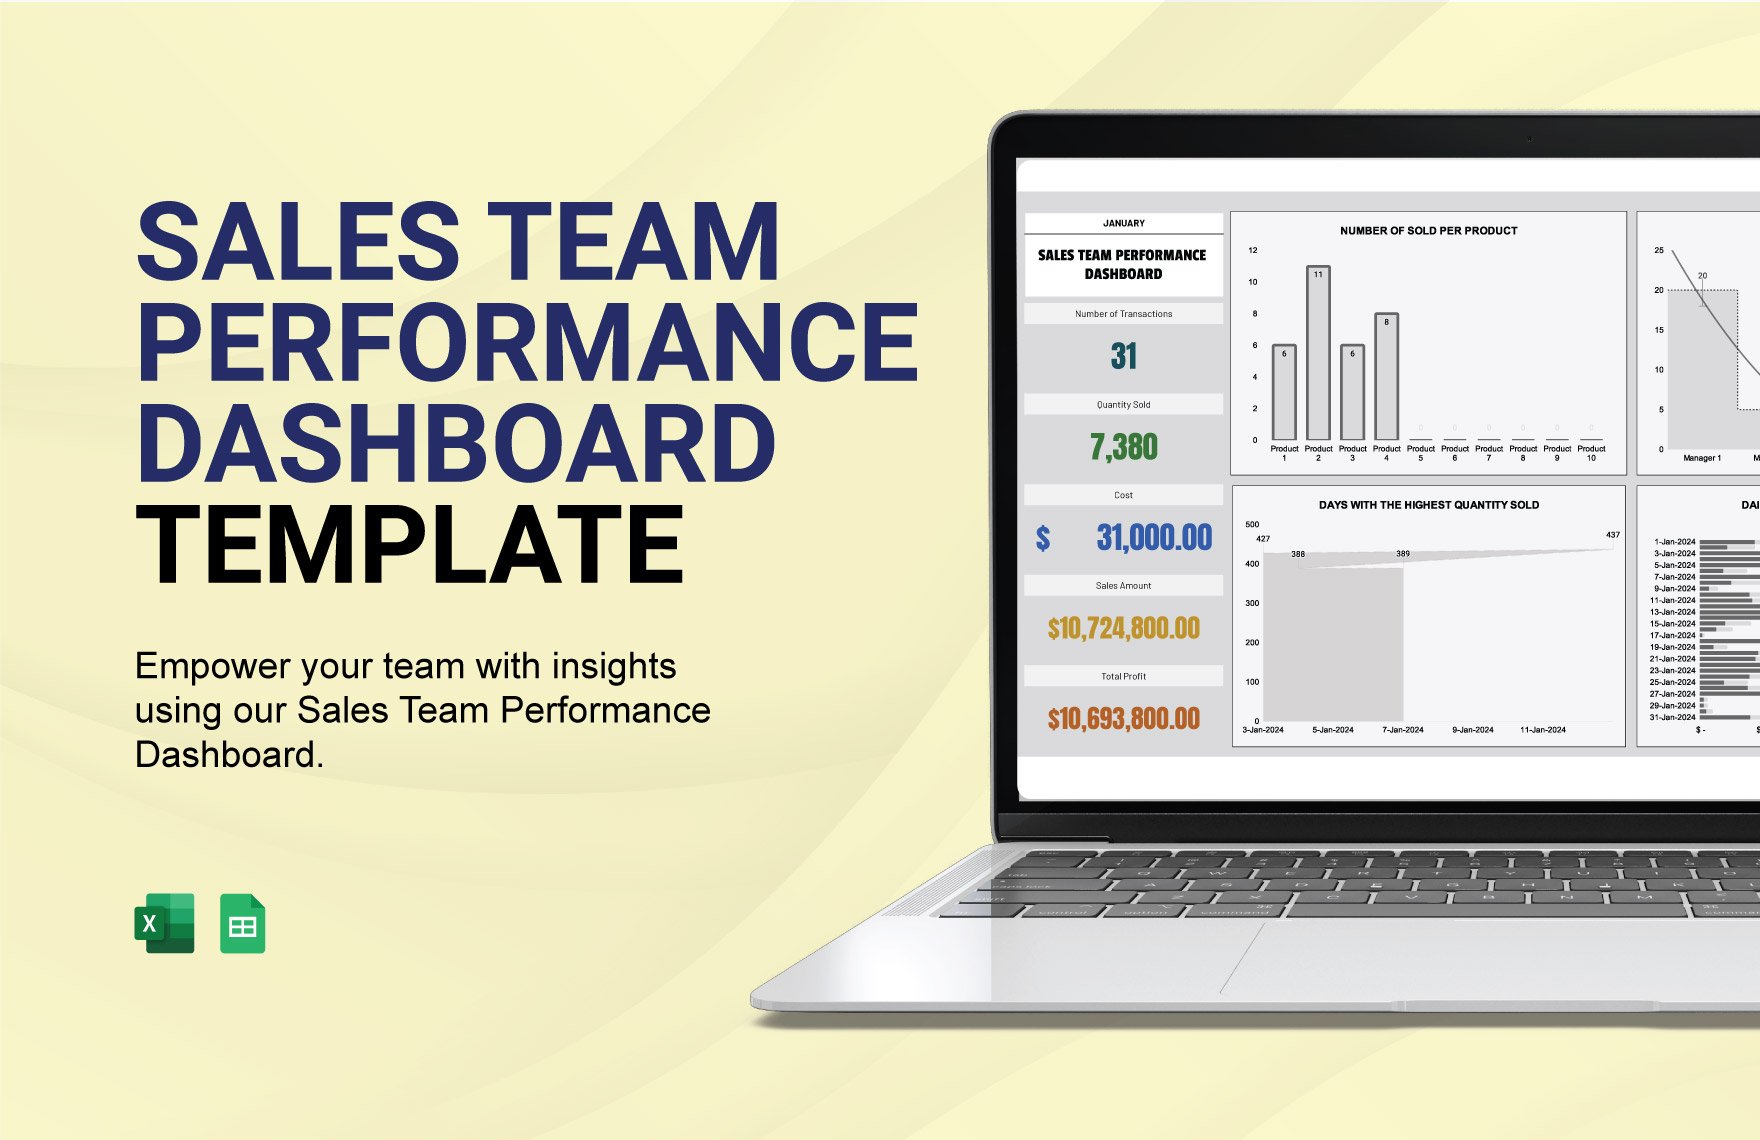
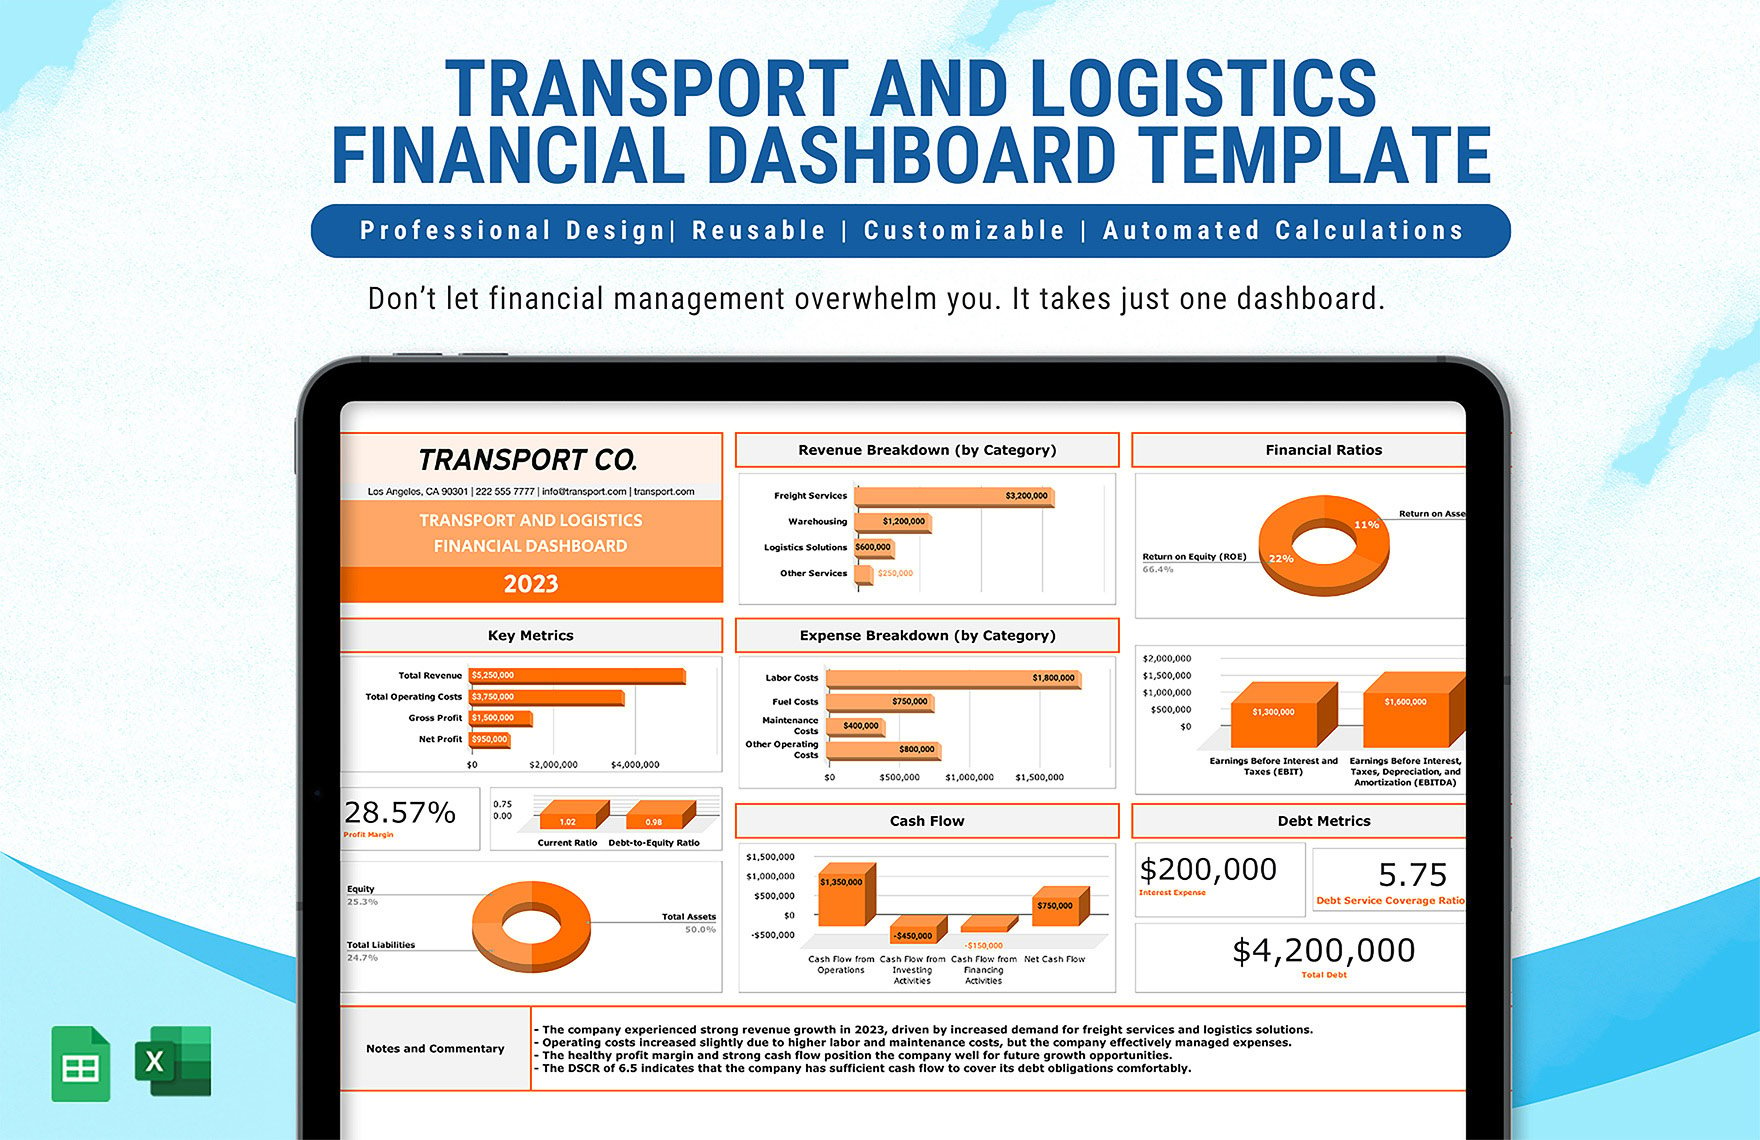
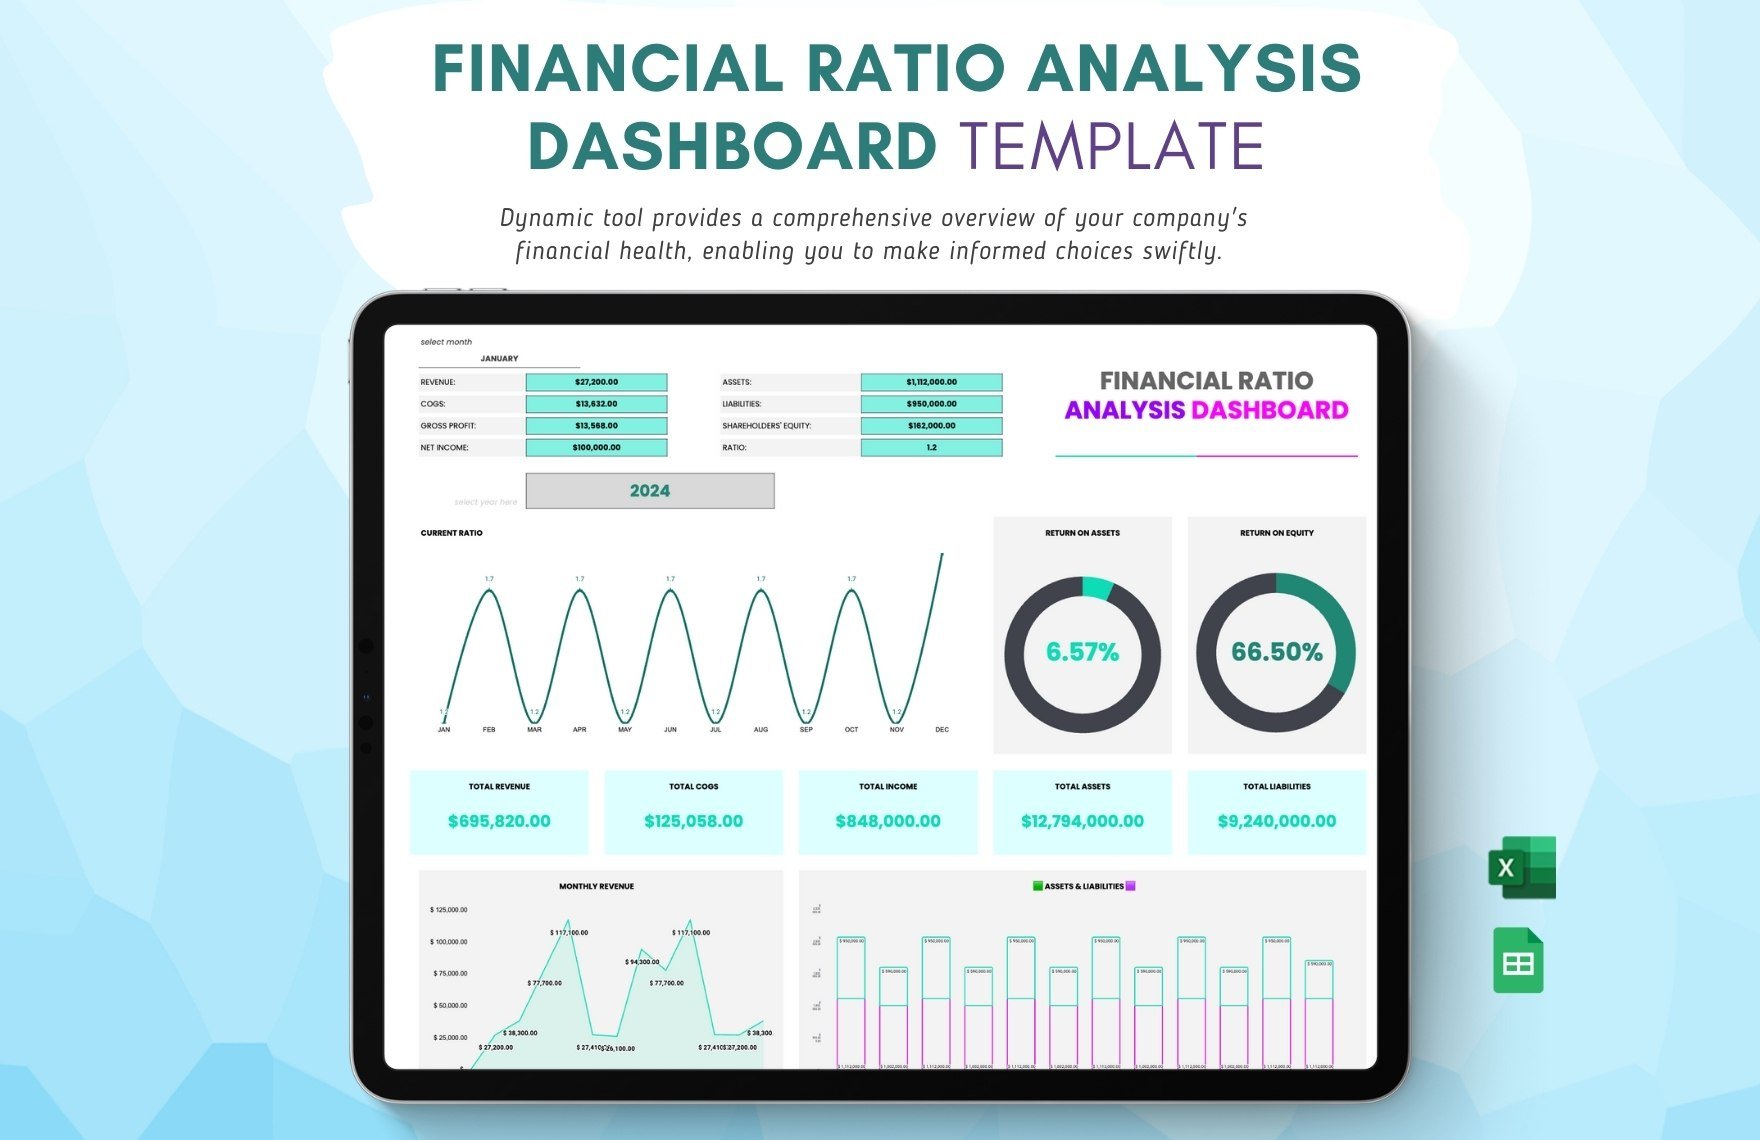
Dashboards are crucial to running a company, as they help keep track of various metrics and analytics. If you’re looking for samples to quickly create such infographics, then feel free to use our professional Dashboard Templates. Use our samples to easily update data on inventory, performance, marketing, and more. If you rely on Google’s apps, then you can edit our templates in Google Sheets without worrying about compatibility issues. Don’t delay and download now—manage your business or organization with our versatile content!
How to Make a Dashboard in Google Sheets
An article from Forbes (a long-running publication) explains that dashboards are extremely useful to executives, as they provide a convenient method of monitoring and reporting on various details within a company. So, whether you’re keeping track of marketing projects, financial data, or digital metrics, a dashboard is indispensable for such work.
Are you wondering how to design a dashboard using Google Sheets? Look no further—simply read our tips down below!
1. Prepare Your Dashboard’s Tables
Tables act as data storage and reference in your dashboard. To create a table, prepare a set of rows and columns to categorize each item. Reserve the leftmost column and top row as the header labels. In the formatting toolbar, use the Borders and Merge Cells options to make your table more distinguishable.
2. Incorporate Charts in Your Dashboard
One of the main features of dashboards is charts, which are essential for interpreting data (such as employee KPI and budget data). Add a chart in Google Sheets by going to Insert > Chart. Next, use the Chart Editor window to choose a chart type and format as needed. Double-click the chart itself to reopen the Chart Editor window.
3. Link Your Dashboard’s Tables and Charts Together
For a chart to function, it needs a table’s data as a reference. In the Chart Editor, click the Select Data Range icon under Data Range before highlighting the desired table. Confirm the table selection by clicking OK in the Select a Data Range window.
4. Improve Your Dashboard’s Readability
Make Your dashboard easily identifiable by adding a simple yet informative title at the top—like “Digital Design Team KPI” or “Healthcare Insurance Expenses.” Additionally, use smart coloring choices in your tables to segregate specific sections and make them easier to read.
And that’s the last of our tips! Did you read everything? Remember to download our Dashboard Templates to expedite your content creation!


