21+ Great Infographics
Infographic art works enjoy a dominant role in the modern digital design sector given their unique chart-based pictorial presentation. It saves the audience from going through too much of text...
June 6, 2019
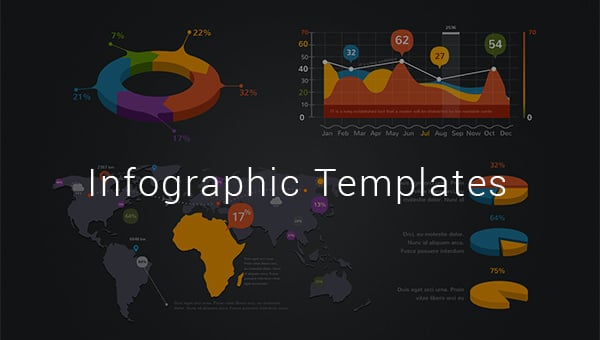
Are you looking for infographic templates? Infographic presentations command excellent popularity today and hence it would be wonderful to have...
June 24, 2019

It is no secret that people are more likely to read an infographic which has concisely-written text. Complex data tends...
November 24, 2020

You need a well-designed infographic to attract readers, customers, and clients. While others prefer to add more to the vectors,...
April 8, 2022

If you want quick access when it comes to information, a pictorial description always helps. Showing complex data with the...
June 14, 2021
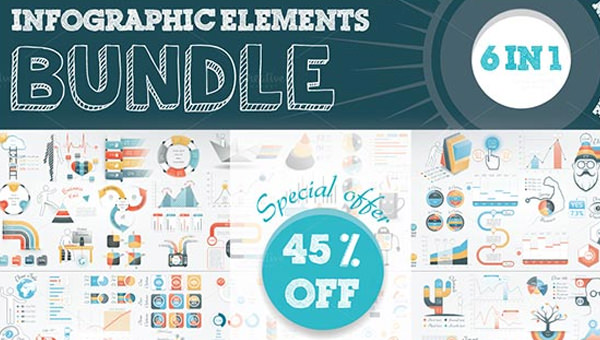
Infographic Elements are extremely helpful and user friendly when you want to convey maximum information possible via the least amount of text and confusion. Infographic Elements are a wonderful combination of pictures, graphs, pie charts, Venn diagrams and relationship schematics with minimum text content which easily convey complicated messages regarding website statistics, research analytics etc within minutes to a layman as well.
Most of these easily downloadable template or vector files come in PSD format and are hence editable using Adobe Photoshop (different version applicable for different files). While some of them solely concentrate on pie charts and other dry statistical schematics to showcase the data. Some of them have colorful flowcharts or virtual stick-on pads which can serve the same purpose. The variety in fact boosts the different requirements of the different kinds of websites who deal with stats each day.
While some of these infographics can be used by websites directly, some of them can be used to create PowerPoint presentations, online brochures as well as printable ones too. Being vector format, most of these files retain their high quality design and can be stored across multiple formats after being edited. Some of them can also support different resolutions and are undoubtedly fully scalable. They can be edited using Adobe Illustrator, Corel Draw, Inkscape, Sketch and affinity; the free versions of most of which suffice. Lookout for amazing and free Infographic Elements which can be used for more purposes than imaginable.