


32+ Christmas Stationery Templates
Christmas is one of those most cherished occasions of the year when we love to send our holiday greetings to…
Dec 20, 2020


Apr 12, 2024
Do the usual and common bar graphs bore you? Not to worry. We’ve provided you here with a list of bar graph design templates that will spice up your figures. Figures and graphical representations should not be boring. They should be emphasized because these figures are not easy to research.

We understand that researching and validating figures and statistics are a stressful endeavor for some. To help you escape from that, feel free to download our bar Graph Templates that will suit your topic.


 cmmr.usc.edu
 mathcoachinteractive.com
 cengage.com
 education.com
 teachitlanguages.co.uk
It is good to know that bar graph template are not a recent phenomenon. They have been serving mankind for many years. Here are some historical highlights based on historians:
As early as 1785, Joseph Priestley published a timeline-type graph upon which he plotted horizontal bars. History says after approximately 20 years more or less, William Playfair used the bar graphs to present the export and import patterns of Scotland. They say that his presentation was the first one to incorporate numerical figures in a bar charts.
Then, in the succeeding years, mathematicians and philosophers had their own ways of using graphical representations to suit their theories.
As you see, no matter how irrelevant they may look, bar graphs have a rich ad interesting historical background. Until now, they are still a great way of showing numerical data in a not so boring manner. With this, you can always use our Blank Graph Templates if you want to present your data from scratch.
 www.teachervision.com
 intel.com
 bemidjistate.edu
 mathwire.com
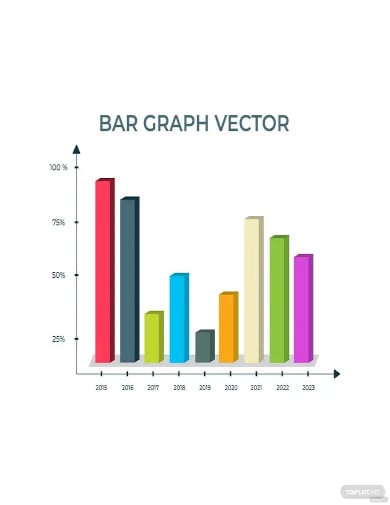
Dictionaries define bar graphs as “a diagrams that uses proportional-width bars to compare data among categories.” It is a good way of presenting data in an organized and intellectual manner. It can be horizontal or vertical. Here are some of our free templates made for your benefit:
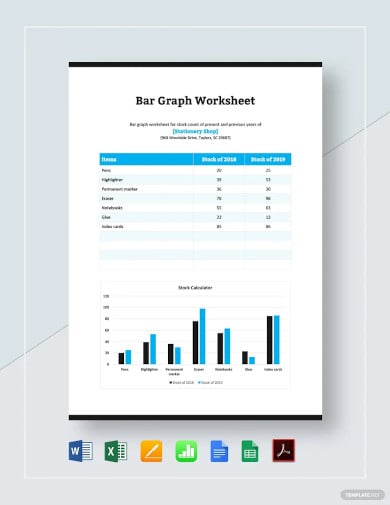
These are just some of our sample templates you can use to level up your data presentation. Bar graphs have three key attributes according to research:
Indeed, they are very relevant to the field of knowledge. For instance, in the case of weather bar graph, the changes are very easy to spot on compared to other graphical representations.
Christmas is one of those most cherished occasions of the year when we love to send our holiday greetings to…

Thanksgiving is a time to reflect back on the good things that God has done for you in the year…
Brochures are concise and visually appealing forms of advertising or promotion for your company, brand, or business. They are completely…
There are different ways on how you can organize information. From school assignments to office presentations, most people are fond…

Anyone who spends his or her birthday always look forward to a unique and unforgettable birthday celebration. Most celebrants are…

A newspaper can be considered as one of the most important elements in our daily lives. Every morning as we…

Everyone has at least tried acquiring or purchasing a ticket once in their lives. Tickets are an essential document in…

Service ticket is a small form, which contains information for a certain service. This also serves as a proof to…

Skull art originated from the Aztecs before the Spanish colonization of Central America. The origin of the skull art started…