32+ Christmas Stationery Templates
Christmas is one of those most cherished occasions of the year when we love to send our holiday greetings to…
Nov 25, 2024
A Triple Venn Diagram is a versatile visual tool that represents relationships among three distinct sets of data. It is widely used in mathematics, science, and business to analyze overlaps, intersections, and unique differences. By organizing information in this way, users can quickly identify shared and unique traits, enhancing clarity and comprehension for complex problems.
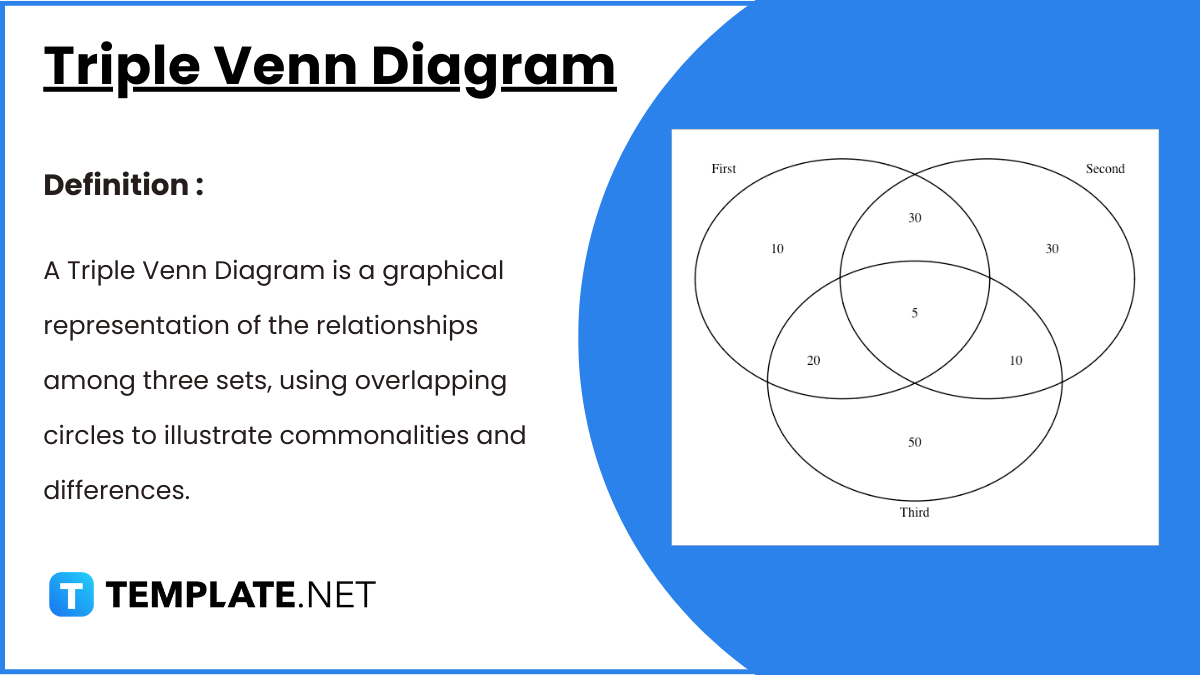

Consisting of three cycles, this diagram template is bets for illustrating more than three items. Six titles can be written in it with a space for the topic and name. It’s downloadable here in Word format, PDF, PSD, XPS and PPT formats.-educationworld.com
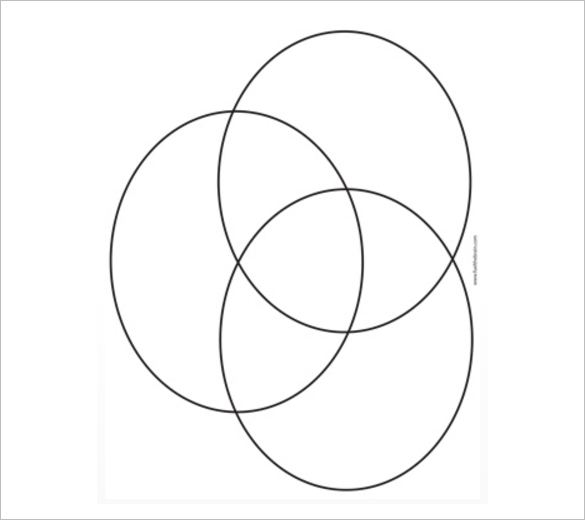
Three vertically arranged cycles makes this diagram sample template. It is plain allowing for maximum flexibility in your presentation needs. This template is available in PSD format, PPT, PDF, XPS and Word formats.
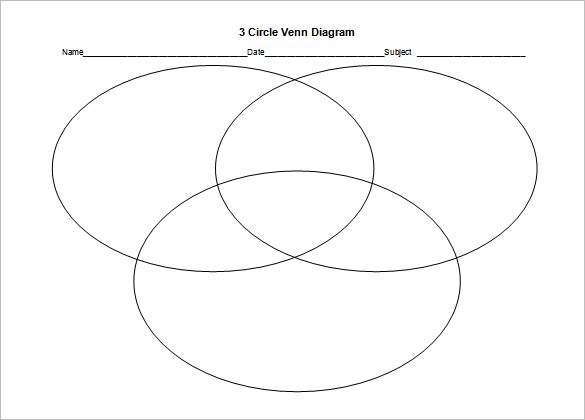
Suitable for academic use, this basic template is made of three laterally arranged plain cycles. They overlap for comparing and contrasting three items. The diagram is downloadable in PSD, XPS, PPT Format, Word and PDF formats.-ell.nwresd.org
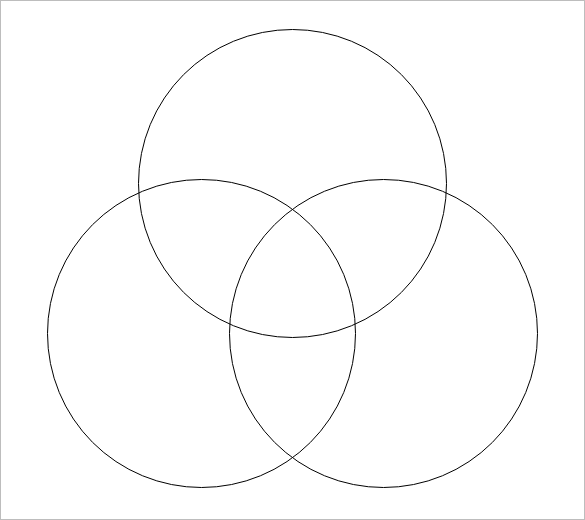
A venn diagram for sorting shapes in colors and shapes. The printable template is made of three plain cycles overlapping to create seven sectors. Download this here in Word, XPS, PSD, PPT or PDF formats. You can also see more on Shape Templates.
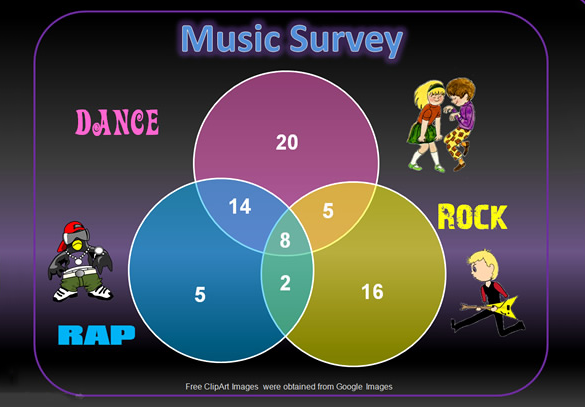
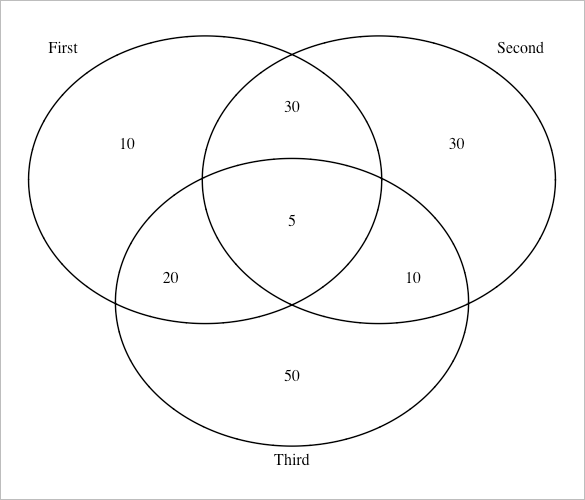
Triple Venn diagrams can be downloaded in other formats too such as word and excel format. After downloading, these formal templates can be printed instantly to create high quality diagrams. A lot of ideas as to how these venn diagrams are useful are also given. You can also see more on Coloring Pages.
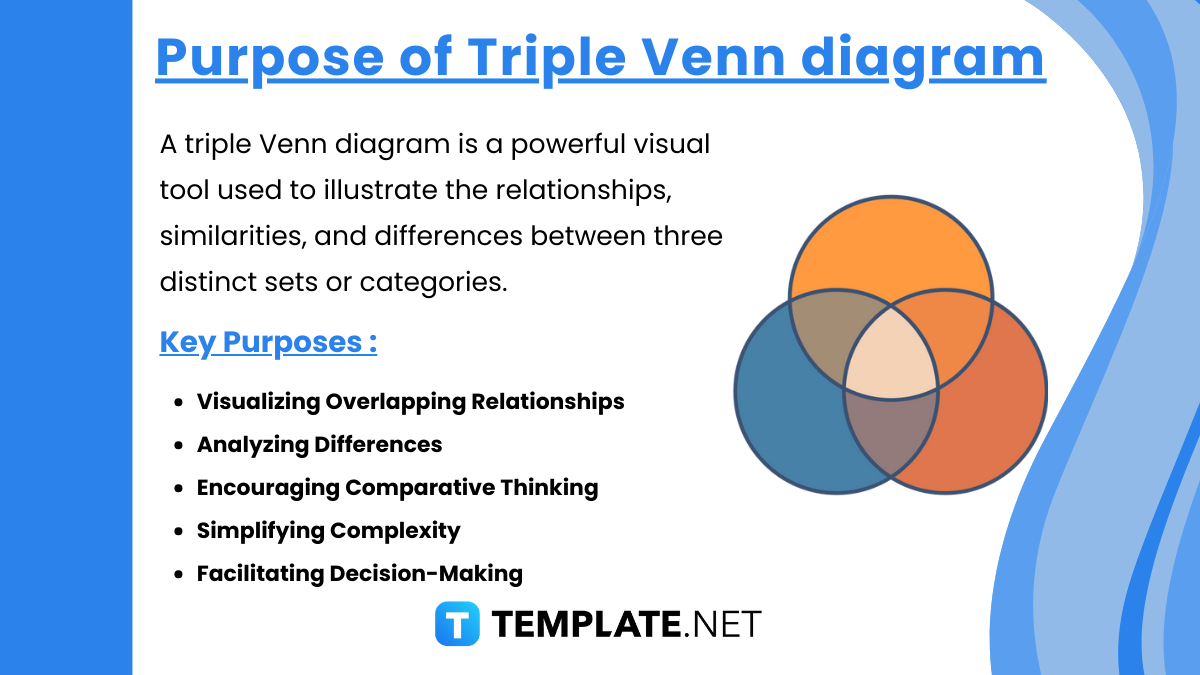
A triple Venn diagram is a powerful visual tool used to illustrate the relationships, similarities, and differences between three distinct sets or categories. Its purpose is to help analyze and interpret complex data by organizing it in a clear and structured manner.
Key Purposes of a Triple Venn Diagram:
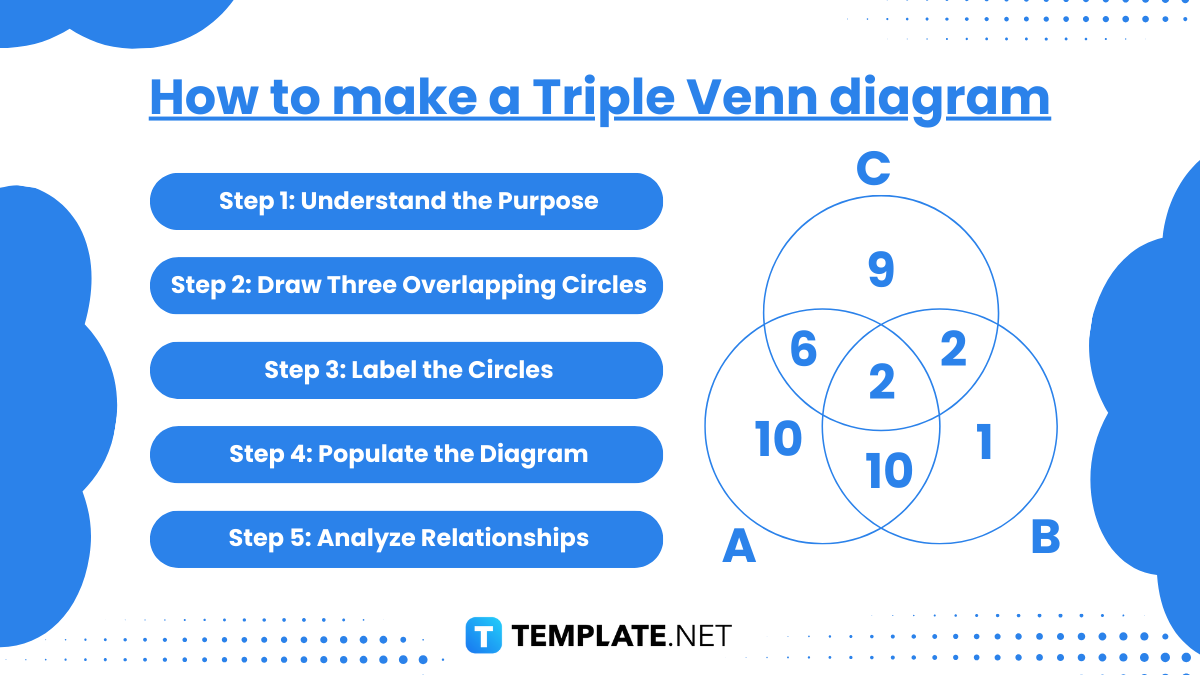
Creating a triple Venn diagram involves illustrating the relationships among three sets or groups using overlapping circles. Here’s a step-by-step guide:
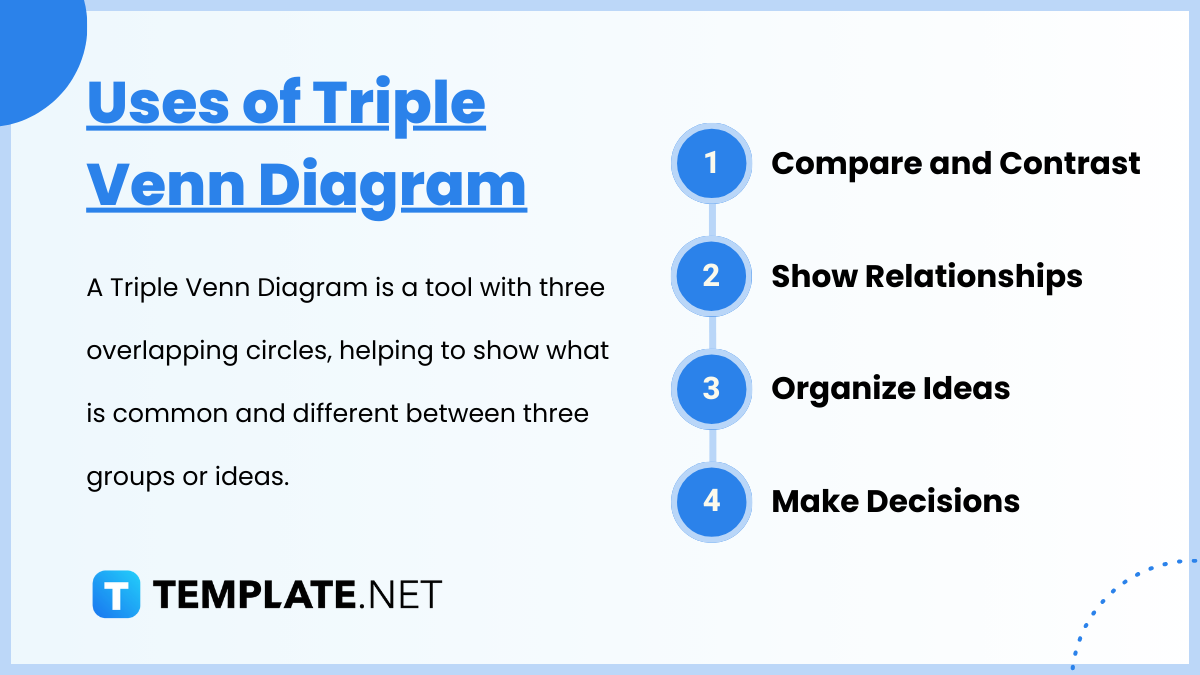
A Triple Venn Diagram is a tool with three overlapping circles, helping to show what is common and different between three groups or ideas. Here’s how it can be used:
To draw a Triple Venn Diagram, start with three circles that overlap partially. Label each circle to represent a set, then fill in the intersections with shared attributes or data.
While primarily designed for three sets, you can extend the concept. However, adding more sets complicates the visualization and may make it harder to interpret.
A Triple Venn Diagram breaks down a problem by organizing the elements into shared and distinct attributes. This structure allows individuals to identify overlapping factors or isolate unique issues, facilitating more strategic solutions.
Businesses use them to analyze market segments, compare competitors, or evaluate product features. The diagram visually identifies areas of overlap, like shared customer bases, and gaps that represent opportunities.
Tools like Microsoft PowerPoint, Google Slides, Lucidchart, Canva, and online diagramming software provide templates and customization options for creating professional-looking Triple Venn Diagrams.

Christmas is one of those most cherished occasions of the year when we love to send our holiday greetings to…

Thanksgiving is a time to reflect back on the good things that God has done for you in the year…
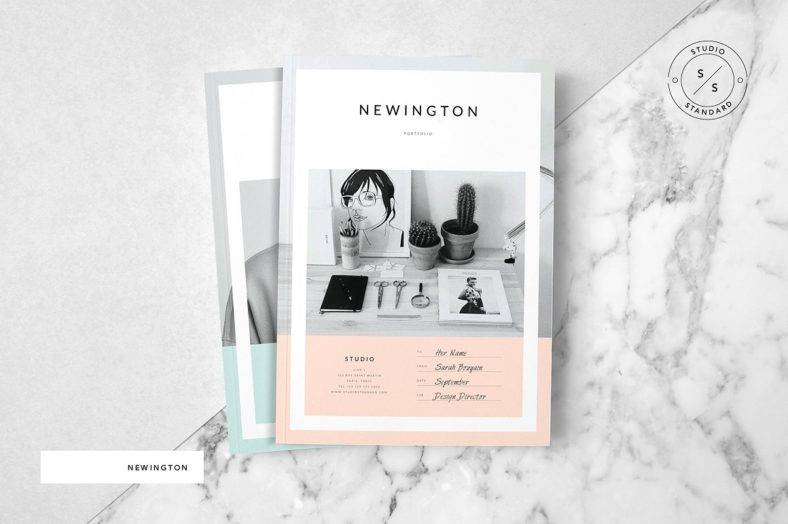
Brochures are concise and visually appealing forms of advertising or promotion for your company, brand, or business. They are completely…
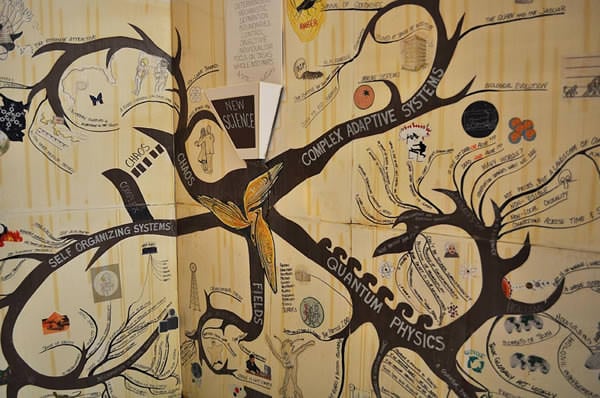
There are different ways on how you can organize information. From school assignments to office presentations, most people are fond…

Anyone who spends his or her birthday always look forward to a unique and unforgettable birthday celebration. Most celebrants are…

A newspaper can be considered as one of the most important elements in our daily lives. Every morning as we…
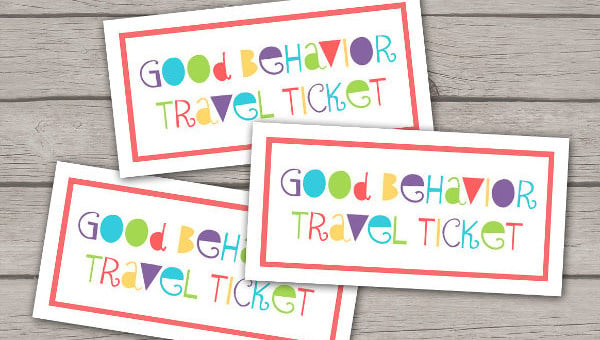
Everyone has at least tried acquiring or purchasing a ticket once in their lives. Tickets are an essential document in…
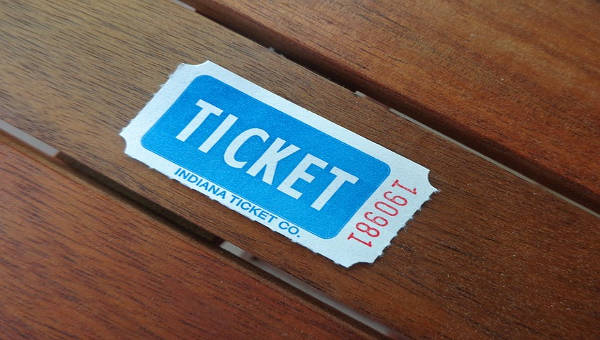
Service ticket is a small form, which contains information for a certain service. This also serves as a proof to…
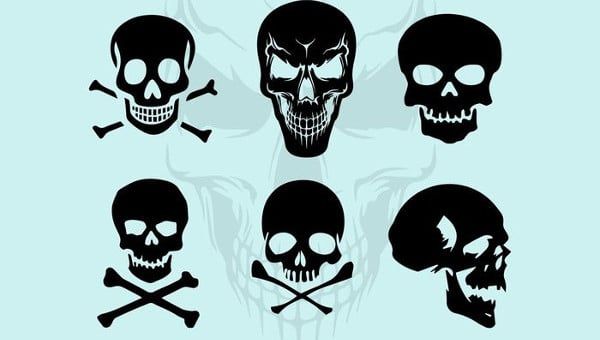
Skull art originated from the Aztecs before the Spanish colonization of Central America. The origin of the skull art started…