Employee Diversity and Inclusion Survey Analysis and Findings HR
Executive Summary
The Employee Diversity and Inclusion Survey conducted by [Your Company Name] serves as a critical tool for understanding the current state of diversity and inclusion within our organization. The survey was designed to be comprehensive, covering various aspects such as gender, ethnicity, and sexual orientation. The primary objective was to identify areas where the company is performing well and areas that require immediate attention. The survey revealed that while there is a reasonable level of ethnic diversity, gender diversity and LGBTQ+ inclusion need significant improvement. This report aims to provide a detailed analysis of the survey findings and offer actionable recommendations to enhance diversity and inclusion at [Your Company Name].
Introduction
Background
[Your Company Name] has always been committed to creating a diverse and inclusive work environment. We believe that a diverse workforce is not just an ethical imperative but also a business necessity. A diverse team brings in a variety of perspectives, contributing to a more robust problem-solving approach. This report is an initiative to understand how well we have been able to implement our diversity and inclusion policies and what steps need to be taken to improve further.
Objectives
The primary objectives of this survey were threefold. First, to assess the demographic composition of our workforce to understand how well it aligns with our diversity goals. Second, to measure the employees' perception of the inclusivity of their work environment. And third, to identify any significant gaps or areas of concern that need immediate attention.
Methodology
Survey Design
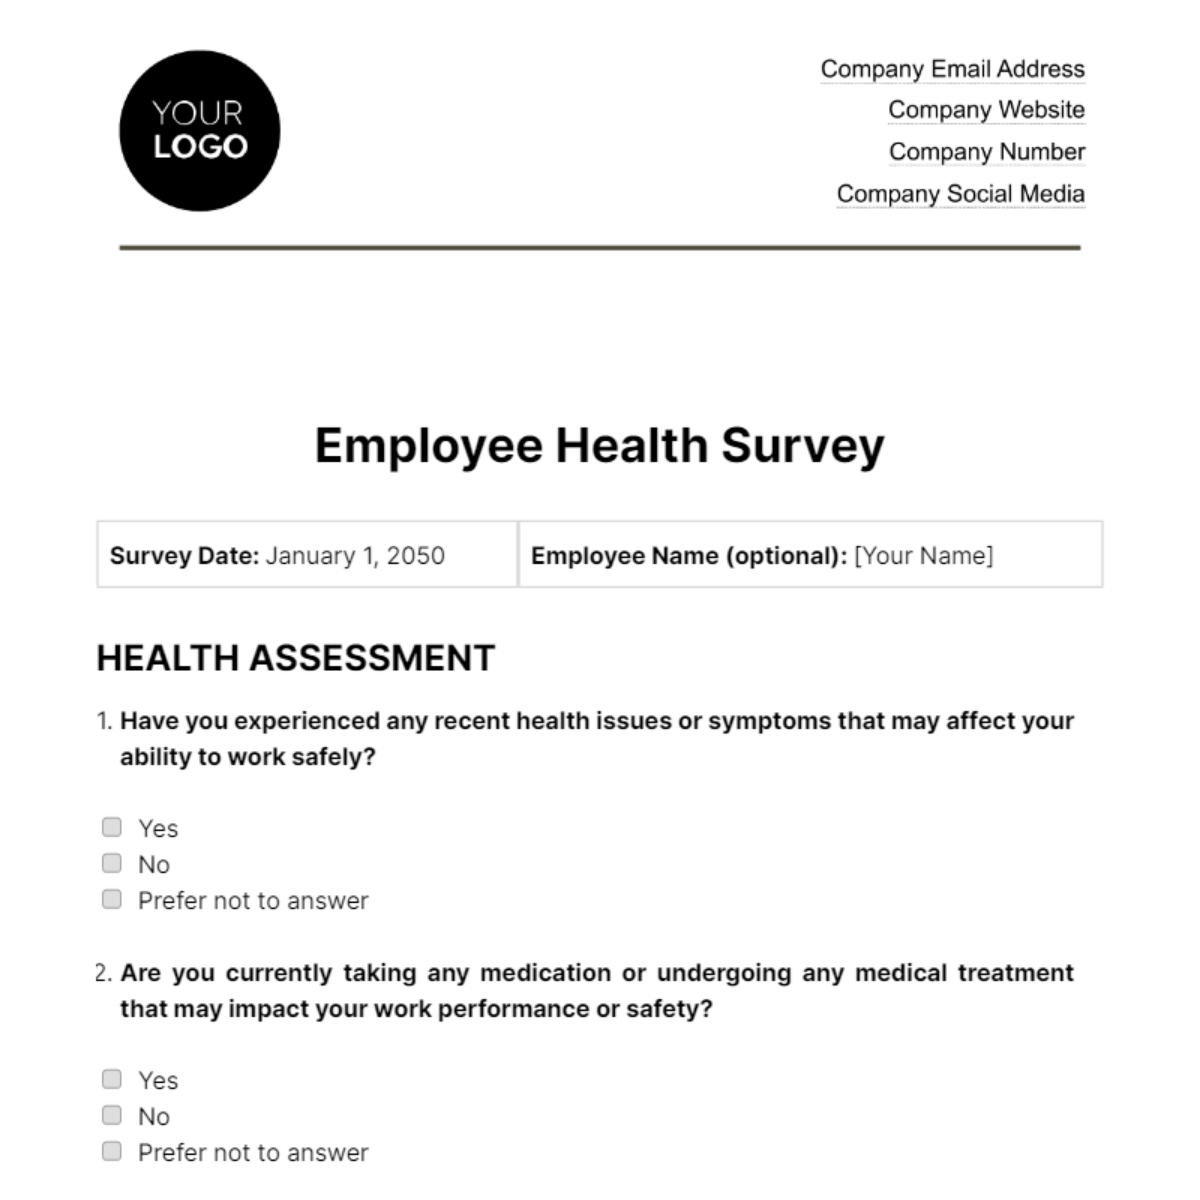
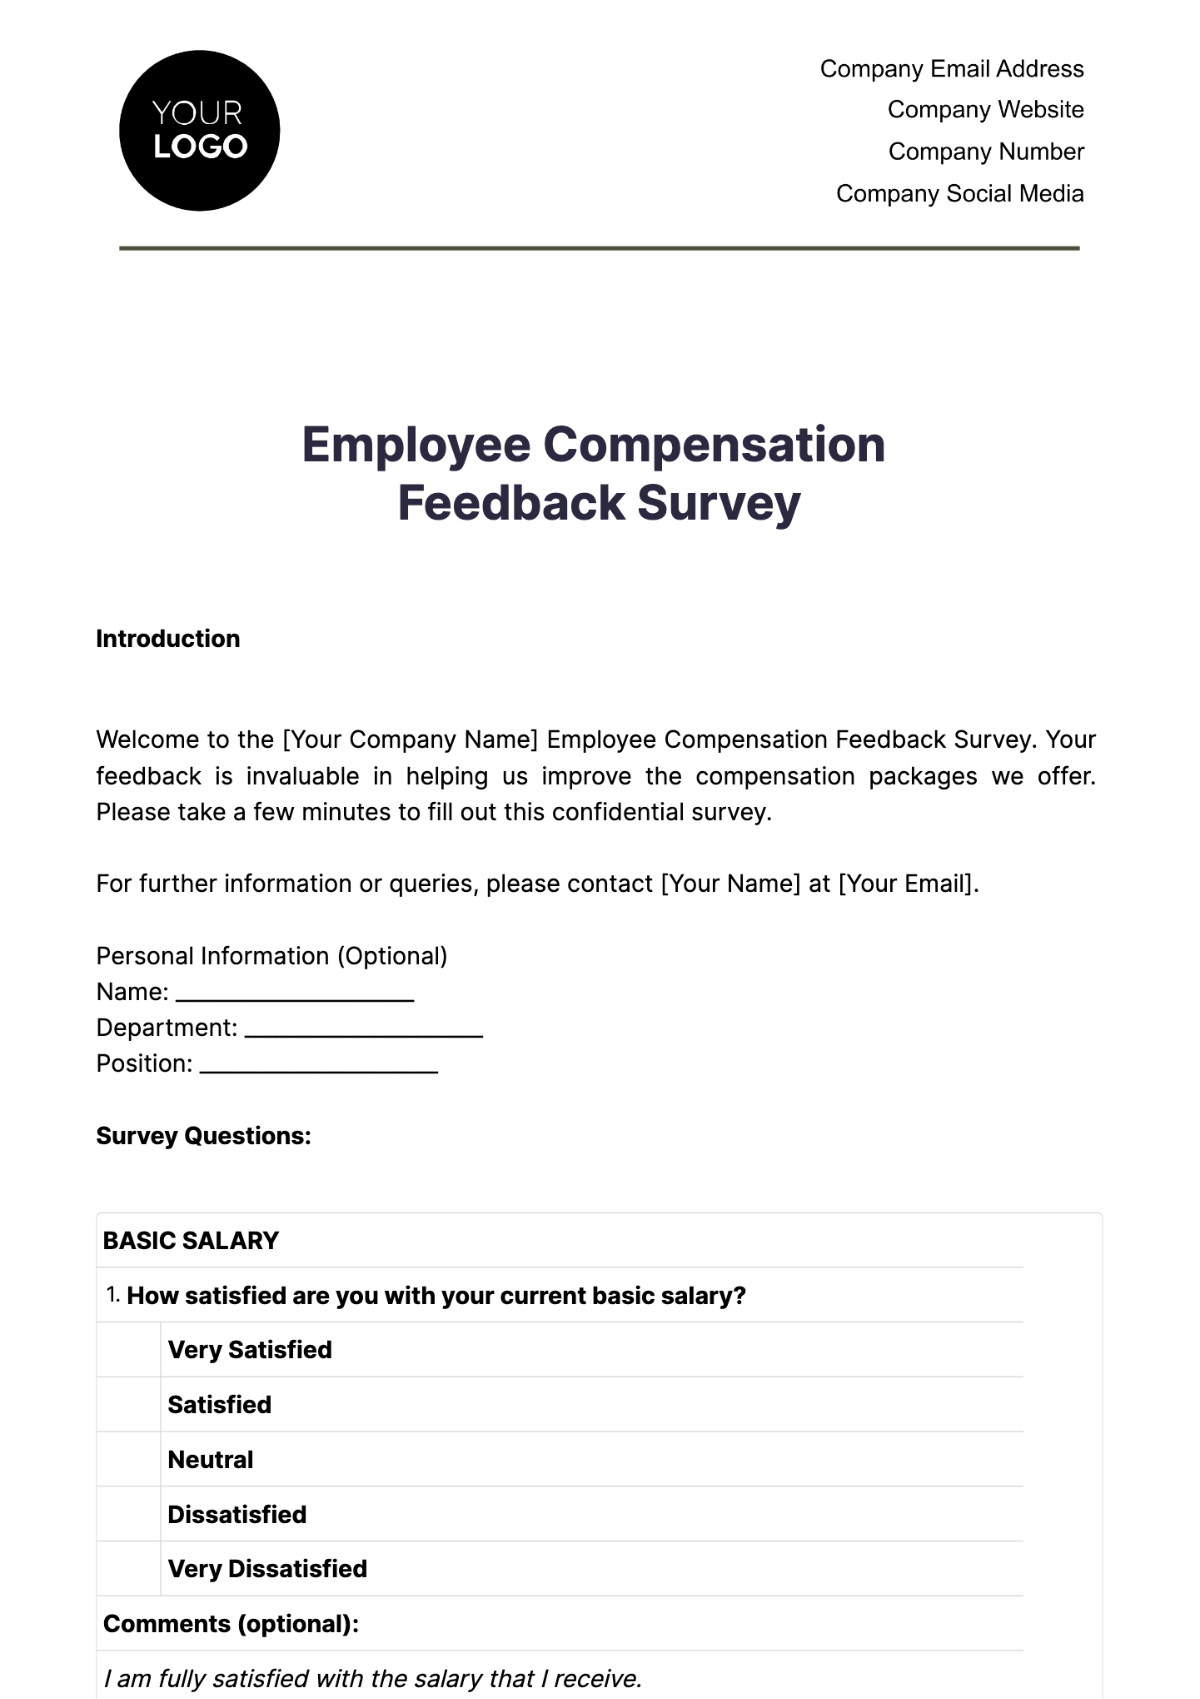
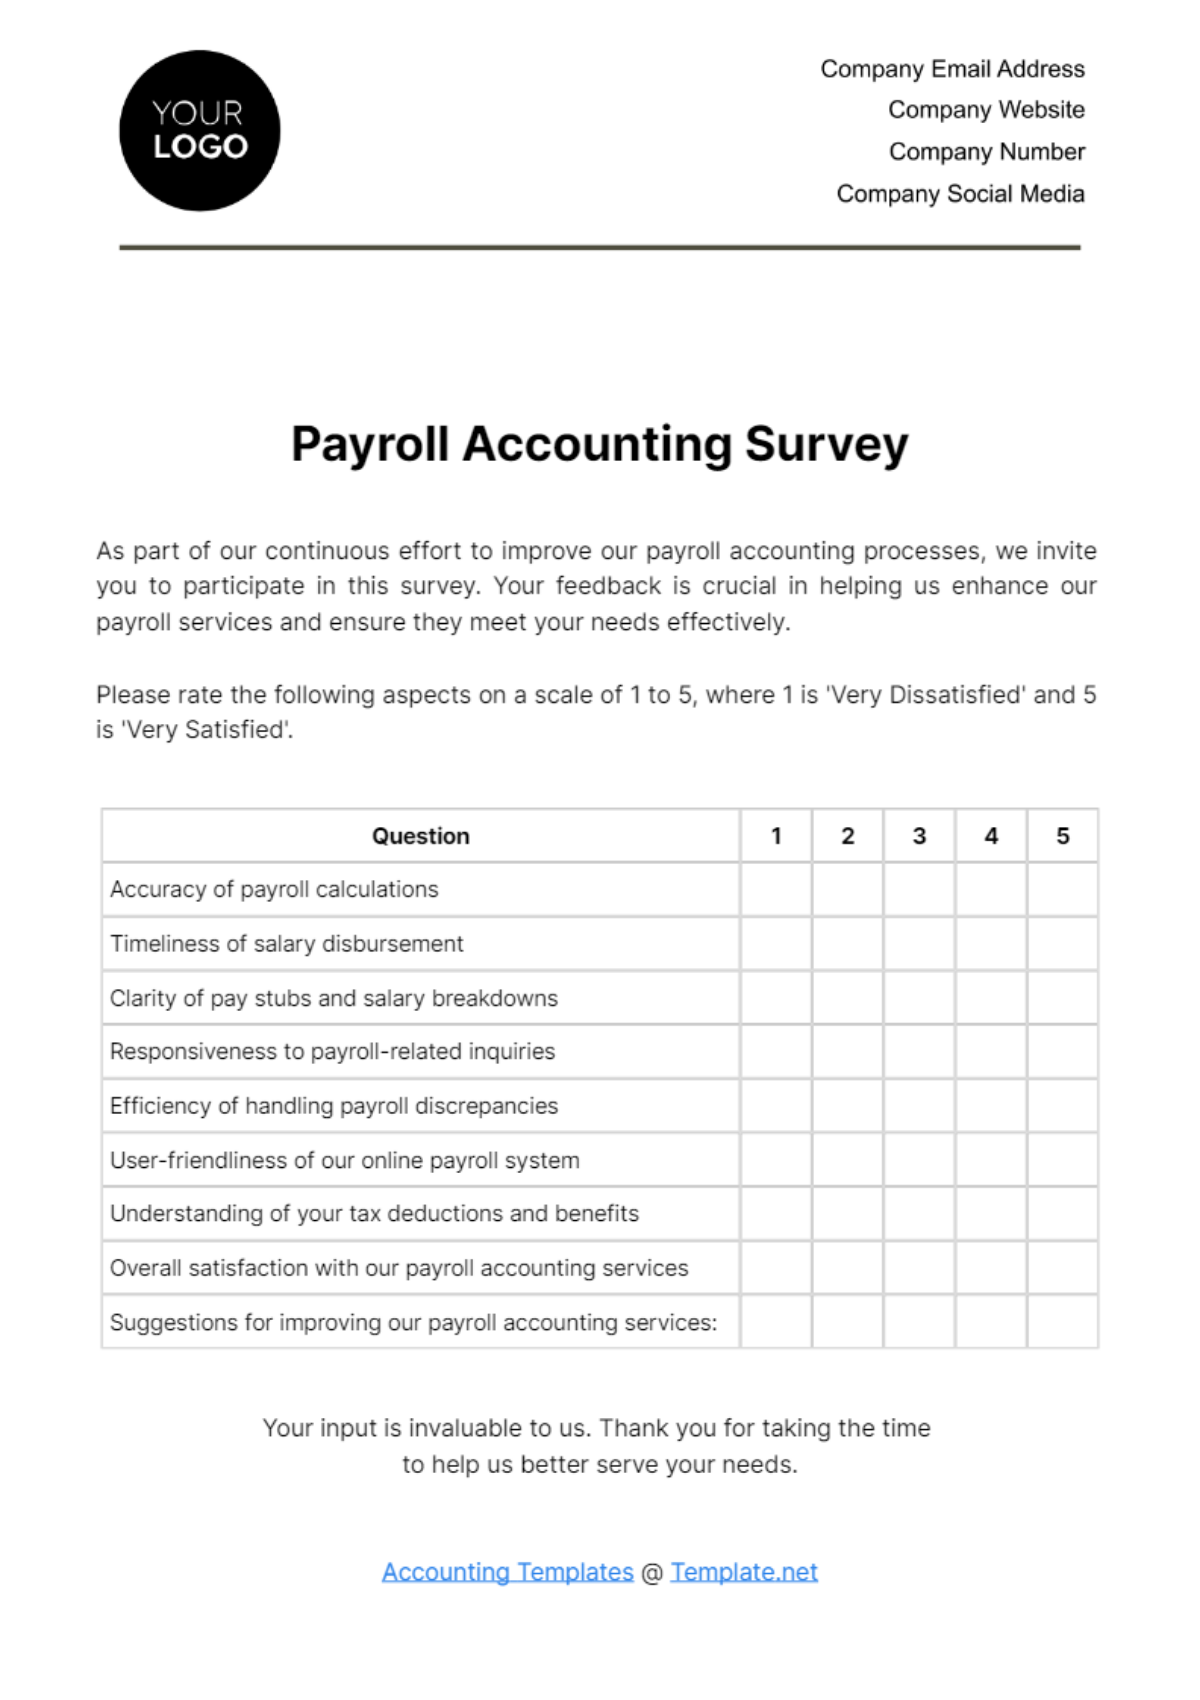
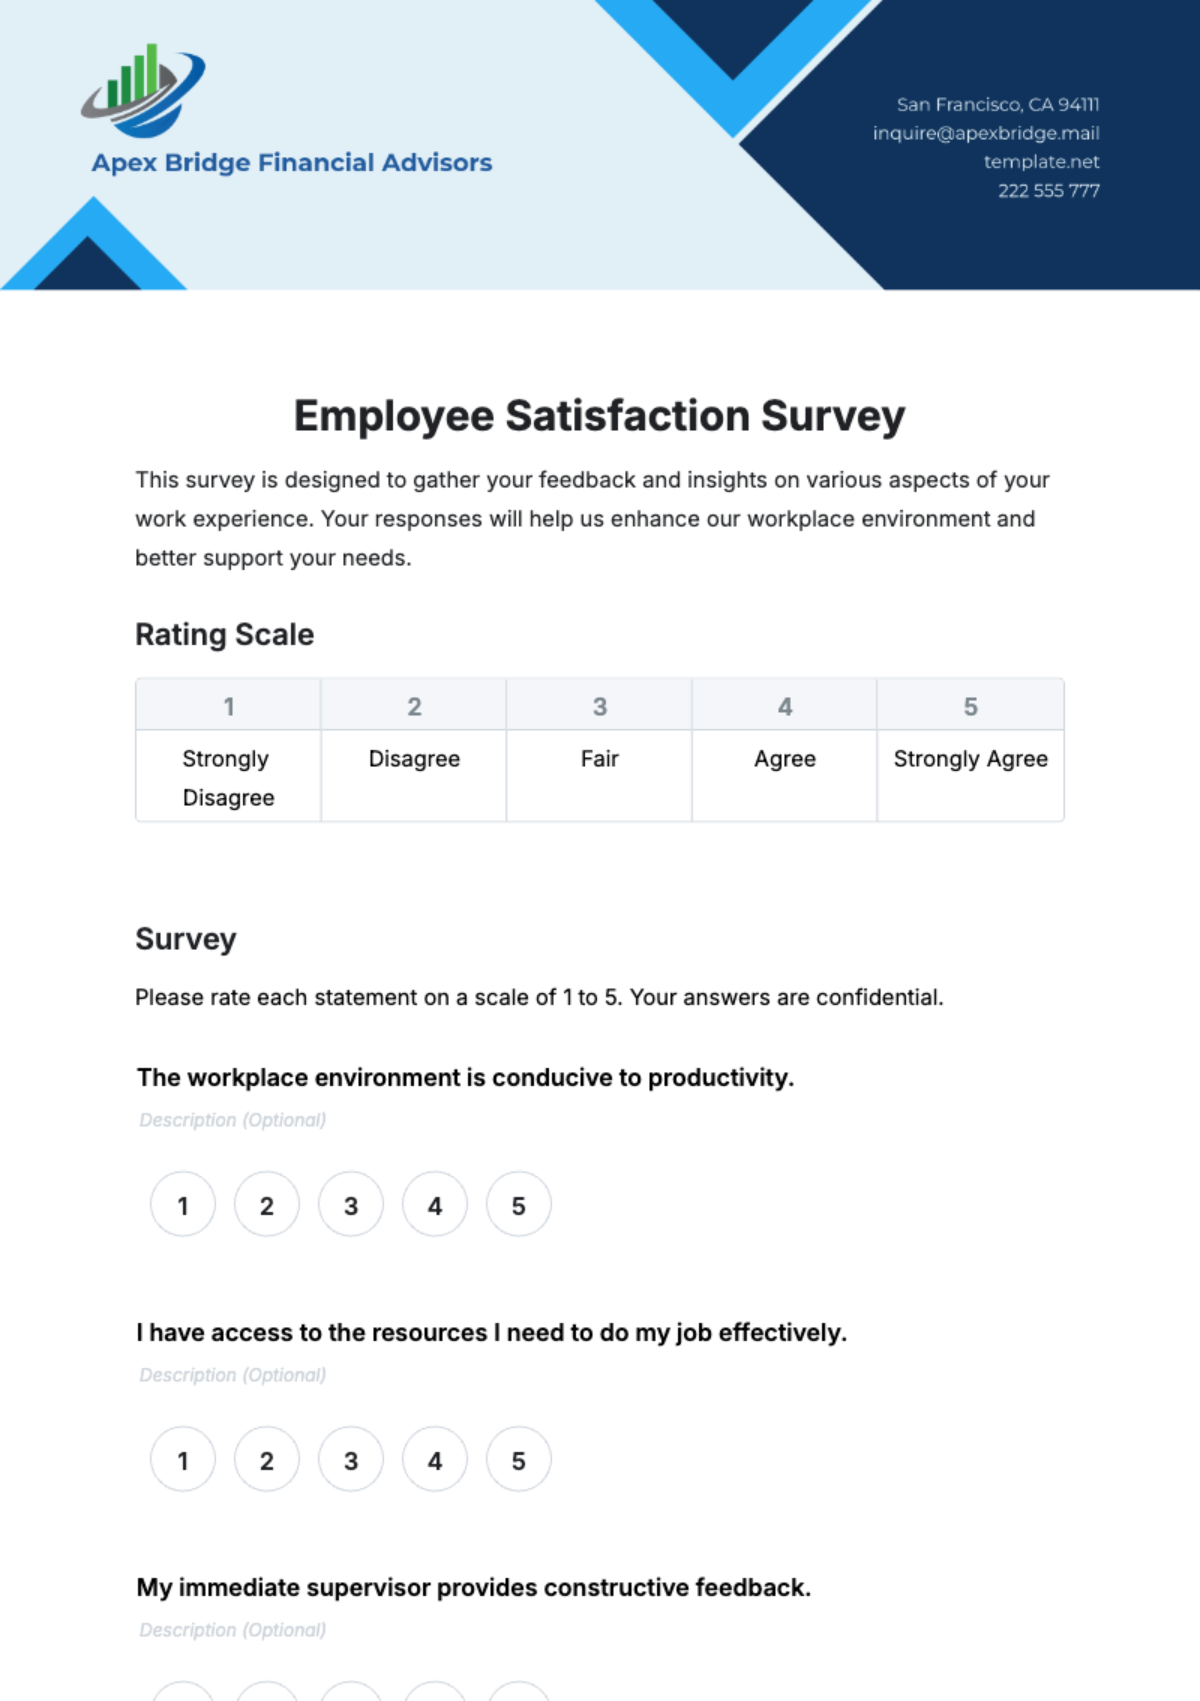
The survey was meticulously designed to ensure that it covers a broad spectrum of diversity and inclusion topics. It consisted of 20 questions, including multiple-choice, Likert scale, and open-ended questions to capture both quantitative and qualitative data. The questions were framed to be non-intrusive yet insightful, allowing us to gauge the true sentiments of our employees.
Data Collection
The survey was disseminated to all employees via an internal email system. It was kept open for a period of two weeks to ensure maximum participation. We received a total of 300 responses, which represents a 75% response rate—a satisfactory level of engagement that adds credibility to the findings.
Data Analysis
The data collected was subjected to rigorous analysis using advanced statistical tools. Quantitative data were analyzed to identify trends, correlations, and patterns, while qualitative data were coded and categorized for thematic analysis. This dual approach ensured a holistic understanding of the state of diversity and inclusion at [Your Company Name].
Key Findings
Demographics
The demographic data revealed that the workforce is predominantly male, constituting 60% of the total employees. Females make up 35%, and other gender identities represent 5%. This skewness towards male employees, especially in leadership roles, is a point of concern that needs to be addressed.
Inclusion Metrics
The average inclusion score across all employees was 3.5 out of 5. While this score indicates a moderate level of perceived inclusivity, it also points to room for improvement. Employees generally feel that they are part of the team, but several comments suggest that microaggressions and unconscious biases are prevalent.
Diversity Metrics
The survey showed a high level of ethnic diversity, with 40% of respondents identifying as non-white. However, this diversity is not well-reflected in senior management roles, indicating a potential glass ceiling effect for minority employees.
Analysis
Gender Diversity
The gender imbalance, particularly in leadership roles, is a significant concern. Despite various initiatives to promote gender diversity, the male-to-female ratio in managerial positions is highly skewed. This imbalance could be contributing to the lower inclusion scores among female employees.
Ethnic Diversity
While the organization has a diverse ethnic composition, the lack of representation in leadership roles is concerning. Minority employees are not proportionately represented in decision-making positions, which could lead to a lack of diverse perspectives at higher levels of the organization.
LGBTQ+ Inclusion
The survey results indicate a lower level of perceived inclusion among LGBTQ+ employees, with an average score of 2.9 out of 5. This suggests that more targeted efforts are needed to create an inclusive environment for LGBTQ+ individuals.
Recommendations
Based on the findings, we recommend the following actions:
Implement gender diversity training programs aimed at reducing unconscious bias.
Establish mentorship programs specifically designed for minority and underrepresented employees to prepare them for leadership roles.
Conduct follow-up surveys semi-annually to measure the effectiveness of the implemented diversity and inclusion initiatives.
Conclusion
The Employee Diversity and Inclusion Survey has provided valuable insights into the current state of diversity and inclusion at [Your Company Name]. While there are areas where the company is performing well, such as ethnic diversity, there are also critical gaps that need to be addressed immediately, such as gender diversity and LGBTQ+ inclusion. Immediate and sustained action is recommended to improve these areas and make [Your Company Name] a truly diverse and inclusive workplace.
Appendices
Survey Questionnaire
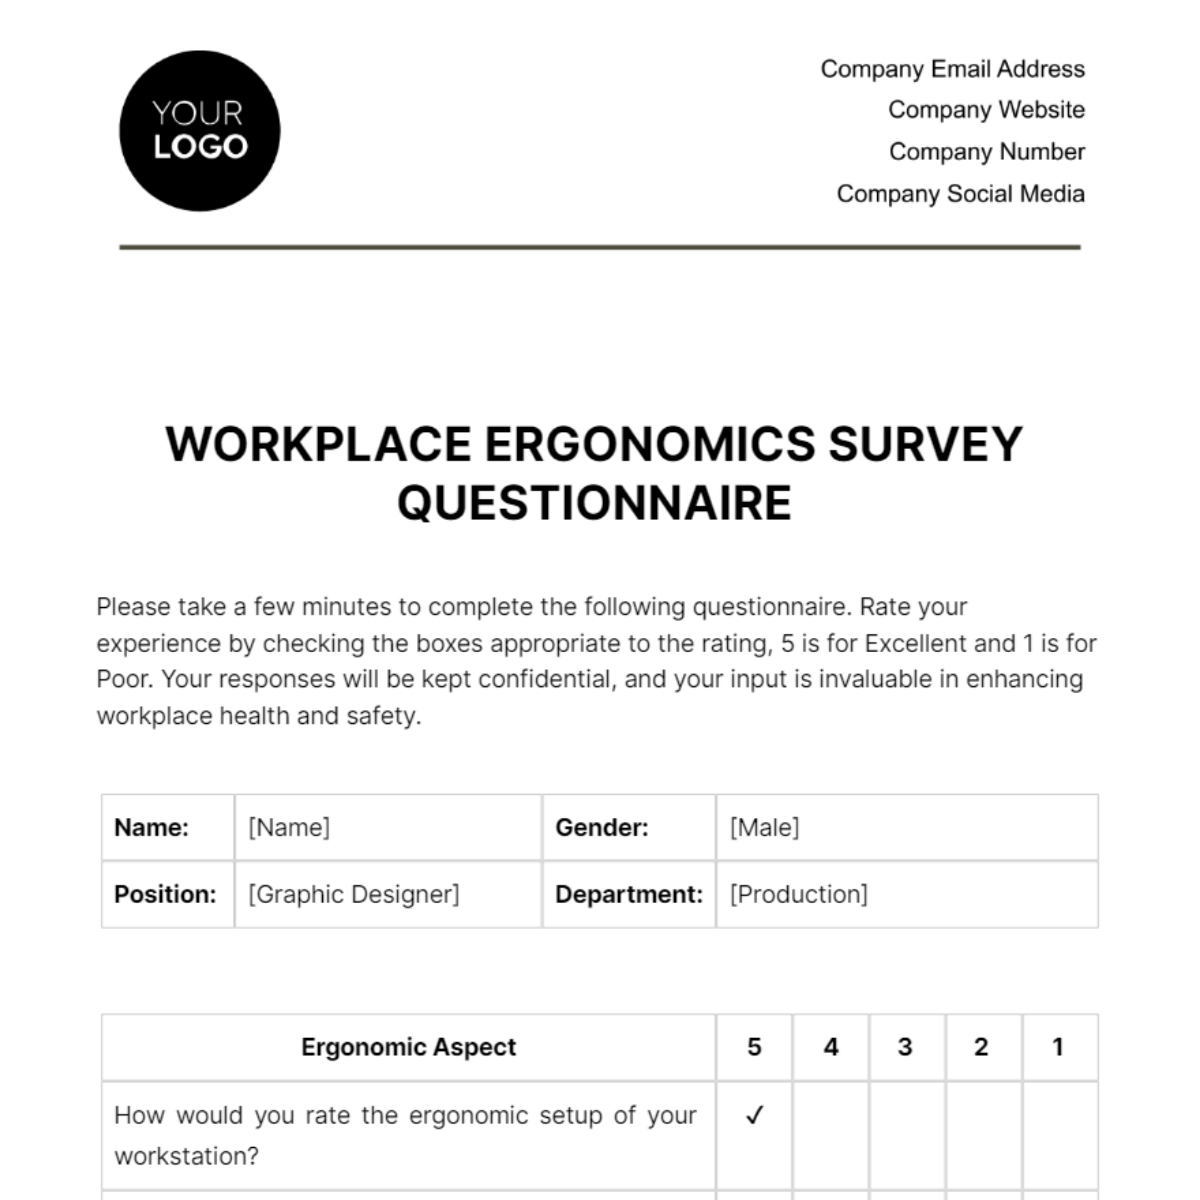
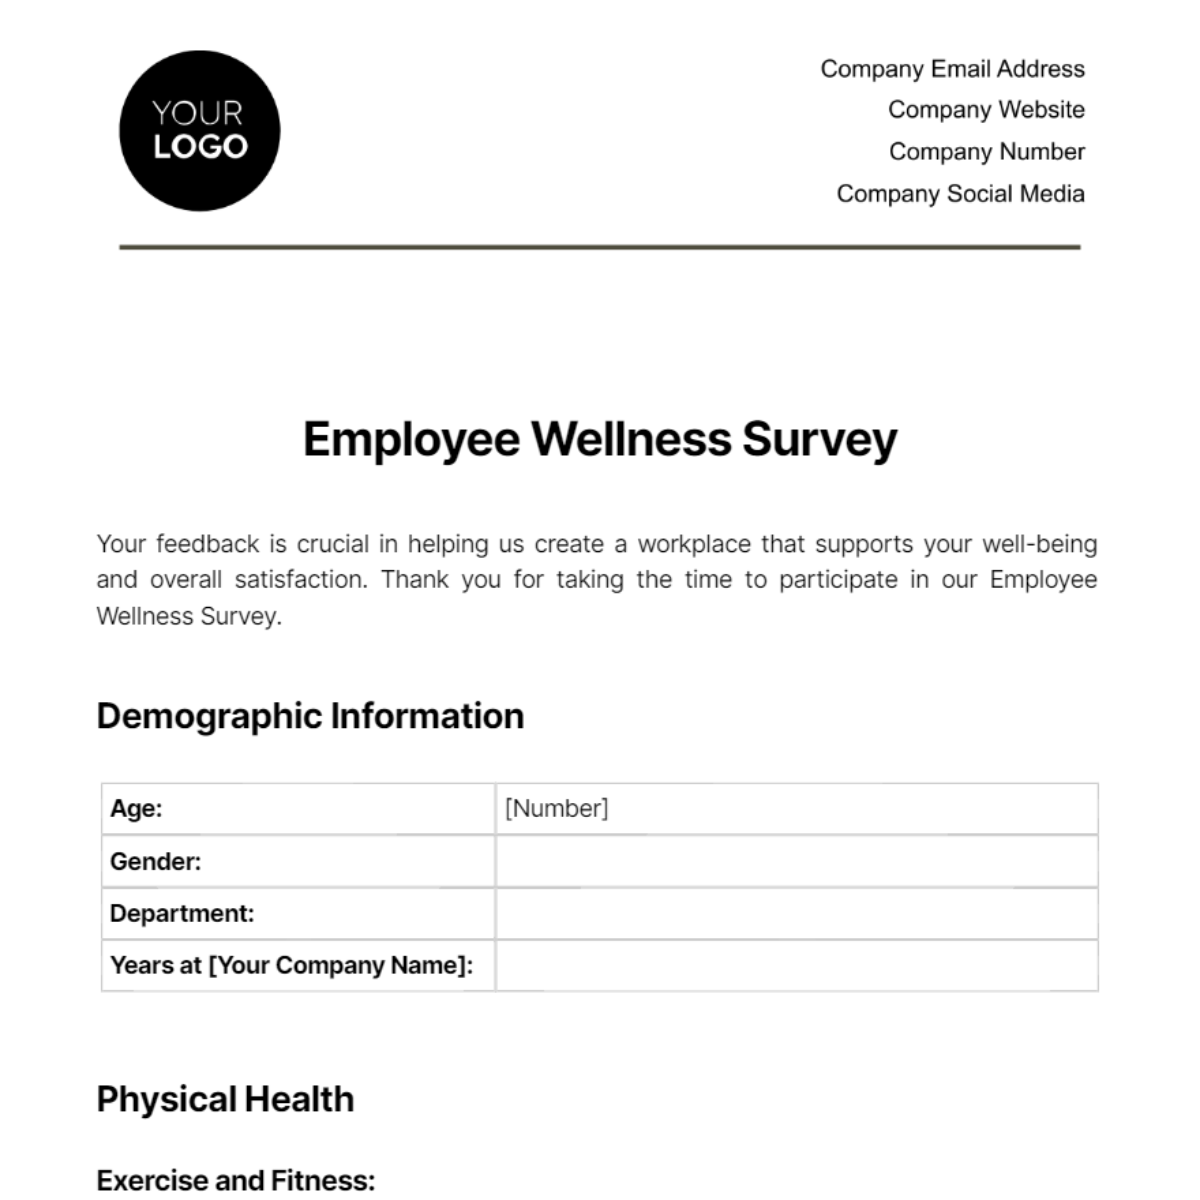
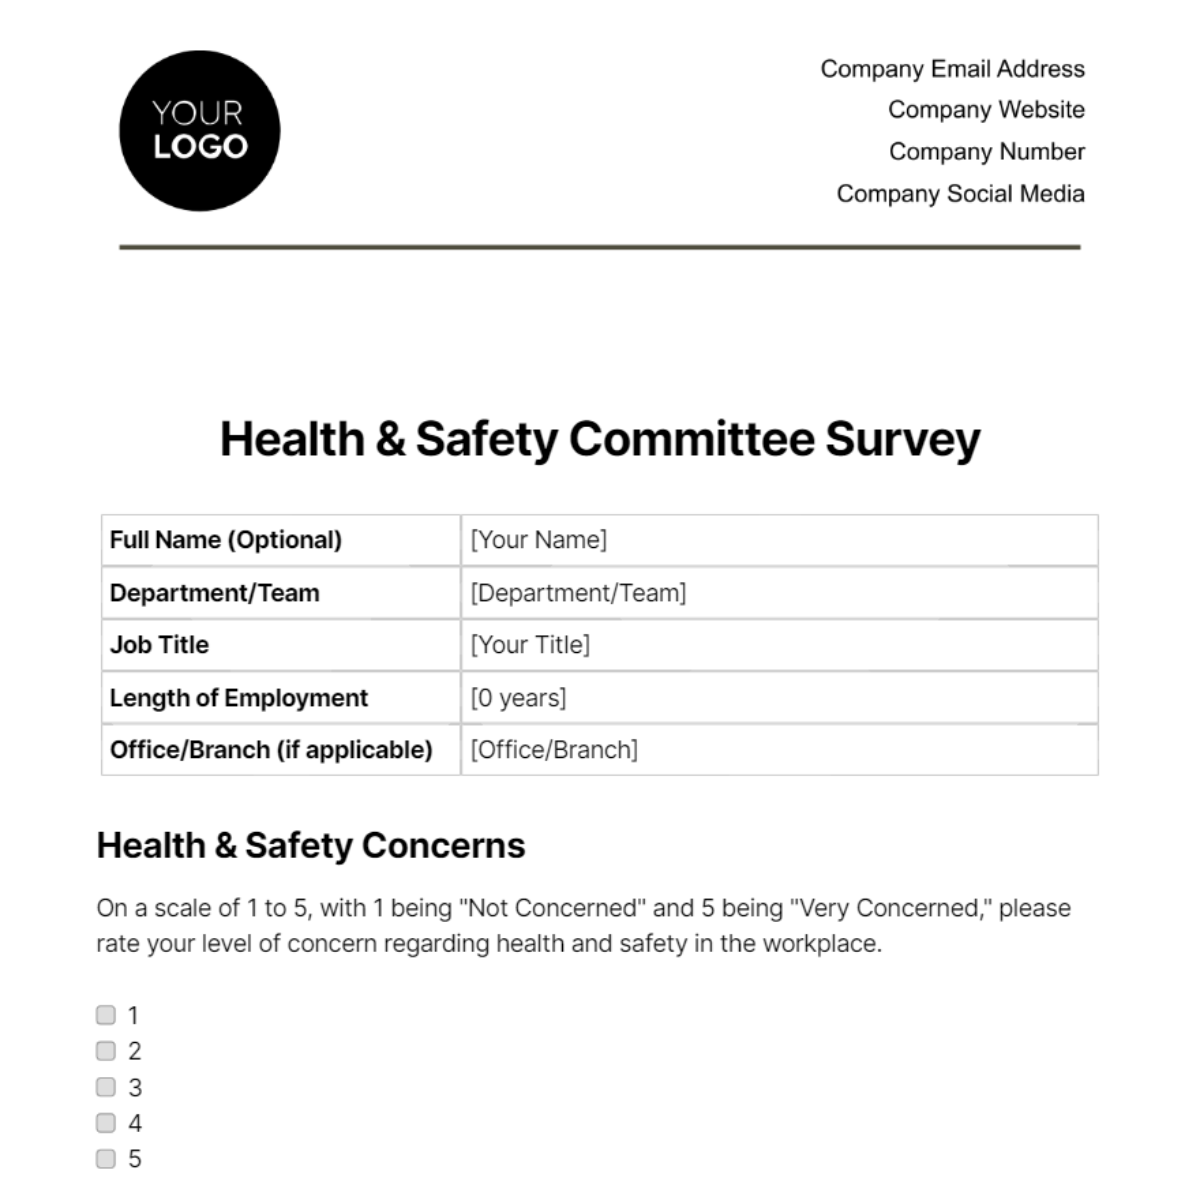
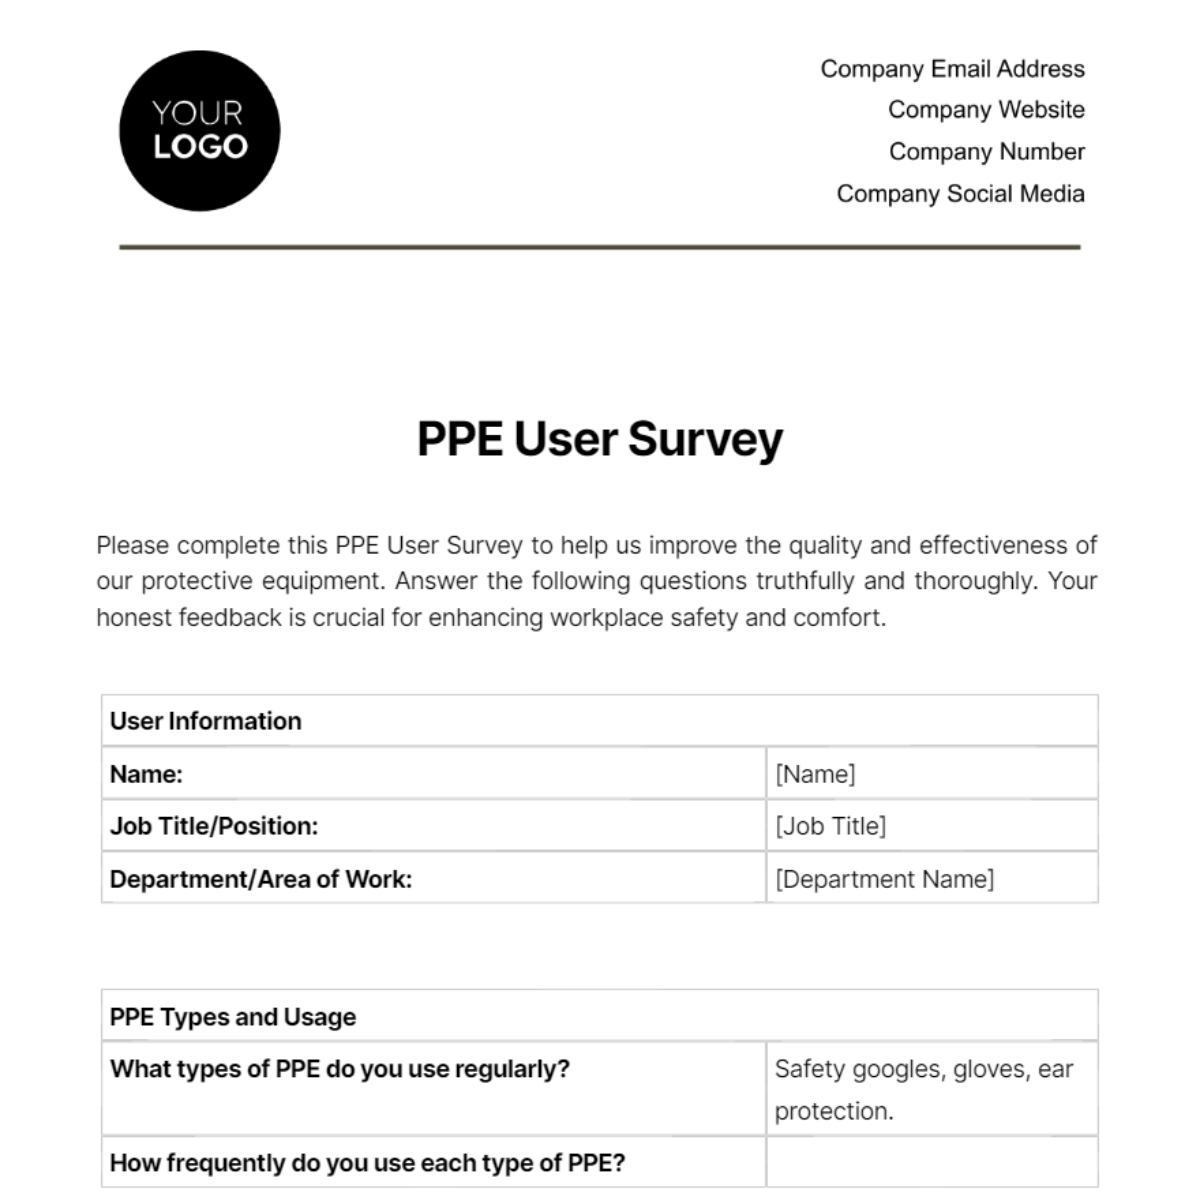
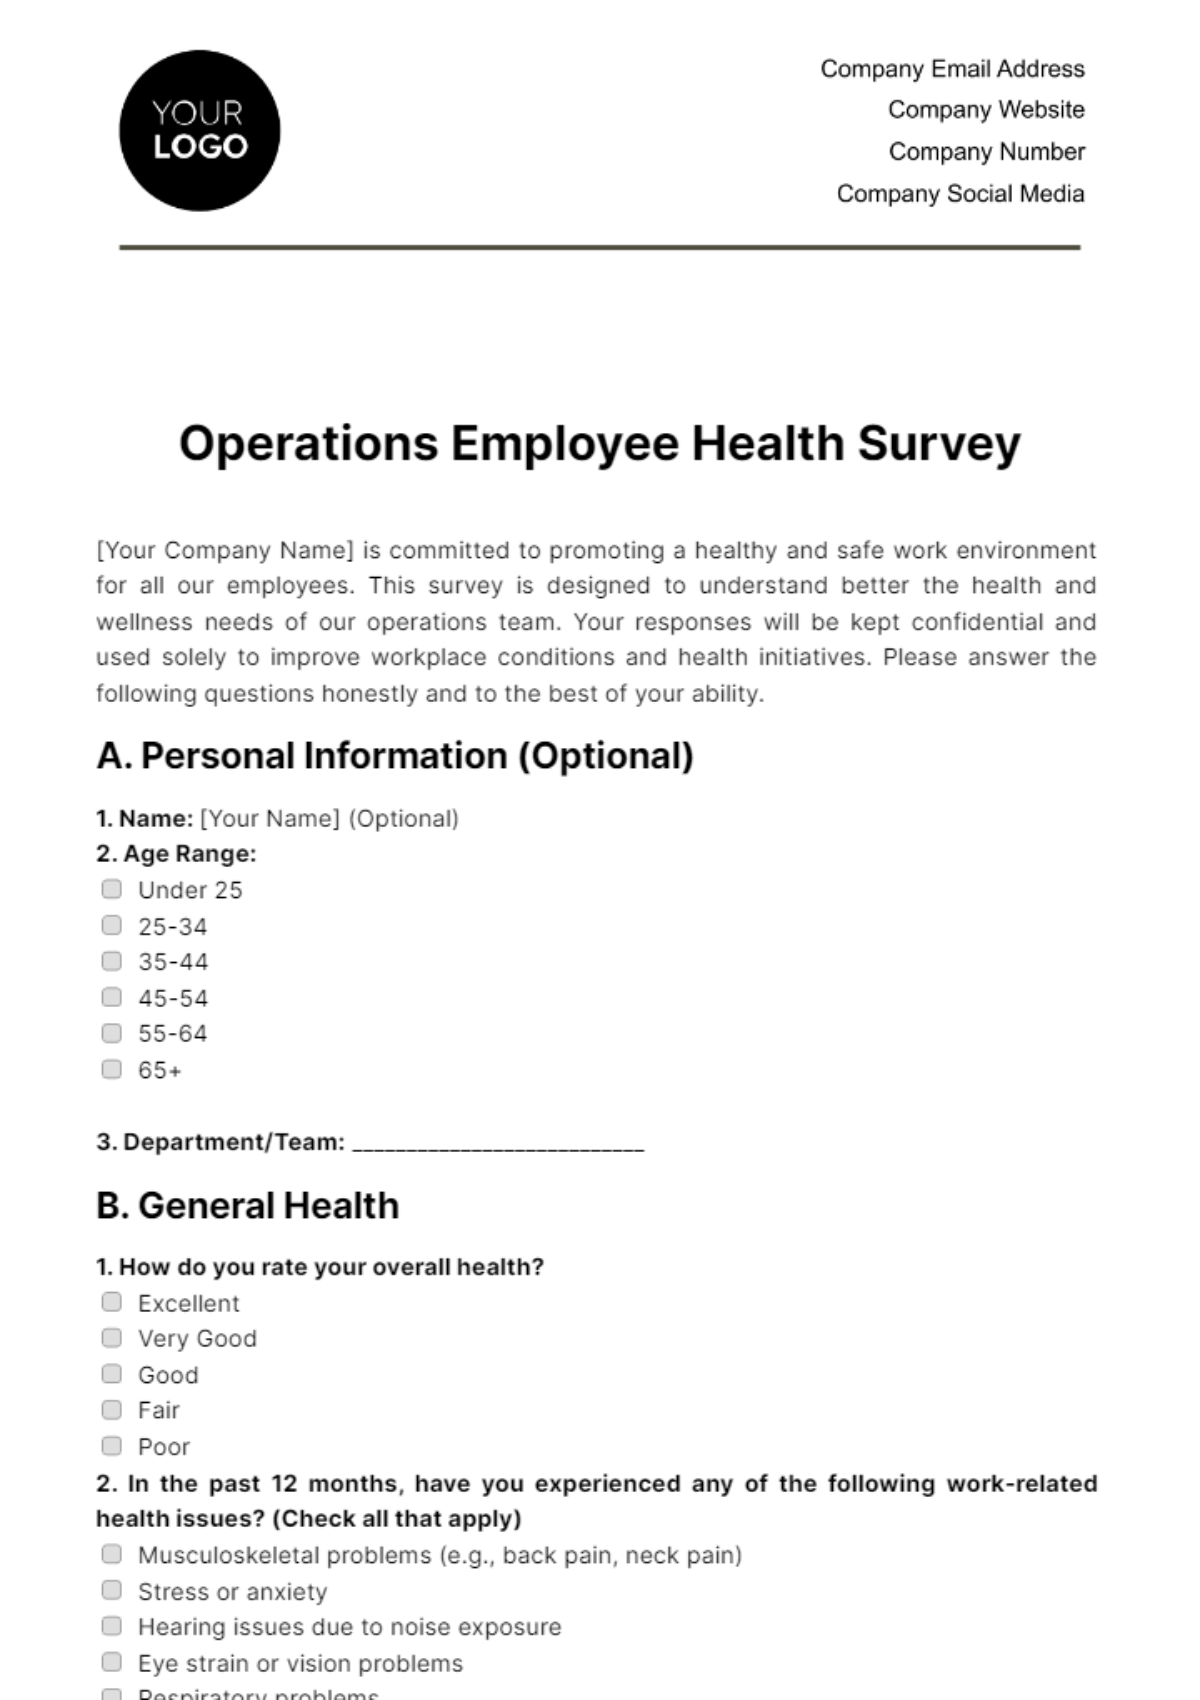
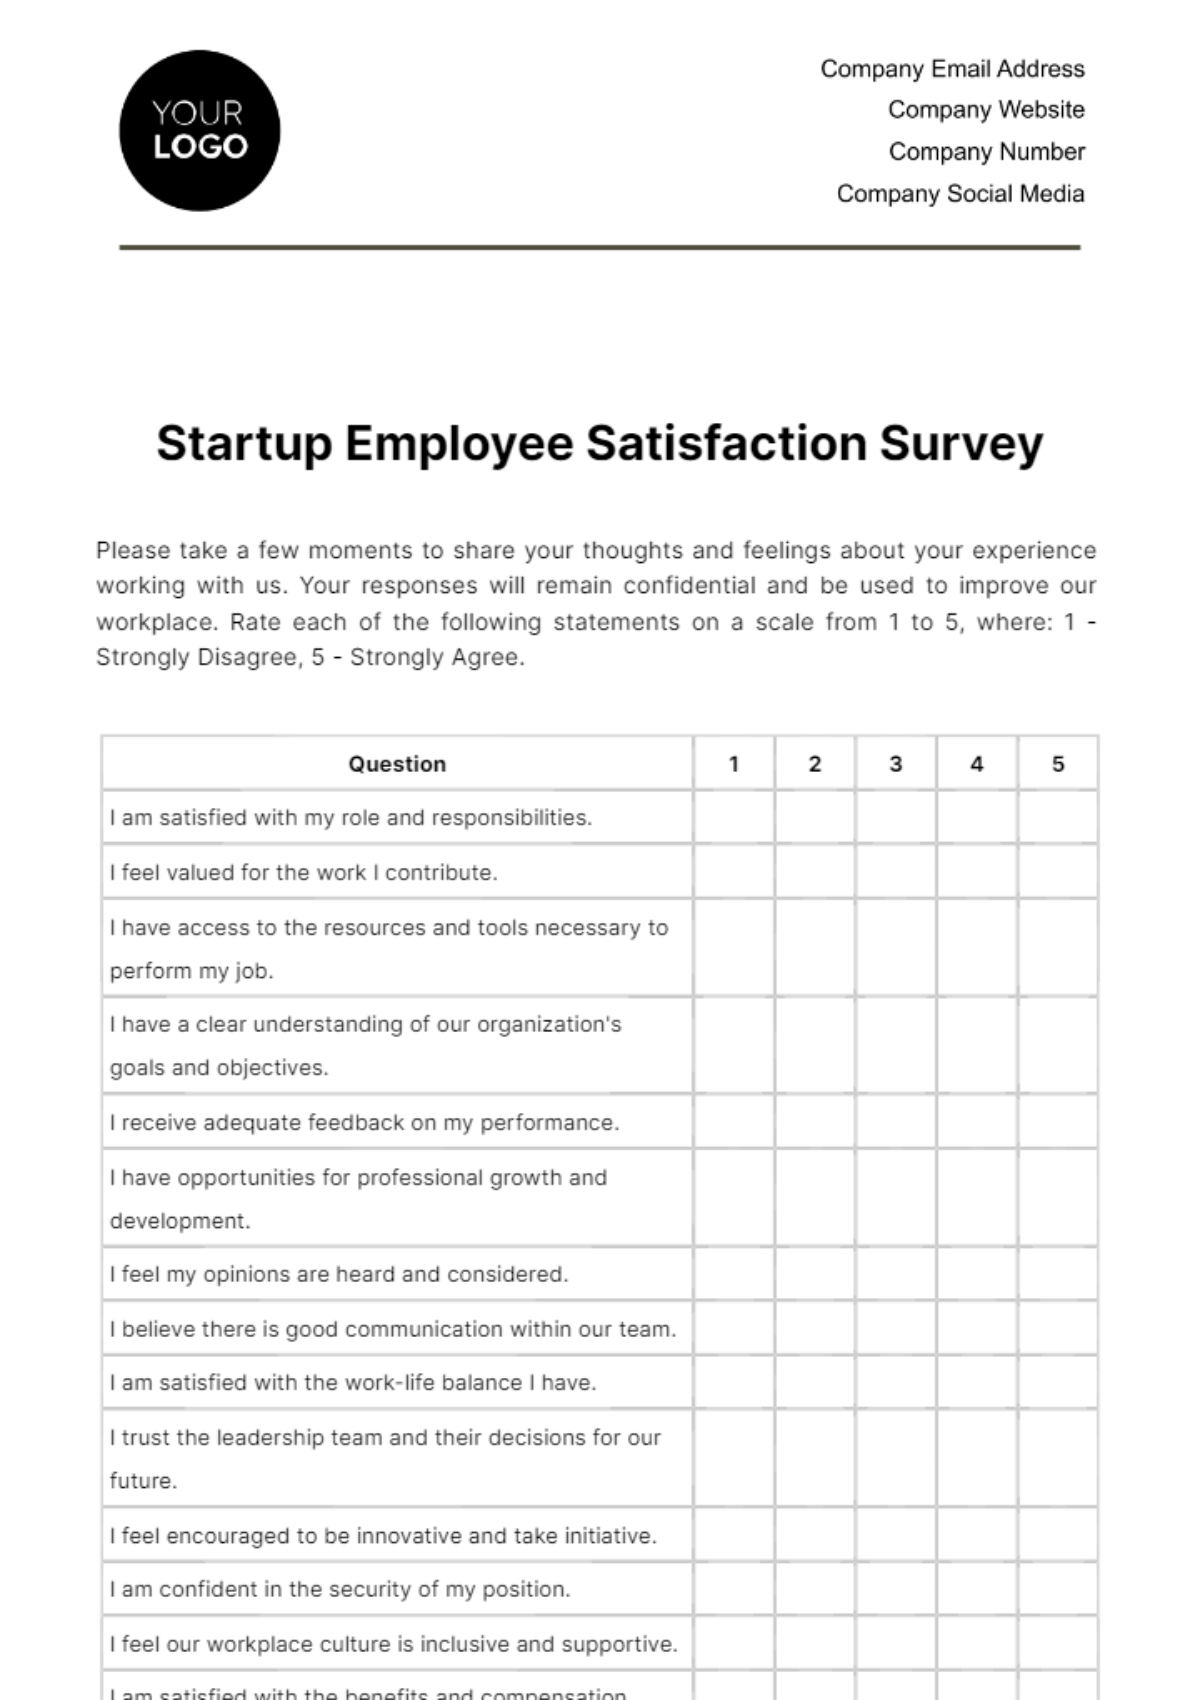
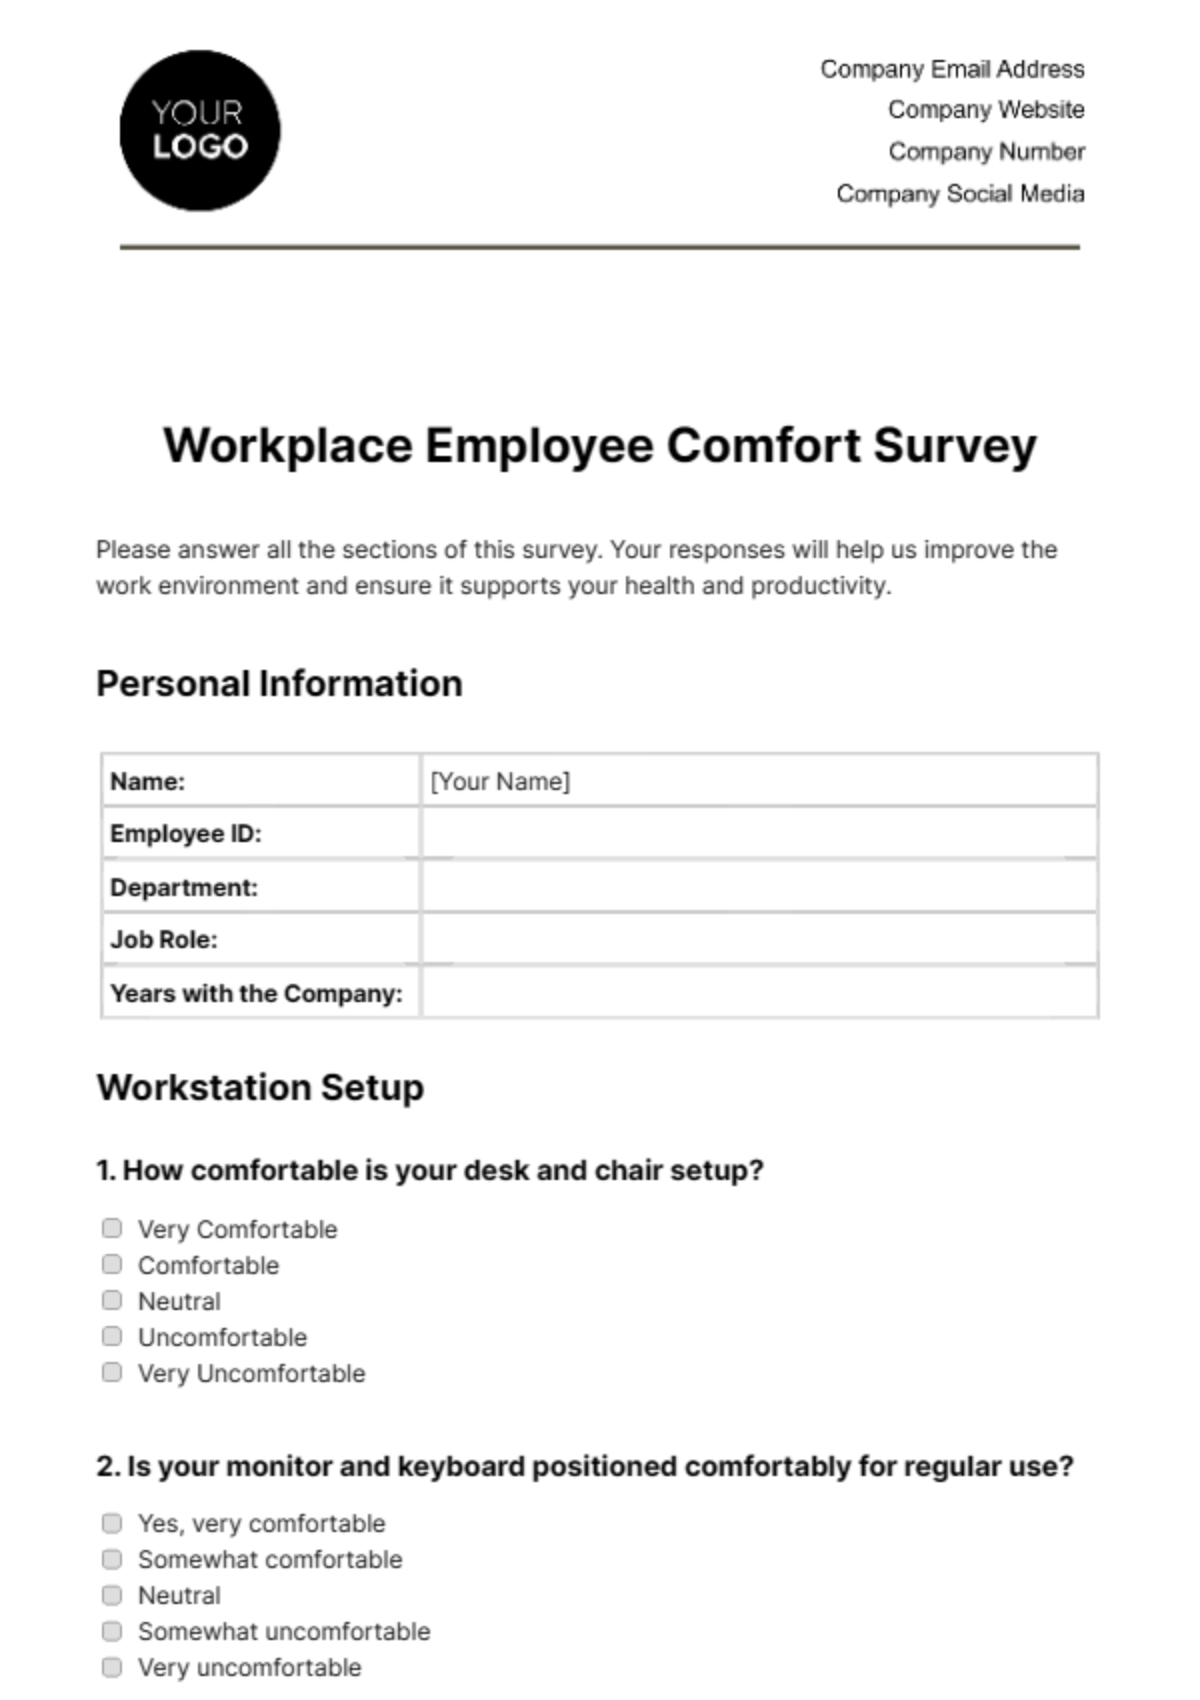
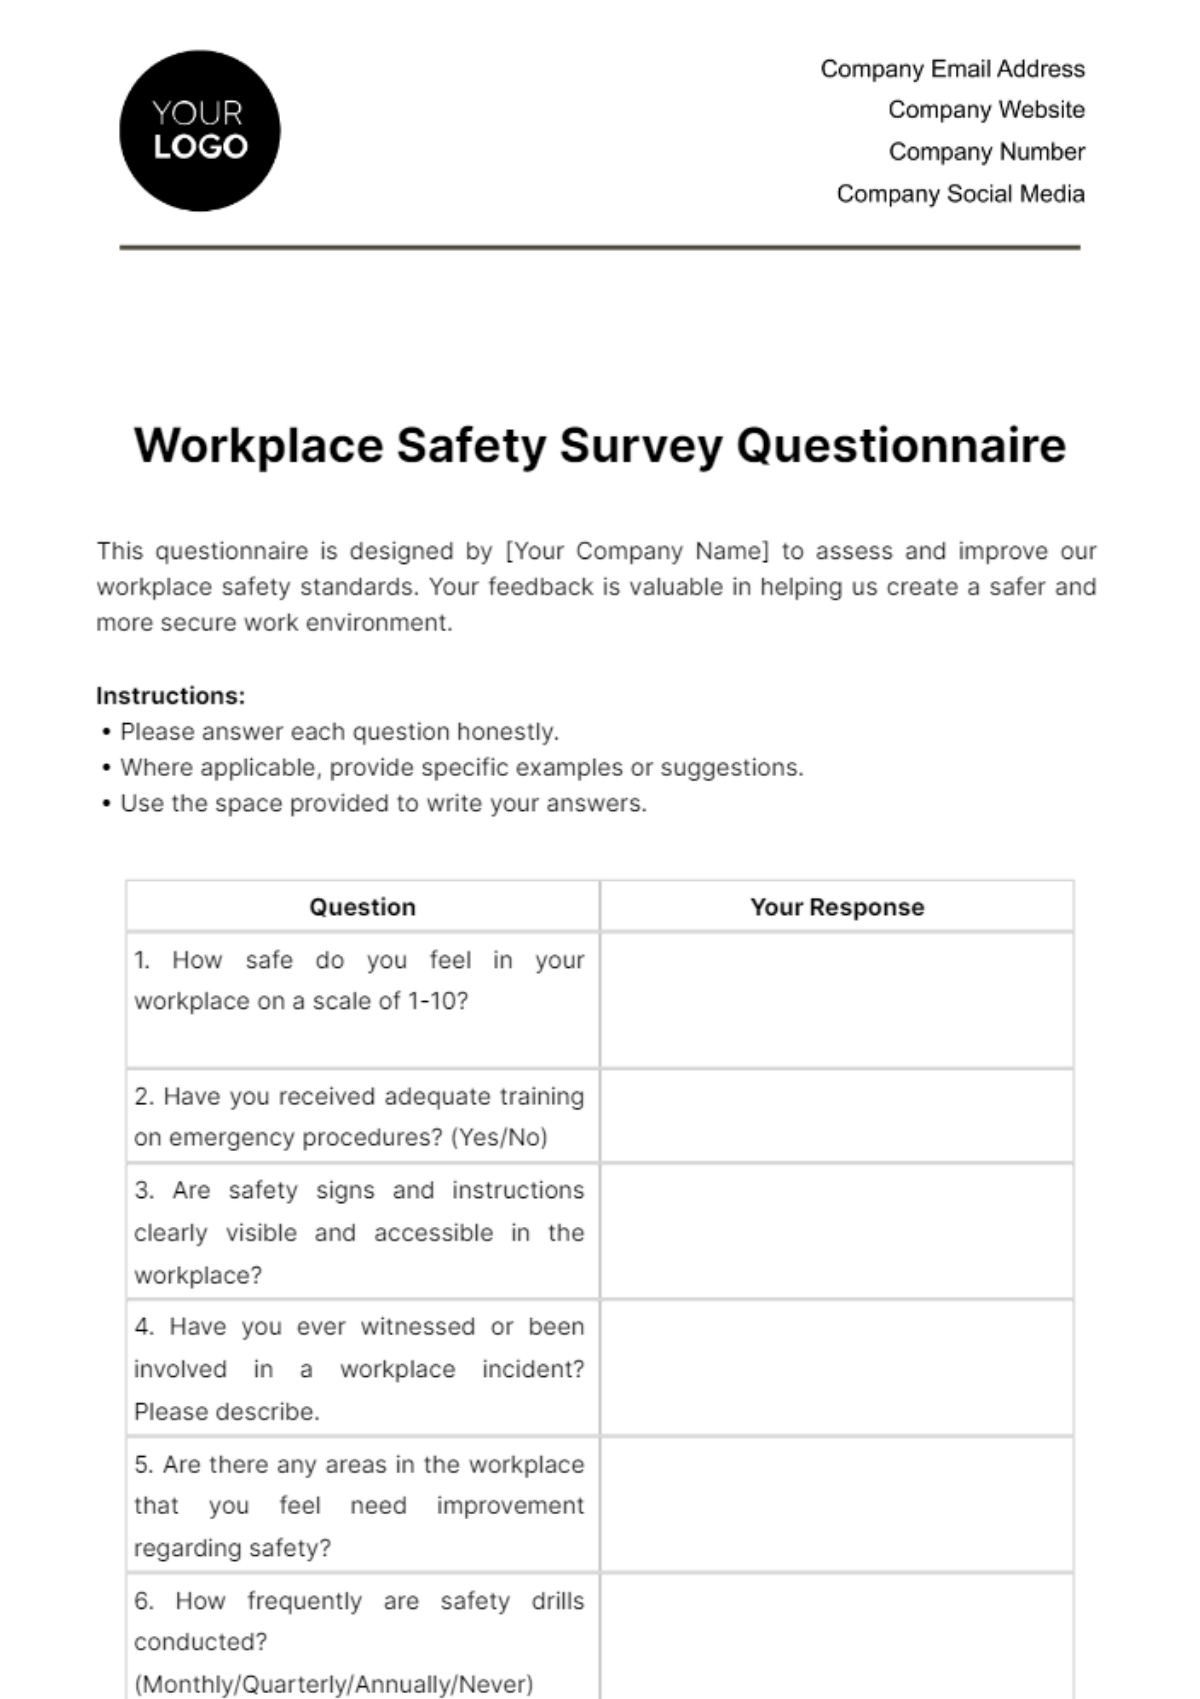
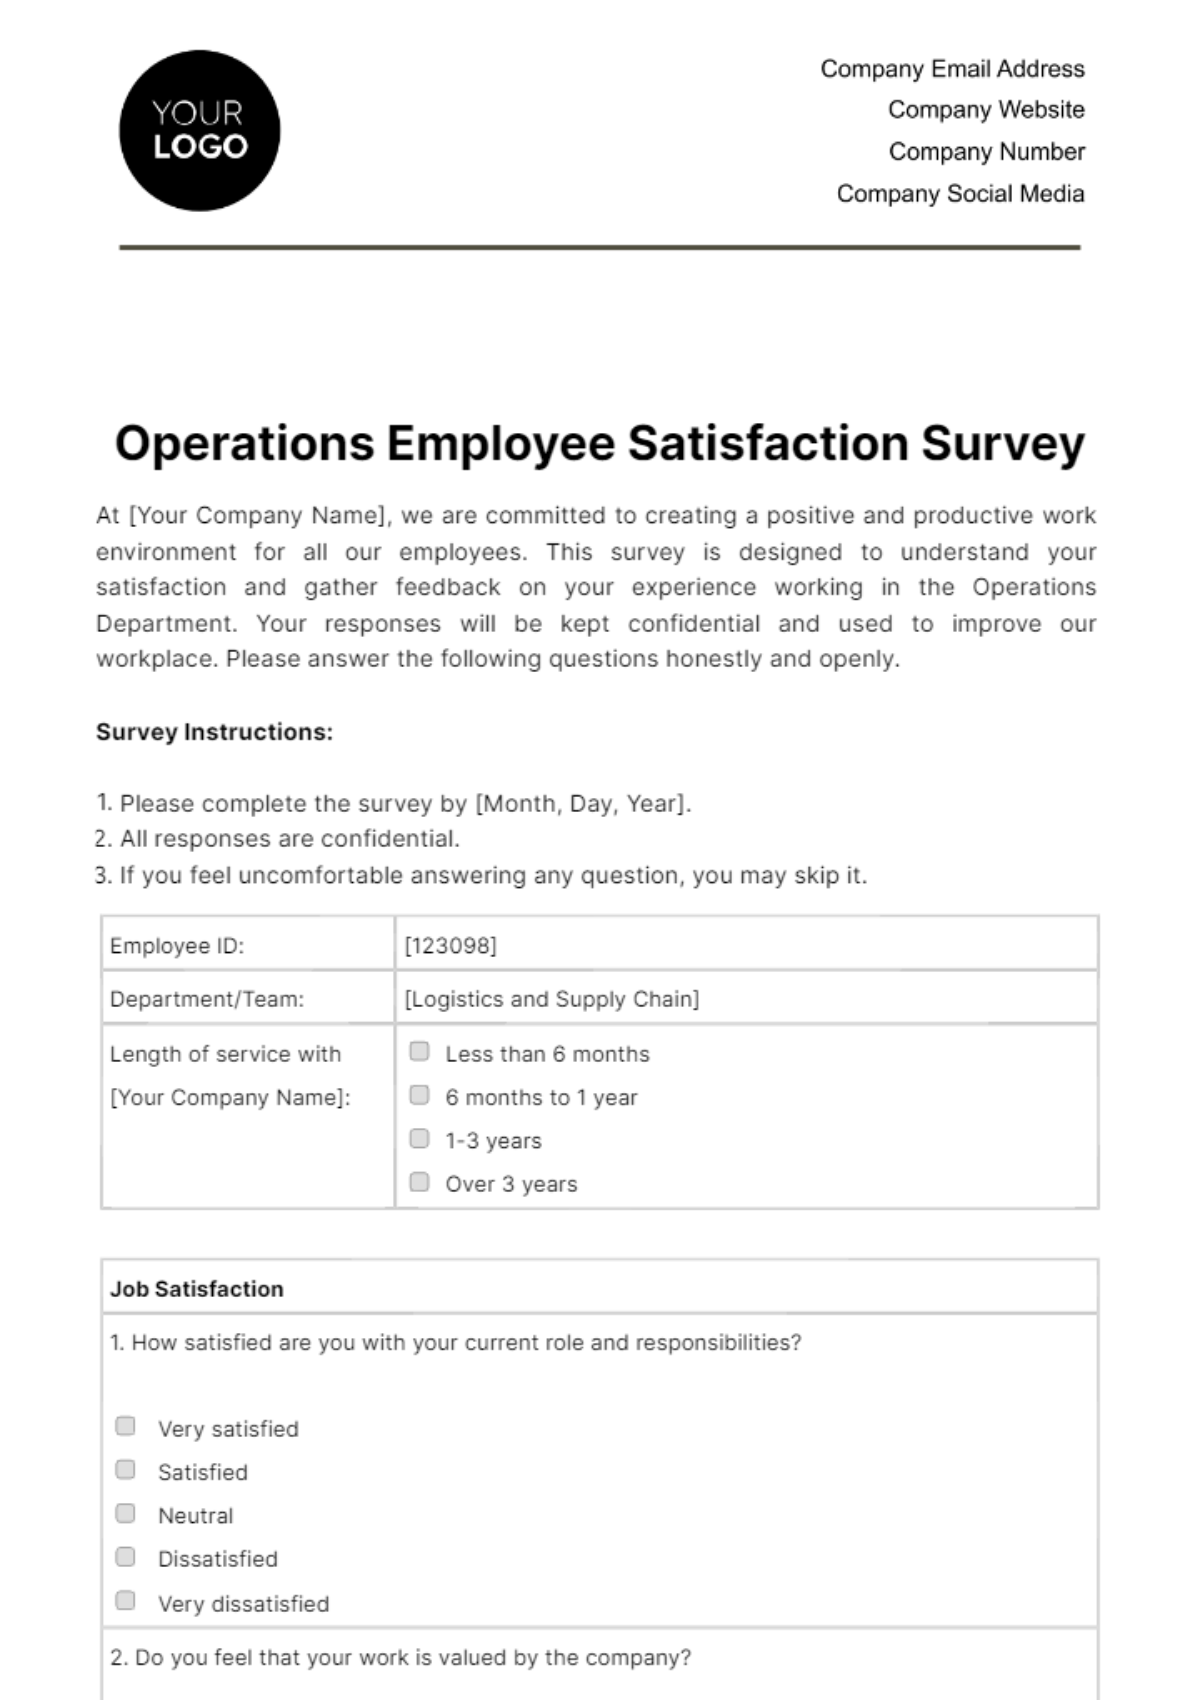
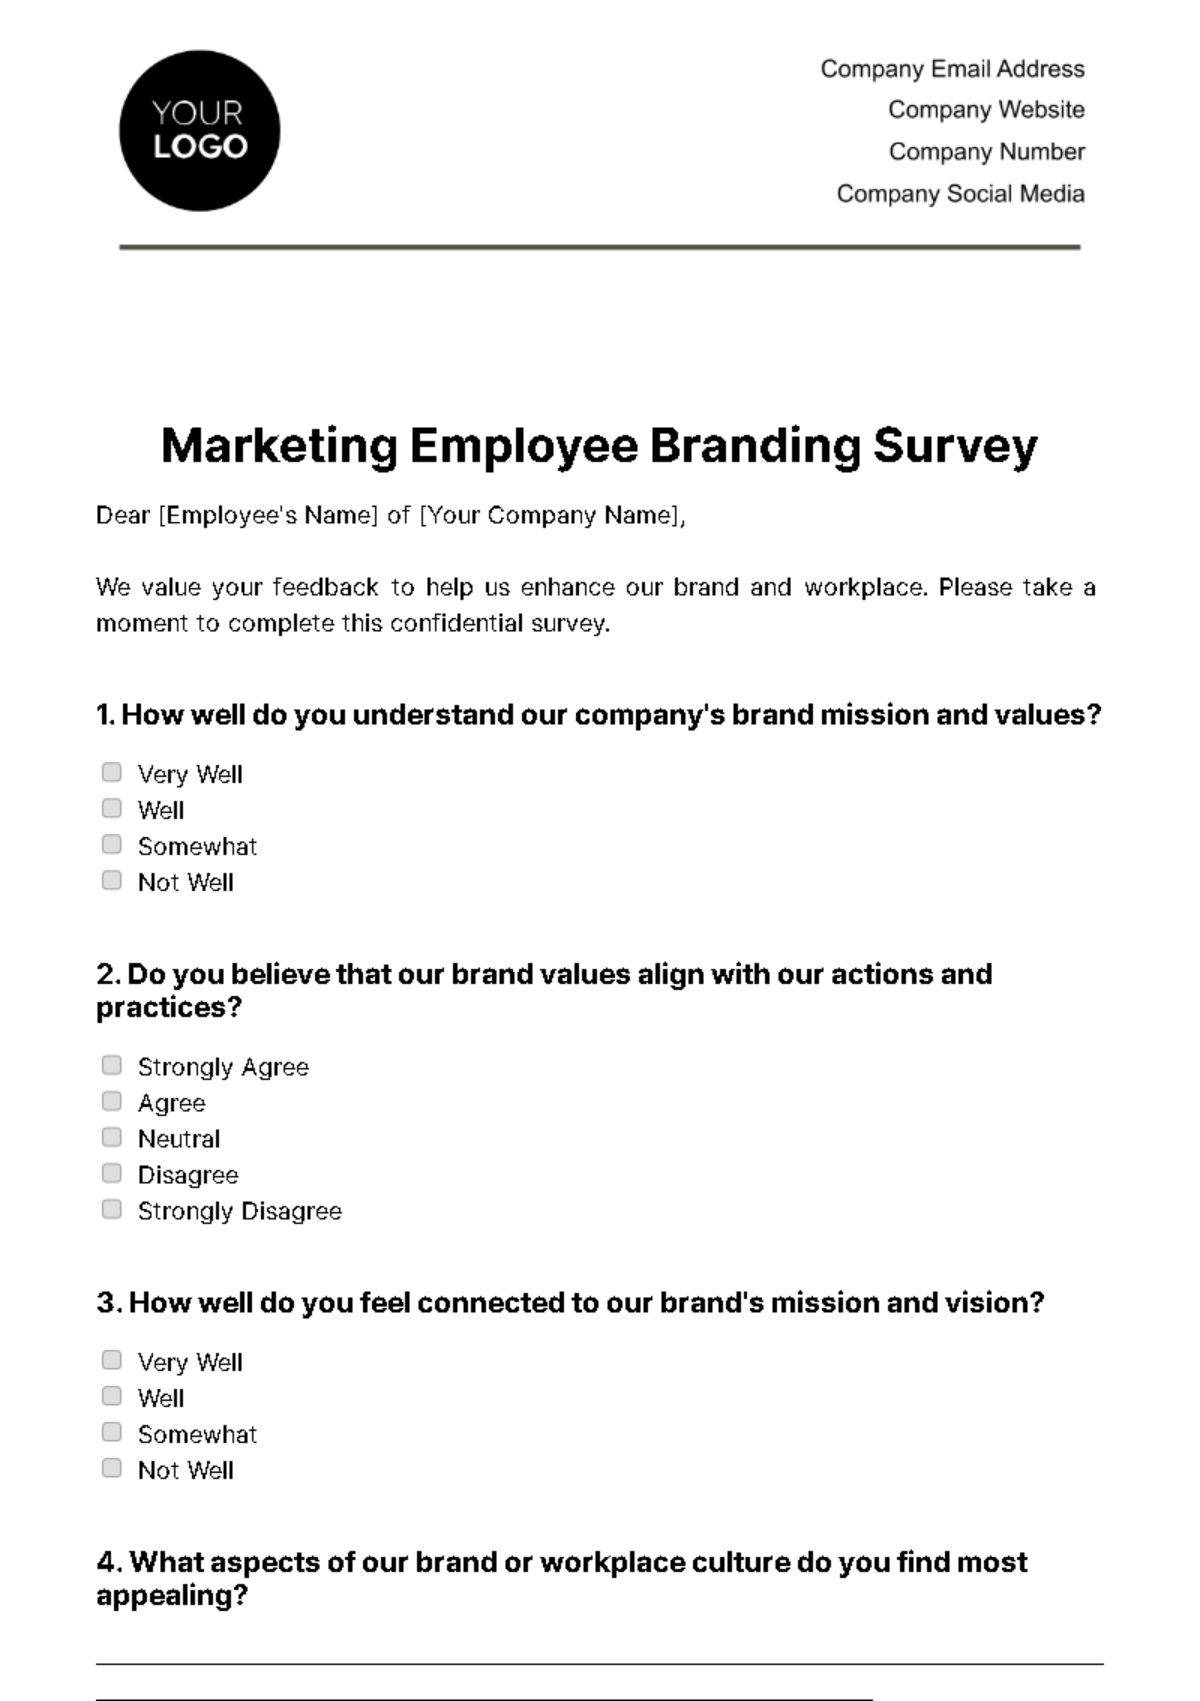
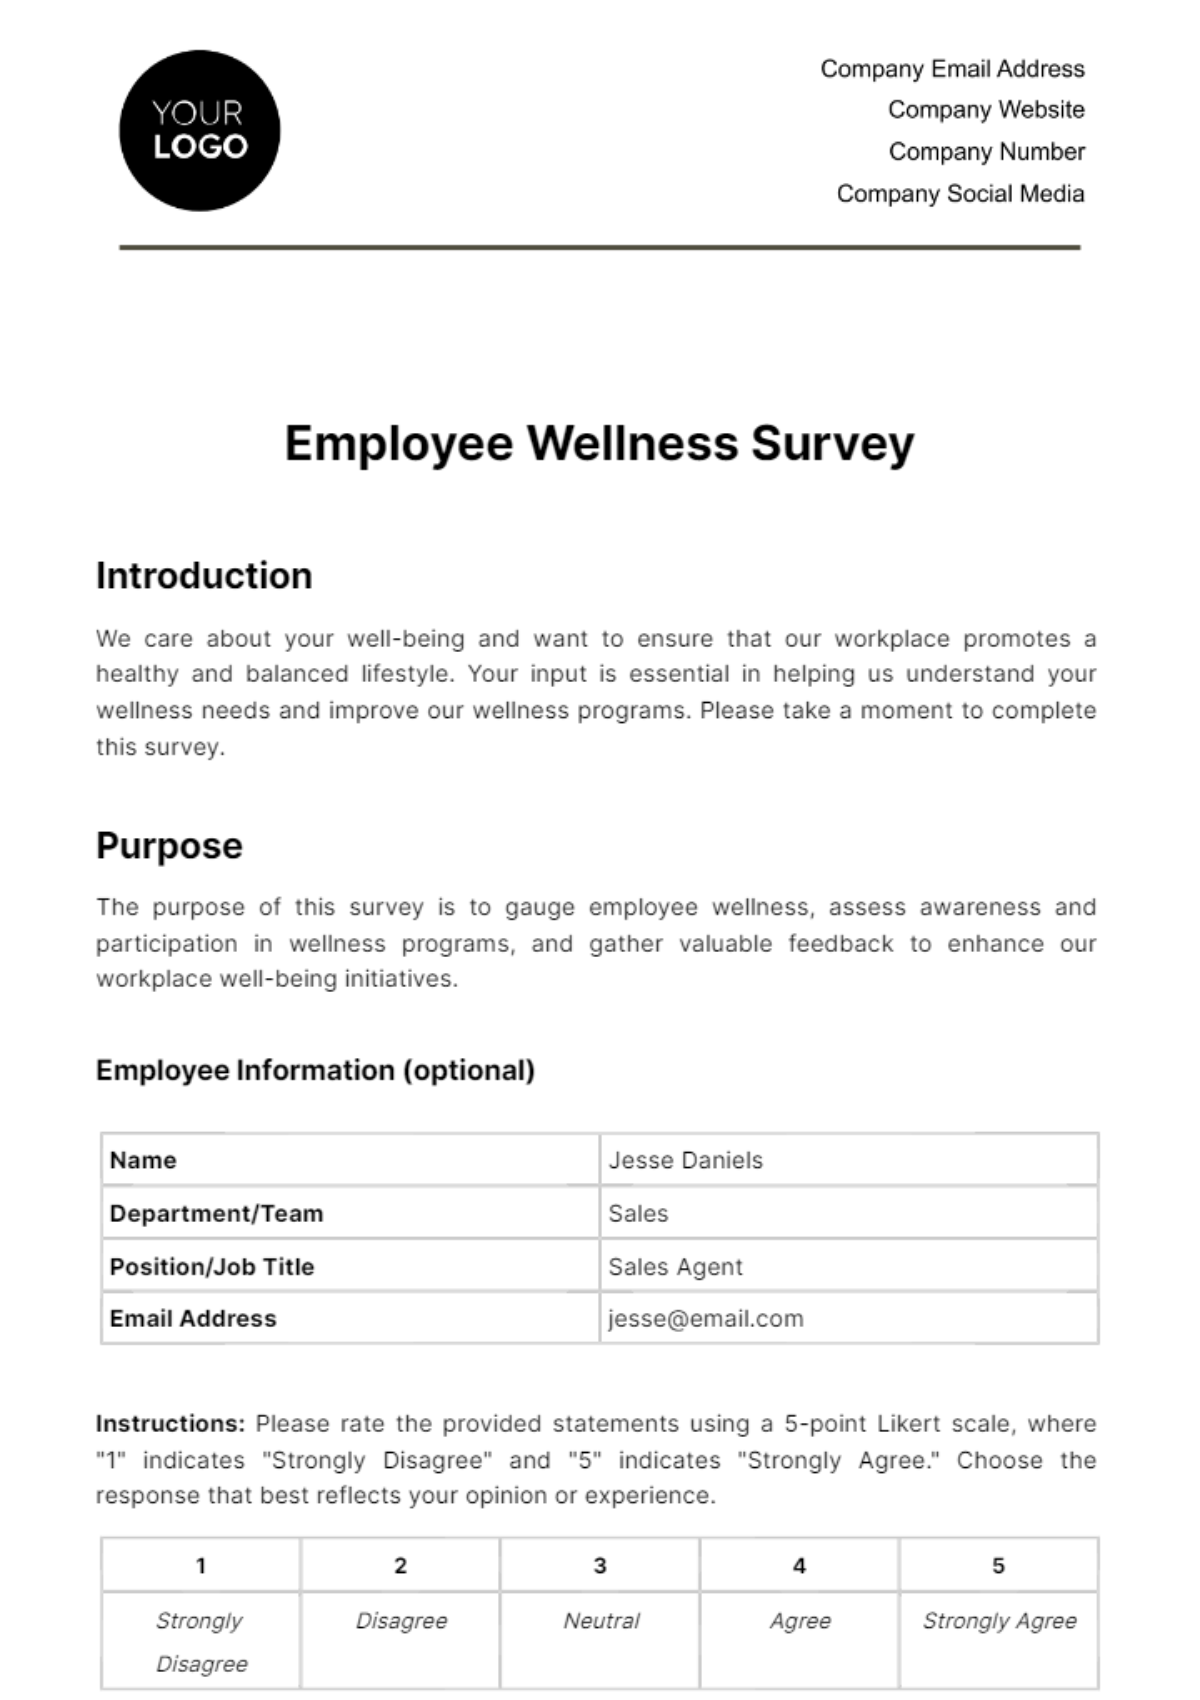
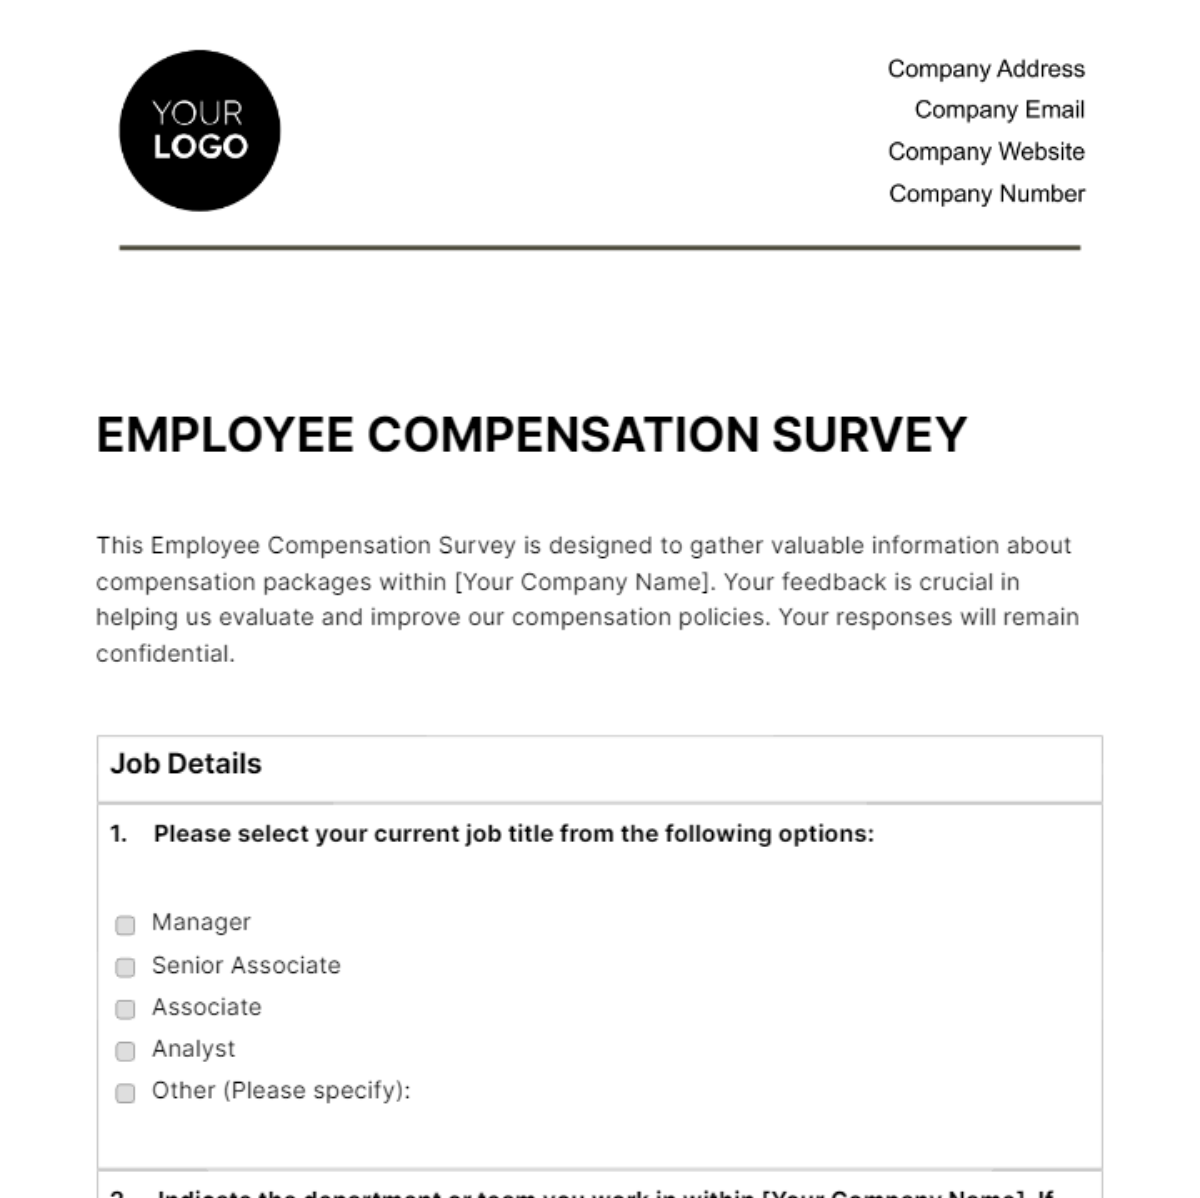
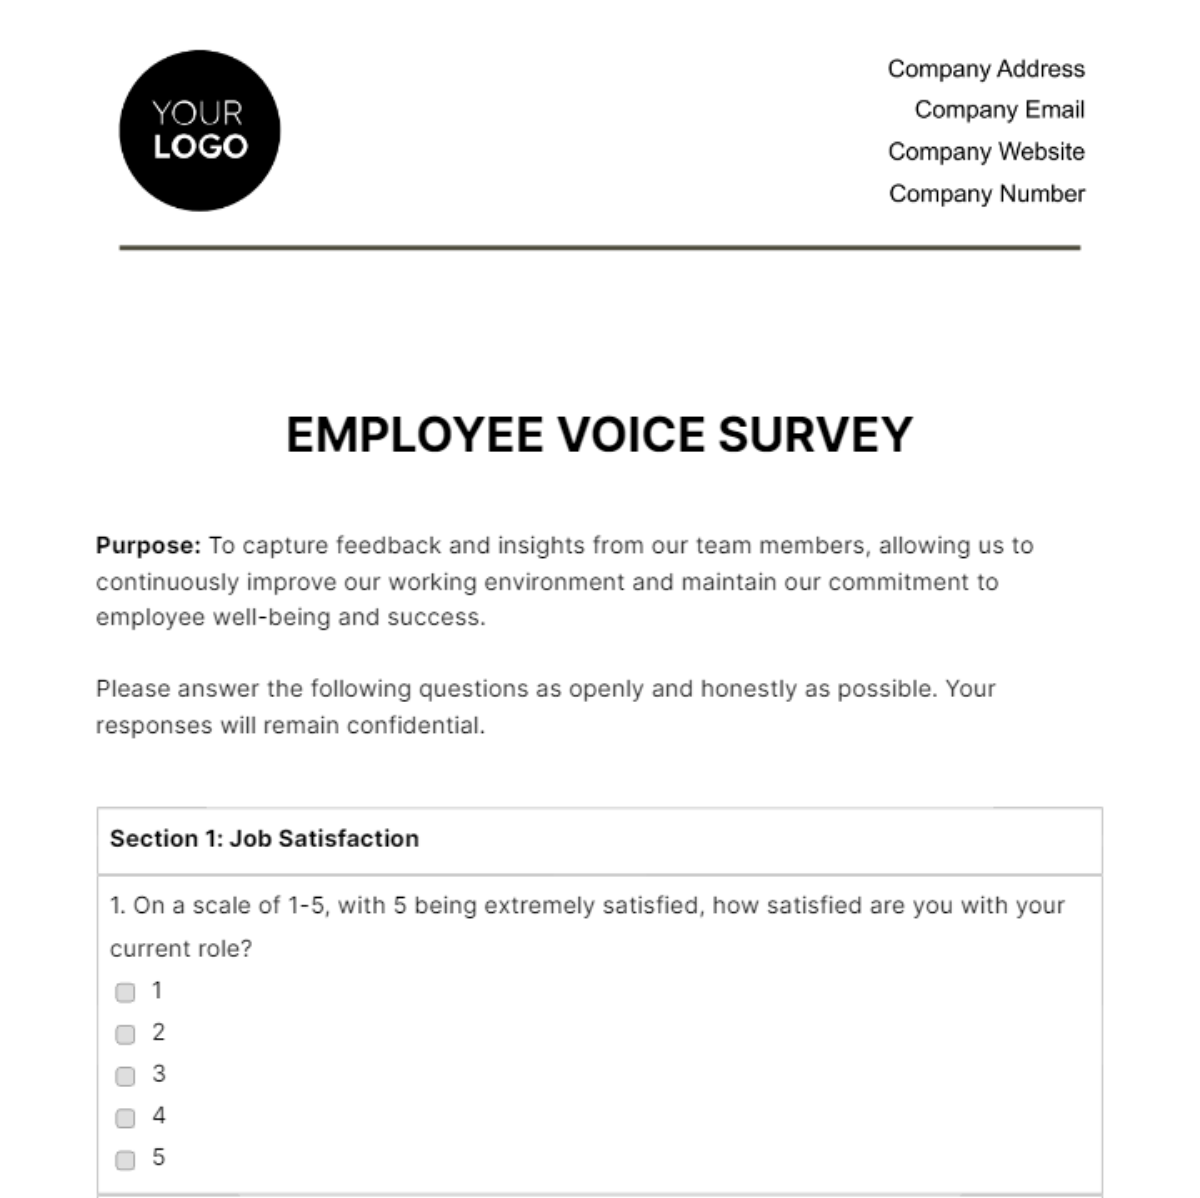
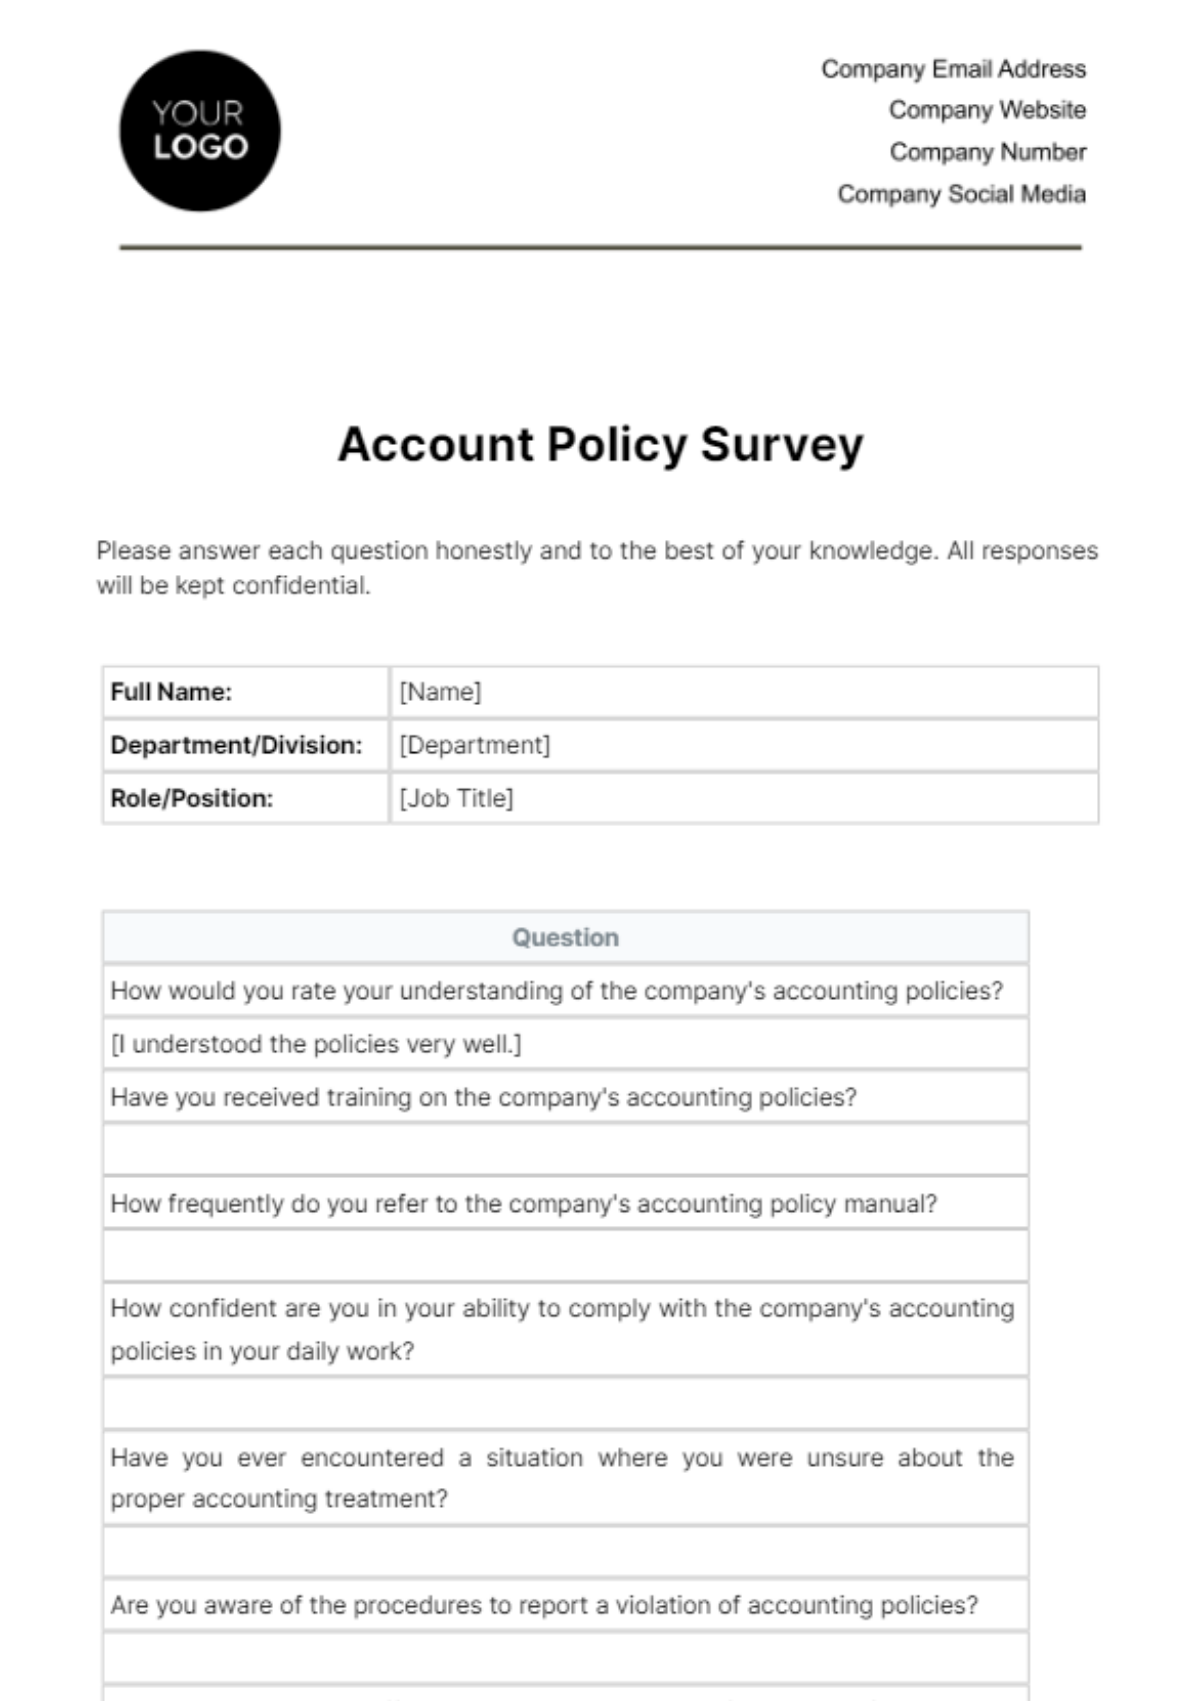
The complete set of questions used in the survey is provided for reference and future use.
Data Sets
Raw data sets are included to enable further analysis and research by interested parties.
For further information, please contact [Your Name] at [Your Email].
