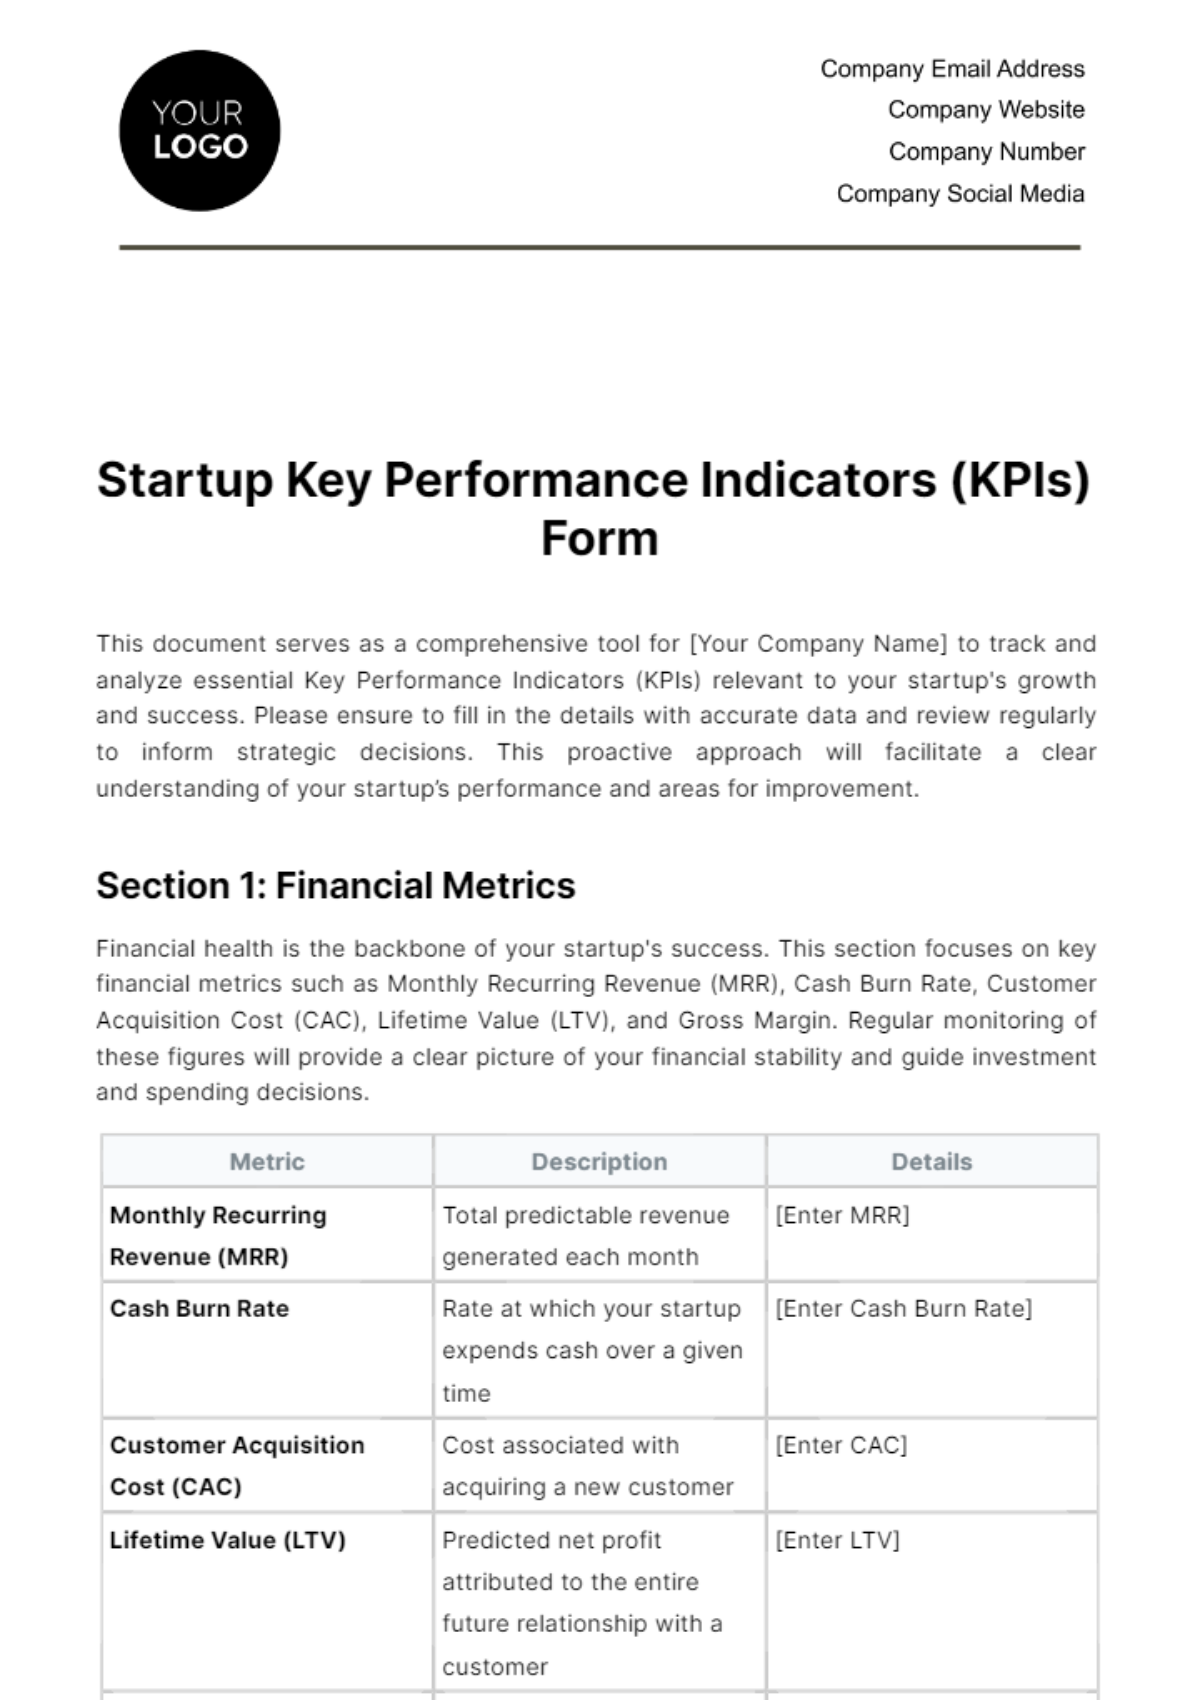
Startup Key Performance Indicators (KPIs) Form
This document serves as a comprehensive tool for [Your Company Name] to track and analyze essential Key Performance Indicators (KPIs) relevant to your startup's growth and success. Please ensure to fill in the details with accurate data and review regularly to inform strategic decisions. This proactive approach will facilitate a clear understanding of your startup’s performance and areas for improvement.
Section 1: Financial Metrics
Financial health is the backbone of your startup's success. This section focuses on key financial metrics such as Monthly Recurring Revenue (MRR), Cash Burn Rate, Customer Acquisition Cost (CAC), Lifetime Value (LTV), and Gross Margin. Regular monitoring of these figures will provide a clear picture of your financial stability and guide investment and spending decisions.
Metric | Description | Details |
|---|---|---|
Monthly Recurring Revenue (MRR) | Total predictable revenue generated each month | [Enter MRR] |
Cash Burn Rate | Rate at which your startup expends cash over a given time | [Enter Cash Burn Rate] |
Customer Acquisition Cost (CAC) | Cost associated with acquiring a new customer | [Enter CAC] |
Lifetime Value (LTV) | Predicted net profit attributed to the entire future relationship with a customer | [Enter LTV] |
Gross Margin | Revenue minus the cost of goods sold | [Enter Gross Margin] |
Section 2: Customer Metrics
Understanding your customer base is crucial for sustained growth. This section delves into metrics that reveal customer behavior and satisfaction, including Customer Churn Rate, Net Promoter Score (NPS), Customer Retention Rate, Average Order Value (AOV), and Customer Satisfaction Score (CSAT). These insights will help you refine your customer engagement and retention strategies.
Metric | Description | Details |
|---|---|---|
Customer Churn Rate | Percentage of customers who have stopped using your service during a given time frame | [Enter Customer Churn Rate] |
Net Promoter Score (NPS) | A measure of customer loyalty and satisfaction | [Enter NPS] |
Customer Retention Rate | Percentage of customers you retain relative to the number you had at the start of your period | [Enter Customer Retention Rate] |
Average Order Value (AOV) | Average amount spent each time a customer places an order | [Enter AOV] |
Customer Satisfaction Score (CSAT) | Measure of customer satisfaction with a product or service | [Enter CSAT] |
Section 3: Operational Metrics
Efficiency and productivity are key indicators of your operational health. In this section, we examine metrics such as Operational Efficiency, Inventory Turnover, Order Fulfillment Cycle Time, Employee Productivity Rate, and Quality Control Metrics. Tracking these will help you optimize operations and enhance productivity.
Metric | Description | Details |
|---|---|---|
Operational Efficiency | Key operational metrics indicating efficiency | [List Key Operational Metrics] |
Inventory Turnover | Number of times inventory is sold and replaced over a period | [Enter Inventory Turnover Rate] |
Order Fulfillment Cycle Time | Average time taken from receiving an order to delivering it | [Enter Cycle Time] |
Employee Productivity Rate | Output per employee over a defined period | [Enter Productivity Rate] |
Quality Control Metrics | Key metrics indicating the quality of products/services | [List Key Quality Metric] |
Section 4: Marketing and Sales Metrics
Marketing and sales are the engines of growth for your startup. This section highlights the importance of Lead Conversion Rate, Cost Per Lead (CPL), Sales Growth, Website Traffic, and Social Media Engagement. Analyzing these metrics will enable you to adjust your marketing and sales strategies for better performance.
Metric | Description | Details |
|---|---|---|
Lead Conversion Rate | Percentage of leads that turn into customers | [Enter Conversion Rate] |
Cost Per Lead (CPL) | Cost of generating a new lead | [Enter CPL] |
Sales Growth | Increase in sales over a specific period | [Enter Monthly/Quarterly Sales Growth] |
Website Traffic | Number of visitors to your company’s website | [Enter Website Traffic] |
Social Media Engagement | Engagement metrics for social media platforms | [Enter Key Engagement Metrics] |
Section 5: Product Development Metrics
Innovation drives competitive advantage. This section focuses on Product Development Metrics such as Feature Adoption Rate, Time to Market, Product Return Rate, R&D Spend as Percentage of Sales, and the Number of New Features Released. Regular assessment of these metrics is essential for maintaining your product's relevance and appeal in the market.
Metric | Description | Details |
|---|---|---|
Feature Adoption Rate | Rate at which new features are adopted by users | [Enter Adoption Rate] |
Time to Market | Time taken from product development initiation to launch | [Enter Time for Product Launch] |
Product Return Rate | Rate at which sold products are returned | [Enter Return Rate] |
R&D Spend as Percentage of Sales | Percentage of sales revenue spent on research and development | [Enter Percentage] |
Number of New Features Released | Total number of new features released in a period | [Enter Number of Features] |
Completion and Review
Completed By | [Your Name], [Your Job Title] |
|---|---|
[Your Email] | |
Date | [MM-DD-YYYY] |
Signature | [Your Signature] |
Ensure all data is accurate and up-to-date before signing off. Schedule regular reviews to adjust KPI targets and strategies based on performance and market changes.
This KPIs form is a strategic tool for [Your Company Name], enabling the tracking of vital metrics across different aspects of the business. Regular and thorough analysis of these KPIs is essential for making informed decisions and fostering sustainable growth.
