Training Guide on Marketing Metrics
I. Introduction
Why Marketing Metrics Matter
Marketing metrics are the lifeblood of any successful marketing strategy. They provide data-driven insights that help marketers understand the effectiveness of their efforts, make informed decisions, and demonstrate the value of marketing initiatives to the company. Without the proper use of marketing metrics, it's challenging to measure, optimize, and justify marketing investments.
Overview of Marketing Metrics in Our Company
In our company, we rely on a set of tailored marketing metrics to measure the performance and impact of our marketing campaigns and activities. These metrics are designed to align with our business objectives and help us continuously improve our strategies. This training guide will introduce you to these metrics and show you how to effectively analyze and leverage them.
II. Key Marketing Metrics
A. Website Traffic Metrics
Website Traffic: The number of visitors to our website.
Traffic Sources: Where our website visitors come from (e.g., organic search, social media, email, direct).
Bounce Rate: The percentage of visitors who leave the site without interacting.
B. Social Media Metrics
Followers: The number of followers on our social media platforms.
Engagement Rate: The rate at which our audience interacts with our social content (likes, shares, comments).
Click-Through Rate (CTR): The percentage of clicks on our social posts or ads.
C. Email Marketing Metrics
Open Rate: The percentage of recipients who open our emails.
Click-Through Rate (CTR): The percentage of recipients who click on links in our emails.
Conversion Rate: The percentage of email recipients who take a desired action.
D. Sales and Revenue Metrics
Sales Revenue: The total revenue generated from marketing efforts.
Customer Acquisition Cost (CAC): The cost to acquire a new customer.
Return on Investment (ROI): The return generated relative to marketing spend.
E. Customer Retention Metrics
Customer Churn Rate: The rate at which customers stop using our products or services.
Customer Lifetime Value (CLV): The value a customer brings to the company over their lifetime.
Net Promoter Score (NPS): A metric to gauge customer satisfaction and loyalty.
III. Data Sources and Tools
A. Data Sources
Google Analytics: For website traffic data.
Social Media Insights: For social media metrics.
Email Marketing Platforms: For email marketing metrics.
CRM and Sales Systems: For sales and revenue metrics.
Customer Feedback Surveys: For NPS and customer satisfaction data.
B. Analytics Tools
Google Analytics: To track website metrics.
Facebook Insights, Twitter Analytics, etc.: For social media analysis.
Email Marketing Software Analytics: For email metrics.
Excel, Google Sheets, or Data Visualization Tools: For data analysis and visualization.
IV. Setting Clear Objectives
A. Defining SMART Goals
Specific: When setting objectives, be clear and specific about what you want to achieve. Avoid vague statements and provide precise details about the desired outcome.
Measurable: Objectives must be quantifiable so you can track your progress and measure success.
Achievable: Ensure your goals are realistic and attainable within your resources and time frame. This avoids setting unrealistic expectations.
Relevant: Objectives should align with the overall business goals and strategic direction of the company. Make sure they contribute to the bigger picture.
Time-bound: Set specific deadlines or timeframes for achieving your objectives. This creates a sense of urgency and accountability.
B. Aligning Metrics with Objectives
It's crucial to select metrics that align with the SMART goals you've set. Make sure the metrics you track directly reflect your objectives.
For instance, if your goal is to increase website traffic, focus on metrics like website visits, bounce rate, and traffic sources. Ensure that each metric you choose is directly related to a specific aspect of your objectives. If the metric doesn't contribute to your goals, it may not be worth monitoring.
V. Understanding and Interpreting Metrics
A. KPIs (Key Performance Indicators)
Key Performance Indicators (KPIs) are metrics that are crucial to the success of your marketing efforts. These are the metrics that have a direct impact on your objectives and reflect the health of your marketing strategy. Here are some examples:
Sales Revenue: This KPI directly reflects the financial success of your marketing efforts. It's a fundamental indicator of how effectively your marketing activities are driving revenue.
Customer Acquisition Cost (CAC): This metric tells you how efficiently you're acquiring new customers. By understanding CAC, you can allocate your resources wisely.
Return on Investment (ROI): ROI measures the profitability of your marketing campaigns. It's a vital KPI because it directly links your marketing spend to the revenue it generates.
B. Metrics Definitions
It's essential to have a deep understanding of each metric you're tracking. Here's an example of how to define and understand the Click-Through Rate (CTR):
Click-Through Rate (CTR): CTR is a percentage that indicates the effectiveness of a marketing campaign in driving clicks to a website, email, or advertisement. It's calculated by dividing the number of clicks by the number of impressions or views and multiplying by 100. A higher CTR suggests that your content or ad is compelling and engaging to your audience.
Understanding metrics means not only knowing how to calculate them but also grasping their implications. For CTR, a high CTR indicates that your marketing material is resonating with your audience and driving them to take action.
Benchmarks and Industry Standards
To evaluate your performance, it's crucial to compare your metrics to industry standards and benchmarks. This provides context and helps you determine whether your performance is above, below, or on par with your competitors or industry norms.
VI. Marketing Funnel Metrics
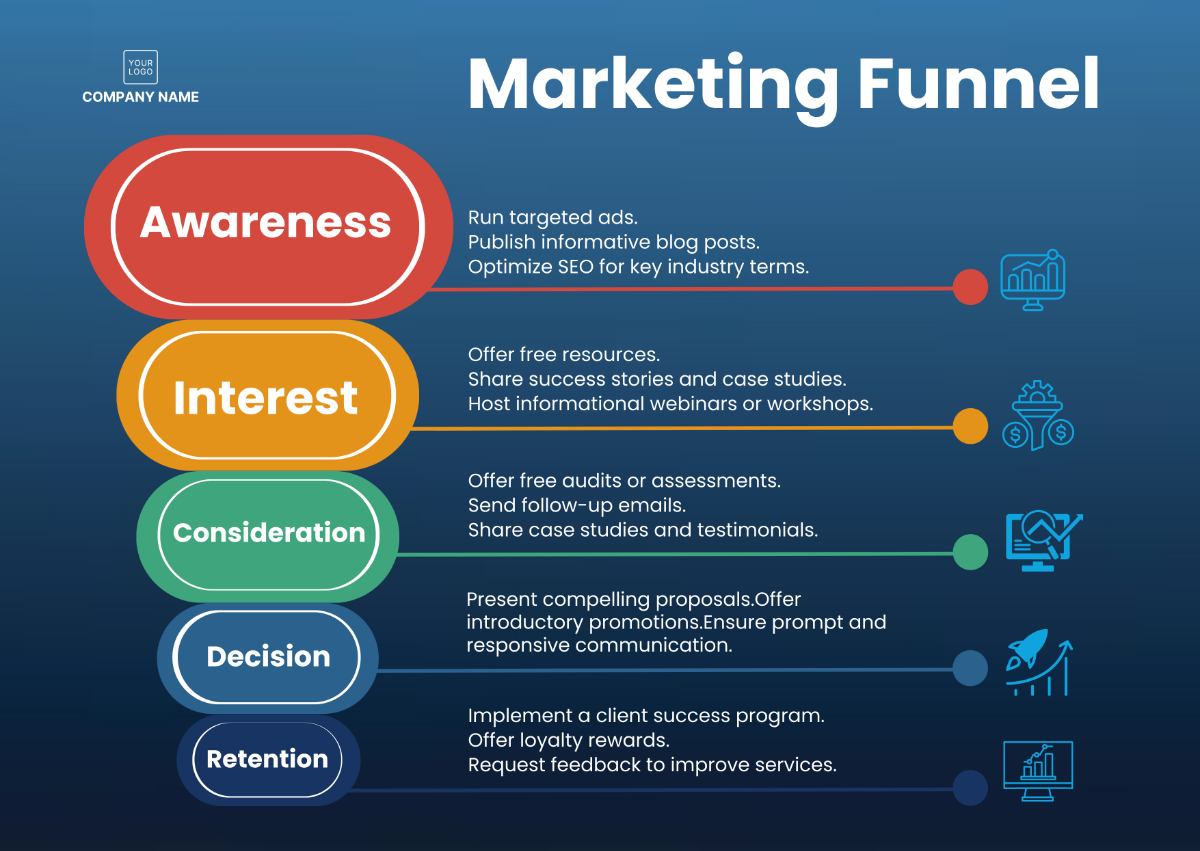
A. Awareness
Metrics:
Impressions: The number of times your content or ads are displayed to users.
Reach: The number of unique users who have seen your content or ads.
Website Visits: The number of users who have visited your website.
B. Interest
Metrics:
Clicks: The number of times users have clicked on your content or ads.
Engagement: This includes likes, comments, shares, and other forms of interaction with your content.
Content Views: The number of users who have viewed your content.
C. Consideration
Metrics:
Lead Generation: The number of users who have expressed interest in your offerings by signing up, downloading content, or providing contact information.
Form Submissions: Measuring how many users take the next step in the sales funnel by filling out forms.
D. Conversion
Metrics:
Sales: The ultimate goal, indicating that a user has made a purchase or converted into a paying customer.
Sign-Ups: Users who have registered for your services or signed up for your newsletter.
Goal Completions: Achieving specific objectives like software downloads, whitepaper access, or event registrations.
E. Loyalty
Metrics:
Repeat Purchases: Measuring the number of customers who make additional purchases or renew subscriptions.
Customer Feedback: Collecting feedback through surveys or reviews.
Net Promoter Score (NPS): A metric to gauge customer satisfaction and loyalty.
VII. Attribution Models
A. First-Touch Attribution
First-touch attribution attributes the first interaction a customer has with your brand as the most significant in the conversion process. In other words, it gives the entire credit for a conversion to the initial touchpoint.
First-touch attribution is useful when you want to understand how you're attracting new customers. It helps identify the channels or campaigns that are most effective at introducing your brand to potential customers.
B. Last-Touch Attribution
Last-touch attribution attributes the last interaction before a conversion as the most significant. It assumes that the final touchpoint is the one that convinced the customer to convert.
Last-touch attribution is valuable when you want to determine which specific marketing effort was the tipping point that led to the conversion. It helps in optimizing the final stage of the customer journey.
C. Multi-Touch Attribution
Multi-touch attribution considers all touchpoints in a customer's journey to conversion. It acknowledges that multiple interactions and marketing efforts contribute to a sale.
Multi-touch attribution is essential for understanding the holistic customer journey. It helps in allocating credit to various touchpoints, showing how marketing channels work together to guide a prospect through the funnel.
D. Attribution Challenges
Understanding the customer journey can be complex due to various factors:
Customer Touch Points: Customers may interact with your brand through multiple channels before converting, making it challenging to determine which interaction was most critical.
Cross-Device Behavior: Customers may switch between devices (e.g., mobile, desktop) during their journey, complicating the tracking of their actions.
Lengthy Sales Cycles: In B2B or high-value sales, the conversion process may take months, making it challenging to attribute success to a single interaction.
VIII. Metrics Reporting
A. Creating Dashboards
Dashboards are visual tools that provide a concise and easily digestible view of key metrics and KPIs. They offer a quick way to assess the health of your marketing campaigns.
Dashboards allow you to monitor real-time or historical performance, identify trends, and make quick decisions. Tools like Google Data Studio, Tableau, or custom-built dashboards can help visualize data.
B. Frequency of Reporting
The frequency of reporting refers to how often you share marketing performance reports with stakeholders, whether it's daily, weekly, monthly, or quarterly.
The reporting frequency should align with the pace of your marketing campaigns and the urgency of the metrics. Real-time reporting might be crucial for digital advertising, while a monthly report might suffice for long sales cycles.
C. Report Visualization
Report visualization involves presenting data using charts, graphs, and tables to make it more accessible and understandable to a wider audience.
Visualization helps stakeholders quickly grasp the significance of the data, identify trends, and make informed decisions. It's important for ensuring that the insights from data are effectively communicated.
IX. Optimizing Marketing Strategies
A. A/B Testing
A/B testing, also known as split testing, involves comparing two versions of a webpage, email, or ad to determine which one performs better. It's an empirical way to improve conversion rates and other KPIs.
A/B testing is valuable when you want to refine specific elements of your marketing, such as email subject lines, ad copy, landing page design, or call-to-action buttons. By testing two variations with a controlled audience, you can identify which version is more effective.
B. ROI Analysis
ROI (Return on Investment) analysis is the process of evaluating the profitability of your marketing campaigns by comparing the revenue generated to the cost of the marketing efforts.
ROI analysis is fundamental for determining the effectiveness of your marketing strategies. It helps in assessing which campaigns or channels are delivering the highest return and where you should allocate resources for maximum impact.
C. Iterative Improvement
Iterative improvement is the practice of continuously analyzing data and making incremental changes to your marketing strategies based on insights gained from the data.
Marketing is an ever-evolving field. By adopting a mindset of continuous improvement, you can adapt to changing consumer behavior and market dynamics, ensuring that your strategies remain effective and relevant over time.
X. Data Privacy and Compliance
GDPR and CCPA
Data privacy and compliance are paramount in today's marketing landscape, especially when dealing with customer data. Two significant regulations to be aware of are the General Data Protection Regulation (GDPR) and the California Consumer Privacy Act (CCPA).
A. GDPR (General Data Protection Regulation): This European regulation governs the collection, processing, and storage of personal data of individuals within the European Union. Even if your company is not based in the EU, if you handle EU citizen data, you are subject to GDPR. Key aspects of GDPR include obtaining explicit consent for data collection, providing the right to be forgotten, and ensuring data security.
B. CCPA (California Consumer Privacy Act): This California state law focuses on the rights of California residents regarding their personal data. It grants individuals the right to know what personal information is being collected and the right to opt out of the sale of their data. Companies collecting and processing data from Californian residents must comply with CCPA.
XI. Best Practices for Compliance
To ensure data privacy and compliance, consider implementing these best practices:
A. Data Consent: Clearly communicate how and why you collect data and obtain explicit consent from individuals. This is especially important in email marketing and data collection forms.
B. Data Security: Implement robust data security measures to protect customer data from breaches and unauthorized access.
C. Data Retention Policies: Define data retention periods and regularly review and delete data that is no longer necessary.
D. Data Portability: Enable individuals to access and export their data upon request.
E. Data Subject Rights: Understand and respect data subjects' rights, such as the right to be forgotten (erasure) and the right to access their data.
F. Employee Training: Ensure that your marketing and data-handling teams are aware of data privacy regulations and compliant in their practices.


