Free Sales Report on Trade Show Expenses
I. Executive Summary
This report presents a comprehensive analysis of the trade show expenses incurred by [Your Company Name] throughout the fiscal year [2050]. It outlines the strategic objectives of attending trade shows, the allocation and utilization of budgets, the detailed breakdown of expenses, the analysis of attendance, lead generation effectiveness, the return on investment (ROI), and provides recommendations for future trade show participations.
II. Trade Show Objectives
A. Purpose of Participation
[Your Company Name] attended trade shows with the intent to increase brand visibility, establish and strengthen industry partnerships, and generate qualified leads. Participation also aimed at gauging market trends and competitor strategies.
B. Expected Outcomes
The key expected outcomes from the trade shows were:
[20%] increase in brand awareness as measured by social media mentions and survey data.
Acquisition of [500+] qualified leads.
Establishment of [3] strategic partnerships with industry leaders.
III. Budget Overview
A. Initial Budget Allocation
The initial budget allocated for the year [2050] was [$500,000], intended to cover all trade show-related expenses.
B. Adjustments and Reallocations
A mid-year budget adjustment granted an additional [$50,000] to accommodate extra costs for high-potential shows.
IV. Breakdown of Expenses
A. Expenses
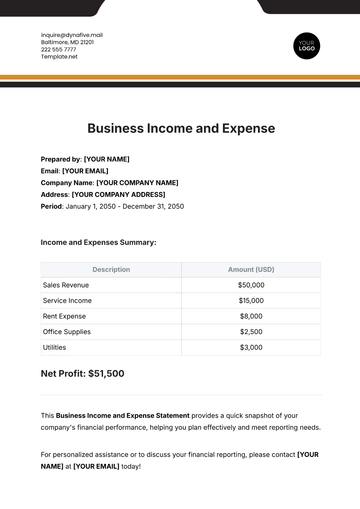
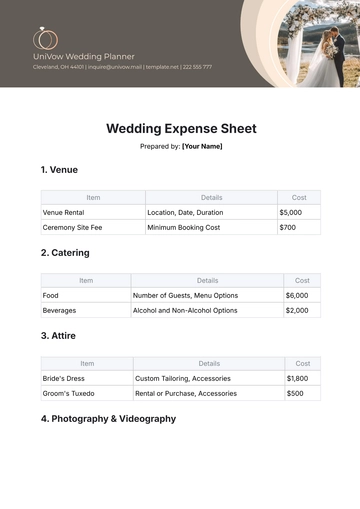
The following table categorizes the various expenses incurred:
Category | Allocated Budget | Actual Spending | Variance |
Booth Space Rental | $150,000 | $145,000 | $5,000 |
Booth Design and Construction | |||
Travel and Accommodation | |||
Shipping and Handling | |||
Marketing Materials | |||
Promotional Items | |||
Staff Training and Salaries | |||
Miscellaneous and Emergencies | |||
Total |
B. Explanation of Variances
Booth Design and Construction costs exceeded due to the adoption of advanced interactive technologies.
Travel and Accommodation were over the budget due to unexpected price surges.
Savings in Miscellaneous and Emergencies reflect effective contingency planning.
V. Analysis of Trade Show Attendance
A. Attendance Metrics
Over the year, [Your Company Name] attended [12] trade shows, with an average booth traffic of [1,500] individuals per event.
B. Demographic Breakdown
Approximately [70%] of attendees engaged were decision-makers or influencers in their respective organizations.
VI. Lead Generation Statistics
A. Leads Captured
A total of [6,000] leads were captured, surpassing the target by [1,000] leads.
B. Quality of Leads
[60%] of leads were considered high quality, indicating immediate needs or decision-making capability.
[30%] were medium quality, showing interest but no immediate plans.
[10%] were low quality, with general inquiries.
VII. Recommendations and Future Actions
A. Key Learnings
Interactive booth designs significantly increase engagement.
Early booking of travel arrangements can reduce costs.
B. Strategic Recommendations
Increase the budget for design and technology to enhance booth interaction.
Negotiate long-term deals with travel and accommodation providers to control costs.
Focus on shows with higher decision-maker attendance for better lead quality.
C. Tactical Actions
Schedule debriefing sessions post each trade show to gather insights and improve continuously.
Implement a more rigorous lead qualification process at the point of capture to increase the quality of leads.
VIII. Conclusion
The trade show initiative in [2050] has been highly successful, achieving a significant increase in brand visibility and generating a positive ROI. By making strategic adjustments in our approach and methodology, we believe that [Your Company Name], is well-positioned for success. This allows us to use trade shows as a powerful tool not just for the sustained growth of our company, in terms of increasing our customer base and financial gain, but also to reinforce and ideally grow our influence in the market we operate in.
- 100% Customizable, free editor
- Access 1 Million+ Templates, photo’s & graphics
- Download or share as a template
- Click and replace photos, graphics, text, backgrounds
- Resize, crop, AI write & more
- Access advanced editor
Keep track of your trade show expenses with our Sales Report on Trade Show Expenses Template! This fully editable and customizable report from Template.net ensures you capture every important detail. The AI Editor Tool makes editing seamless, allowing you to provide a clear and comprehensive report on trade show expenses!
