Free Dashboard Executive Summary Template
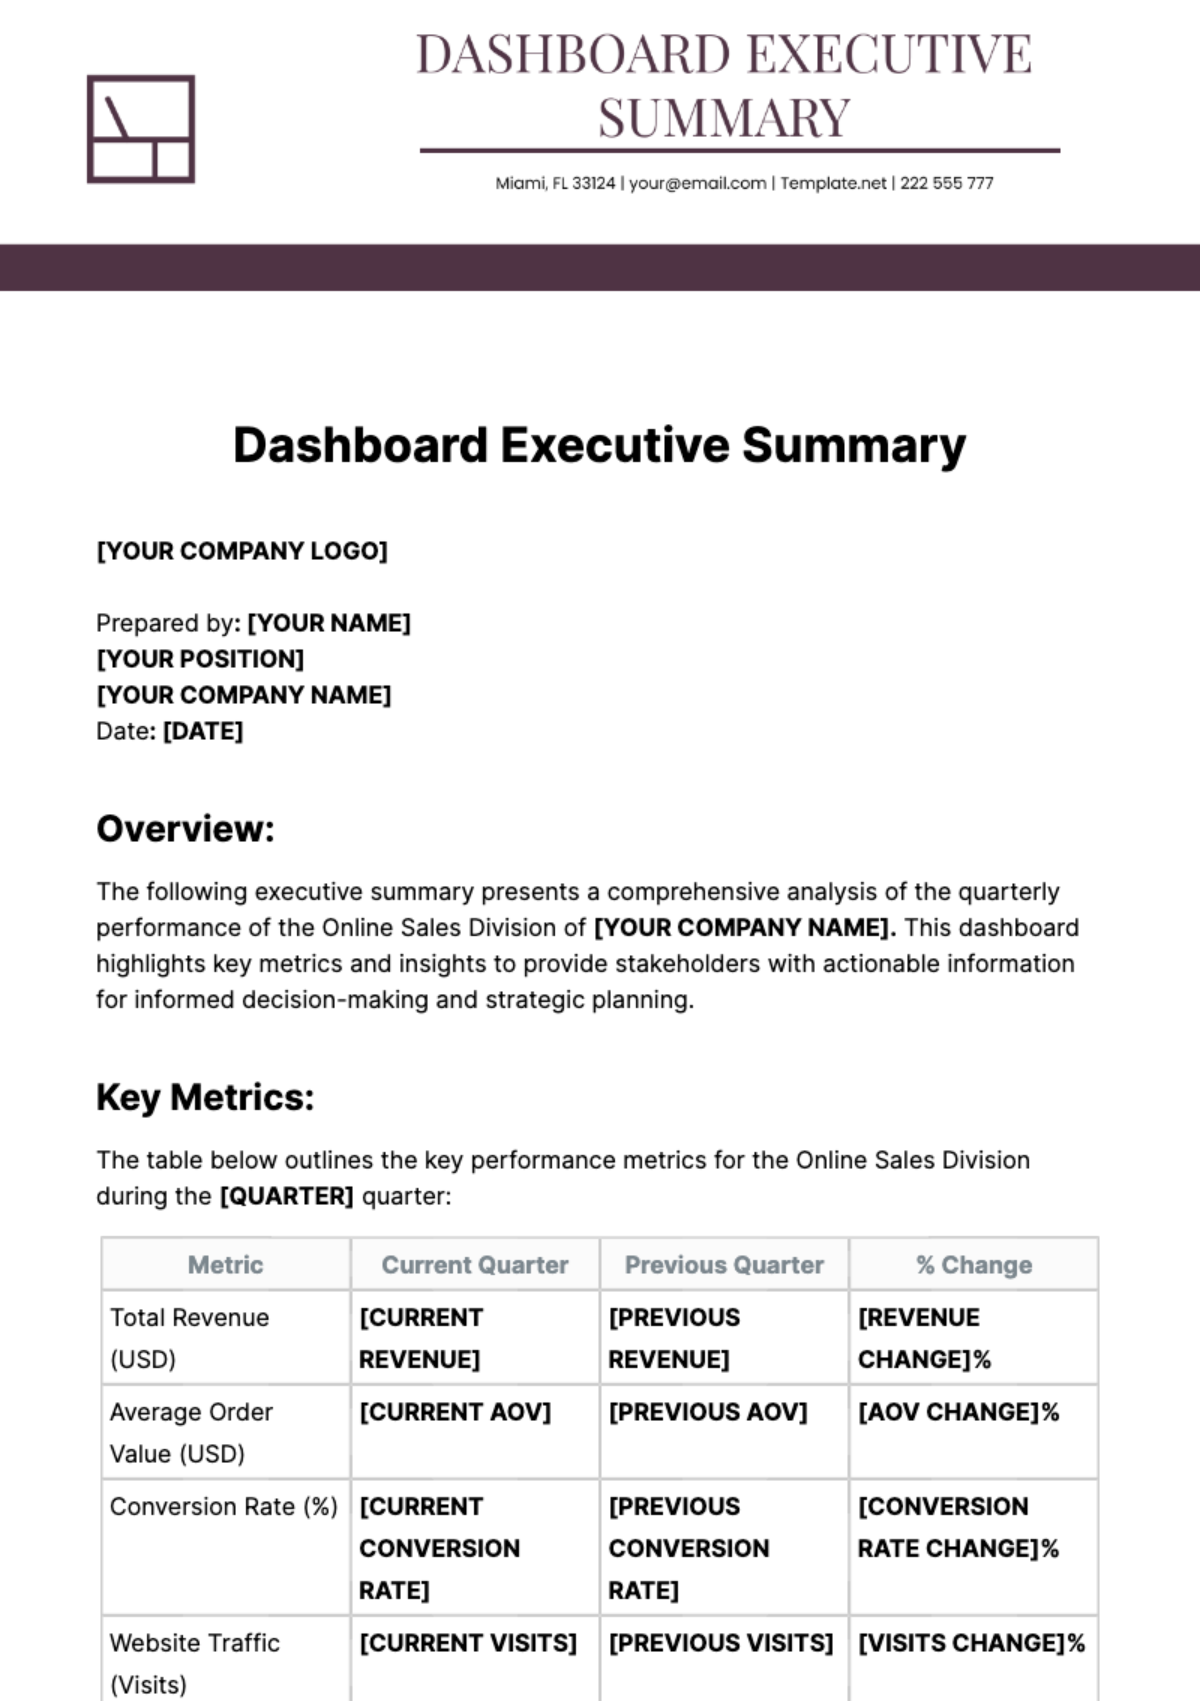
Dashboard Executive Summary
[YOUR COMPANY LOGO]
Prepared by: [YOUR NAME]
[YOUR POSITION]
[YOUR COMPANY NAME]
Date: [DATE]
Overview:
The following executive summary presents a comprehensive analysis of the quarterly performance of the Online Sales Division of [YOUR COMPANY NAME]. This dashboard highlights key metrics and insights to provide stakeholders with actionable information for informed decision-making and strategic planning.
Key Metrics:
The table below outlines the key performance metrics for the Online Sales Division during the [QUARTER] quarter:
Metric | Current Quarter | Previous Quarter | % Change |
|---|---|---|---|
Total Revenue (USD) | [CURRENT REVENUE] | [PREVIOUS REVENUE] | [REVENUE CHANGE]% |
Average Order Value (USD) | [CURRENT AOV] | [PREVIOUS AOV] | [AOV CHANGE]% |
Conversion Rate (%) | [CURRENT CONVERSION RATE] | [PREVIOUS CONVERSION RATE] | [CONVERSION RATE CHANGE]% |
Website Traffic (Visits) | [CURRENT VISITS] | [PREVIOUS VISITS] | [VISITS CHANGE]% |
Customer Acquisition Cost (CAC) | [CURRENT CAC] | [PREVIOUS CAC] | [CAC CHANGE]% |
Key Insights:
Revenue Growth: The Online Sales Division achieved a [REVENUE CHANGE]% increase in total revenue compared to the previous quarter, driven by [HIGHLIGHT KEY INITIATIVES/PRODUCTS].
Average Order Value: The average order value (AOV) remained stable at [CURRENT AOV], reflecting [EXPLANATION OF AOV TRENDS].
Conversion Rate: Despite [CHALLENGES/OPPORTUNITIES], the division maintained a steady conversion rate of [CURRENT CONVERSION RATE]%.
Website Traffic: [INSIGHT INTO WEBSITE TRAFFIC TRENDS] resulted in a [VISITS CHANGE]% increase in website traffic compared to the previous quarter.
Customer Acquisition Cost: [EFFICIENCY IMPROVEMENT/CHALLENGE] led to a [CAC CHANGE]% reduction in customer acquisition costs, enhancing profitability.
Actionable Recommendations:
Optimize Marketing Channels: Allocate resources to high-performing marketing channels and adjust strategies to maximize ROI.
Enhance User Experience: Invest in website optimization and customer journey enhancements to improve conversion rates and AOV.
Customer Retention Strategies: Implement loyalty programs and personalized marketing initiatives to foster customer loyalty and repeat purchases.
Data-Driven Decision-Making: Leverage data analytics and customer insights to inform product assortment and marketing strategies.
Conclusion:
The quarterly performance dashboard highlights the Online Sales Division's achievements, challenges, and opportunities for growth. By implementing actionable recommendations and leveraging key insights, [YOUR COMPANY NAME] is poised to drive continued success and profitability in the online retail sector.


