Free Printable Annual Report

I. Letter to Shareholders
Dear Shareholders,
We are excited to present the 2050 Annual Report for [YOUR COMPANY NAME]. This year has been transformative for our company, marked by exceptional growth, groundbreaking innovations, and strategic partnerships. Our dedication to driving the future of technology has positioned us as a leader in the industry, delivering strong financial results and setting the stage for continued success.
In 2050, [YOUR COMPANY NAME] achieved record revenues of $150 billion, a testament to our relentless focus on innovation and operational excellence. As we look toward 2051, we are confident in our ability to maintain this momentum, fueled by our robust pipeline of new products and our expansion into emerging markets.
Thank you for your trust and support. We are committed to creating long-term value for our shareholders and driving the future of technology.
Sincerely,
[YOUR NAME]
Chief Executive Officer
II. Company Overview
[YOUR COMPANY NAME] is a global leader in advanced technology solutions, specializing in artificial intelligence, quantum computing, and next-generation renewable energy systems. Founded in 2025, [YOUR COMPANY NAME] has rapidly grown to become a dominant force in the technology sector, known for its cutting-edge innovations and commitment to sustainability.
Mission Statement
Our mission is to revolutionize the future through technology, delivering superior value to our shareholders, customers, and communities by driving innovation and sustainability.
Vision Statement
Our vision is to be the global leader in technological innovation, shaping the future and improving the world through our groundbreaking solutions.
III. Financial Highlights
Key Financial Metrics for 2050
Revenue: $150 billion (increase of 25% from 2049)
Net Income: $20 billion (increase of 30% from 2049)
Earnings Per Share (EPS): $15.00 (increase of 28% from 2049)
Operating Margin: 35%
Return on Equity (ROE): 18%
Total Assets: $300 billion
Total Liabilities: $120 billion
Dividend Per Share: $5.00
Performance Summary
[YOUR COMPANY NAME]. delivered outstanding financial performance in 2050, driven by significant revenue growth across all business segments. Our disciplined cost management and strategic investments have resulted in a solid financial position, enabling us to return substantial value to our shareholders through increased dividends and share buybacks.
IV. Management’s Discussion and Analysis
Overview of 2050 Performance
In 2050, [YOUR COMPANY NAME] continued its trajectory of strong growth, underpinned by robust demand for our AI-driven solutions and the successful launch of our quantum computing platform. Our strategic focus on sustainability and renewable energy also paid off, with our green energy solutions contributing significantly to our revenue.
Revenue Analysis
Revenue increased by 25% in 2050, primarily due to strong sales in our AI and quantum computing divisions. Our expansion into new markets in Asia and Africa also contributed to this growth, with revenues from these regions increasing by 40% year-over-year.
Cost Management
We implemented a series of cost optimization initiatives that reduced operating expenses by 10%, despite the increased scale of our operations. These savings were achieved through supply chain efficiencies, automation, and strategic sourcing.
Future Outlook
Looking ahead to 2051, we are focused on scaling our operations in high-growth regions, investing in next-generation technologies, and expanding our product offerings in the renewable energy sector. We expect continued revenue growth and improved profitability as we capitalize on these opportunities.
V. Business Strategy and Outlook
Strategic Priorities
Innovation: We will continue to invest heavily in research and development to stay at the forefront of technological advancements, particularly in AI, quantum computing, and renewable energy.
Market Expansion: Our strategy includes aggressive expansion into emerging markets, with a focus on Asia and Africa, where we see significant growth potential.
Sustainability: We are committed to achieving net-zero carbon emissions by 2055, and our sustainability initiatives are integral to our business strategy.
Operational Excellence: We will further enhance our operational efficiencies through automation, data-driven decision-making, and continuous process improvements.
Growth Prospects
We anticipate a strong year ahead, with projected revenue growth of 20% in 2051, driven by new product launches and continued market expansion. Our focus on sustainability and innovation will ensure that FutureTech remains a leader in the technology sector.
VI. Risk Factors
Market Risk
[YOUR COMPANY NAME] faces market risks, including potential fluctuations in global demand for technology products, changes in consumer preferences, and economic instability in key markets.
Regulatory Risk
We operate in a highly regulated environment, with evolving laws and regulations that could impact our operations. Compliance with data protection, environmental, and industry-specific regulations is a priority for us.
Operational Risk
Operational risks include potential supply chain disruptions, cybersecurity threats, and reliance on key suppliers. We have implemented robust risk management practices to mitigate these risks.
VII. Corporate Governance
[YOUR COMPANY NAME] is committed to the highest standards of corporate governance, ensuring transparency, accountability, and ethical conduct in all our operations.
Board of Directors
Chairman: [YOUR NAME]
CEO: Jane Doe
Independent Directors: Emily White, Michael Brown, Sarah Johnson
Governance Policies
Our governance framework includes comprehensive policies on ethics, compliance, risk management, and corporate social responsibility, ensuring that we operate with integrity and accountability.
VIII. Financial Statements
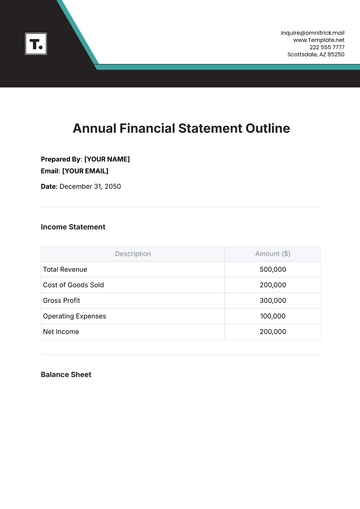
Consolidated Income Statement (2050)
Item | 2050 | 2049 |
|---|---|---|
Revenue | $150 billion | $120 billion |
Cost of Goods Sold (COGS) | $90 billion | $75 billion |
Gross Profit | $60 billion | $45 billion |
Operating Expenses | $22 billion | $20 billion |
Net Income | $20 billion | $15 billion |
Consolidated Balance Sheet (2050)
Item | 2050 | 2049 |
|---|---|---|
Total Assets | $300 billion | $250 billion |
Total Liabilities | $120 billion | $100 billion |
Shareholders’ Equity | $180 billion | $150 billion |
Consolidated Cash Flow Statement (2050)
Item | 2050 | 2049 |
|---|---|---|
Net Cash from Operating Activities | $25 billion | $18 billion |
Net Cash from Investing Activities | $-10 billion | $-8 billion |
Net Cash from Financing Activities | $5 billion | $4 billion |
IX. Notes to the Financial Statements
The notes provide detailed explanations of the financial statements, including accounting policies, significant transactions, and any necessary adjustments. Key areas of focus include revenue recognition, inventory valuation, and impairment testing.
Auditor’s Report
We have audited the accompanying financial statements of [YOUR COMPANY NAME], which comprise the consolidated balance sheets as of December 31, 2050, and 2049, and the related consolidated statements of income, changes in shareholders’ equity, and cash flows for the years then ended. In our opinion, the financial statements present fairly, in all material respects, the financial position of the company as of December 31, 2050, in accordance with IFRS standards.
James Audit
Global Audit LLP
Date: February 15, 2051
X. Investor Information
Stock Information
Ticker Symbol: FTEC
Stock Exchange: New York Stock Exchange
Share Price as of Dec 31, 2050: $350
Dividend Yield: 1.4%
Contact Information
For investor inquiries, please contact:
Jane Aarons
Director of Investor Relations
Phone: [YOUR COMPANY NUMBER]
Email: [YOUR COMPANY EMAIL]
[YOUR COMPANY NAME], [YOUR COMPANY ADDRESS]
- 100% Customizable, free editor
- Access 1 Million+ Templates, photo’s & graphics
- Download or share as a template
- Click and replace photos, graphics, text, backgrounds
- Resize, crop, AI write & more
- Access advanced editor
Transform your annual reporting with Template.net's Annual Report Template. Our customizable and editable template offers a seamless solution for your business needs. Crafted to perfection, it ensures professionalism and clarity in presenting your company's achievements. With our AI Editor Tool, customization is a breeze, allowing you to tailor your report effortlessly.
You may also like
- Sales Report
- Daily Report
- Project Report
- Business Report
- Weekly Report
- Incident Report
- Annual Report
- Report Layout
- Report Design
- Progress Report
- Marketing Report
- Company Report
- Monthly Report
- Audit Report
- Status Report
- School Report
- Reports Hr
- Management Report
- Project Status Report
- Handover Report
- Health And Safety Report
- Restaurant Report
- Construction Report
- Research Report
- Evaluation Report
- Investigation Report
- Employee Report
- Advertising Report
- Weekly Status Report
- Project Management Report
- Finance Report
- Service Report
- Technical Report
- Meeting Report
- Quarterly Report
- Inspection Report
- Medical Report
- Test Report
- Summary Report
- Inventory Report
- Valuation Report
- Operations Report
- Payroll Report
- Training Report
- Job Report
- Case Report
- Performance Report
- Board Report
- Internal Audit Report
- Student Report
- Monthly Management Report
- Small Business Report
- Accident Report
- Call Center Report
- Activity Report
- IT and Software Report
- Internship Report
- Visit Report
- Product Report
- Book Report
- Property Report
- Recruitment Report
- University Report
- Event Report
- SEO Report
- Conference Report
- Narrative Report
- Nursing Home Report
- Preschool Report
- Call Report
- Customer Report
- Employee Incident Report
- Accomplishment Report
- Social Media Report
- Work From Home Report
- Security Report
- Damage Report
- Quality Report
- Internal Report
- Nurse Report
- Real Estate Report
- Hotel Report
- Equipment Report
- Credit Report
- Field Report
- Non Profit Report
- Maintenance Report
- News Report
- Survey Report
- Executive Report
- Law Firm Report
- Advertising Agency Report
- Interior Design Report
- Travel Agency Report
- Stock Report
- Salon Report
- Bug Report
- Workplace Report
- Action Report
- Investor Report
- Cleaning Services Report
- Consulting Report
- Freelancer Report
- Site Visit Report
- Trip Report
- Classroom Observation Report
- Vehicle Report
- Final Report
- Software Report
