Free Restaurant Annual Evaluation
I. Introduction
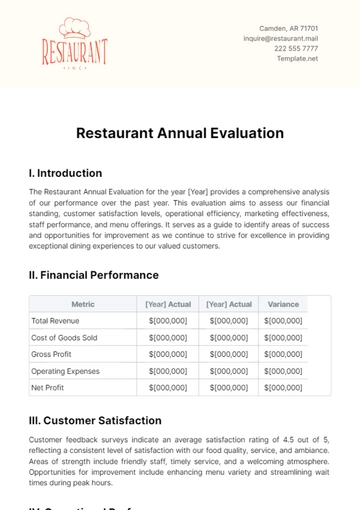
The Restaurant Annual Evaluation for the year [Year] provides a comprehensive analysis of our performance over the past year. This evaluation aims to assess our financial standing, customer satisfaction levels, operational efficiency, marketing effectiveness, staff performance, and menu offerings. It serves as a guide to identify areas of success and opportunities for improvement as we continue to strive for excellence in providing exceptional dining experiences to our valued customers.
II. Financial Performance
Metric | [Year] Actual | [Year] Actual | Variance |
|---|---|---|---|
Total Revenue | $[000,000] | $[000,000] | $[000,000] |
Cost of Goods Sold | $[000,000] | $[000,000] | $[000,000] |
Gross Profit | $[000,000] | $[000,000] | $[000,000] |
Operating Expenses | $[000,000] | $[000,000] | $[000,000] |
Net Profit | $[000,000] | $[000,000] | $[000,000] |
III. Customer Satisfaction
Customer feedback surveys indicate an average satisfaction rating of 4.5 out of 5, reflecting a consistent level of satisfaction with our food quality, service, and ambiance. Areas of strength include friendly staff, timely service, and a welcoming atmosphere. Opportunities for improvement include enhancing menu variety and streamlining wait times during peak hours.
IV. Operational Performance
Metric | [Year] Actual | [Year] Actual | Variance |
|---|---|---|---|
Average Daily Covers | [00] | [00] | [00] |
Table Turnover Rate | [00] | [00] | [00] |
Labor Cost Percentage | [00]% | [00]% | [00]% |
Food Cost Percentage | [00]% | [00]% | [00]% |
Reservation No-show Rate | [00]% | [00]% | [00]% |
Health Inspection Score | [00] | [00] | [00] |
V. Marketing and Promotions
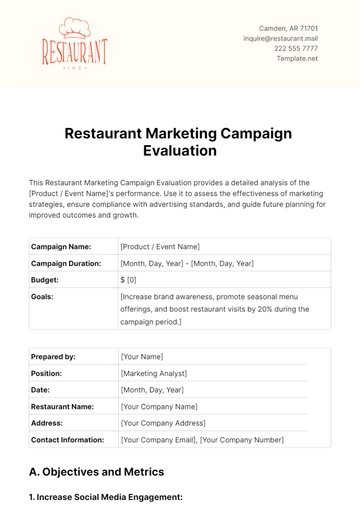
Our social media marketing campaigns led to a [00]% increase in online engagement and a [00]% growth in new followers. However, our return on investment for paid advertising decreased by [00]% compared to the previous year. Moving forward, we plan to optimize our marketing budget allocation and explore new promotional strategies to drive customer traffic and boost revenue.
VI. Staff Performance
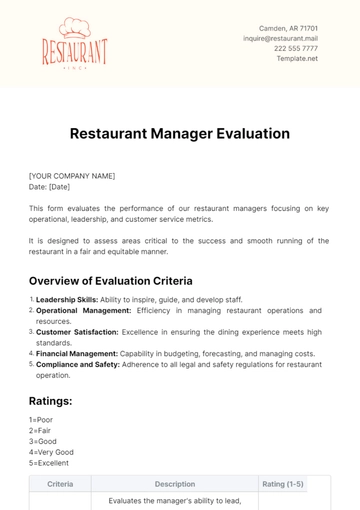
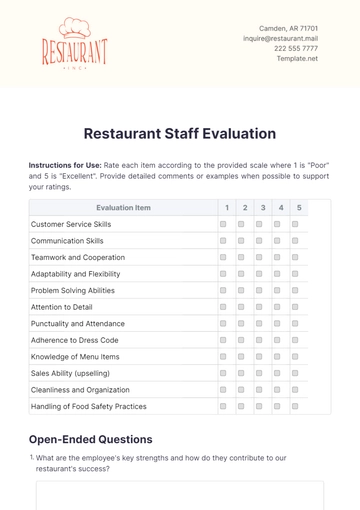
Employee performance evaluations reveal an overall satisfaction rating of 4 out of 5 among staff members. Training and development initiatives have contributed to improved service standards and teamwork. While employee turnover remained stable, we recognize the importance of ongoing staff training and recognition programs to foster a positive work environment and reduce turnover further.
VII. Menu Analysis
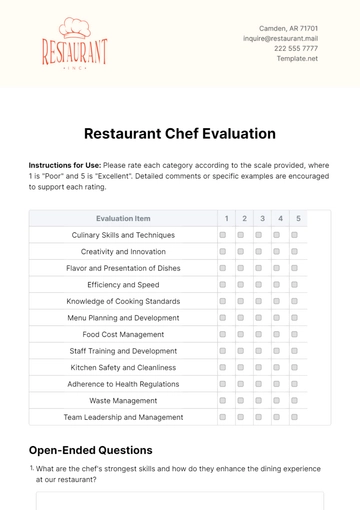
Analysis of menu item sales indicates strong performance for signature dishes such as the "Grilled Salmon" and "Homemade Pasta." However, certain items, particularly vegetarian options, have shown lower sales volume. We plan to conduct a menu overhaul to introduce new, innovative dishes while retaining customer favorites to cater to diverse dietary preferences and attract a wider customer base.
VIII. Recommendations and Action Plan
Based on the evaluation findings, we recommend the following actions for the upcoming year:
Increase menu variety to cater to diverse dietary preferences and attract a wider customer base.
Enhance staff training programs to maintain service excellence and reduce turnover.
Allocate marketing budget more effectively to maximize return on investment.
Implement operational efficiencies to streamline service and reduce wait times during peak hours.
IX. Conclusion
In conclusion, the [Year] Restaurant Annual Evaluation highlights our achievements and areas for improvement. By implementing the recommended action plan, we are confident in our ability to continue delivering exceptional dining experiences and achieve sustainable growth in the year ahead.
- 100% Customizable, free editor
- Access 1 Million+ Templates, photo’s & graphics
- Download or share as a template
- Click and replace photos, graphics, text, backgrounds
- Resize, crop, AI write & more
- Access advanced editor
Utilize the Restaurant Annual Evaluation Template from Template.net for a comprehensive assessment of your restaurant's performance. This editable and customizable template offers a user-friendly interface and AI Editor Tool, making it easy to input data and analyze key metrics. Streamline your evaluation process and gain valuable insights to optimize operations and enhance customer satisfaction.
