Financial Report Analysis
Prepared By: [Your Name] | Department: Finance
I. Executive Summary
The Executive Summary provides an overview of [Your Company Name]'s financial performance for the current fiscal year. The company has shown consistent revenue growth, but rising operational costs have impacted profitability. Liquidity remains strong, and the company is well-positioned to manage its short-term obligations. However, increasing long-term debt levels warrant attention. Recommendations include cost optimization and careful monitoring of financial risks.
II. Introduction
A. Background Information
[Your Company Name] is a leading multinational corporation in the technology sector, specializing in software development and digital services. The company has a diverse portfolio of products and services catering to various industries across the globe. This financial analysis aims to assess the company's performance and financial health, providing valuable insights for stakeholders.
Purpose of the Analysis: The analysis aims to evaluate [Your Company Name]'s financial statements and overall performance to provide stakeholders with a comprehensive understanding of the company’s financial health, guiding investment and management decisions.
B. Contact Information
Analyst: [Your Name]
Email: [Your Email]
Company: [Your Company Name]
III. Financial Statement Analysis
A. Balance Sheet Analysis
The balance sheet analysis reveals that [Your Company Name] has maintained a strong asset base, with total assets reaching $120,000 million, up from $110,000 million in the previous year. The company's total liabilities increased to $60,000 million from $55,000 million, reflecting a rise in long-term debt used to finance expansion activities. Shareholders' equity grew to $60,000 million, indicating strong equity capital.
Key Ratios:
Current Ratio: 1.75
Debt-to-Equity Ratio: 1.00
TABLE 1: Balance Sheet Analysis
Category | Current Year ($ millions) | Previous Year ($ millions) |
|---|---|---|
Total Assets | $120,000 | $110,000 |
Total Liabilities | $60,000 | $55,000 |
Shareholders' Equity | $60,000 | $55,000 |
B. Income Statement Analysis
The income statement analysis shows that [Your Company Name]'s total revenue for the year was $85,000 million, up from $80,000 million in the previous year. Despite this revenue growth, net income slightly decreased to $7,500 million from $8,000 million due to increased operational expenses and R&D costs.
Key Ratios:
Gross Profit Margin: 45.00%
Operating Margin: 15.00%
TABLE 2: Income Statement Analysis
Category | Current Year ($ millions) | Previous Year ($ millions) |
|---|---|---|
Total Revenue | $85,000 | $80,000 |
Cost of Goods Sold | $46,750 | $44,000 |
Net Income | $7,500 | $8,000 |
C. Cash Flow Statement Analysis
The cash flow statement analysis indicates strong operating cash flow, with $15,000 million generated, up from $14,000 million the previous year. However, significant cash outflows for investing activities, totaling $10,000 million, reflect the company’s continued expansion efforts. Financing cash flows were positive, at $4,000 million, due to new debt issuance.
Key Ratios:
Cash Flow Coverage Ratio: 2.5
Cash Conversion Cycle: 45 days
TABLE 3: Cash Flow Statement Analysis
Category | Current Year ($ millions) | Previous Year ($ millions) |
|---|---|---|
Operating Cash Flow | $15,000 | $14,000 |
Investing Cash Flow | $(10,000) | $(9,000) |
Financing Cash Flow | $4,000 | $2,000 |
Net Cash Flow | $9,000 | $7,000 |
IV. Financial Performance Assessment
A. Profitability Analysis
[Your Company Name] maintained a Return on Assets (ROA) of 6.25% and a Return on Equity (ROE) of 12.50%. The profitability was driven by strong revenue growth, though it was offset by rising costs, particularly in R&D and SG&A expenses. The decline in net income suggests a need for cost-control measures.
B. Liquidity Analysis
The current ratio of 1.75 and a quick ratio of 1.50 indicates that [Your Company Name] is in a strong position to meet its short-term obligations. The company's liquidity is sufficient to cover its current liabilities without having to rely heavily on inventory sales.
C. Solvency Analysis
[Your Company Name]'s solvency metrics are solid, with a debt-to-equity ratio of 1.00 and an interest coverage ratio of 4.50. These figures suggest that the company has a balanced approach to leveraging its assets while maintaining the ability to meet its long-term financial commitments.
D. Efficiency Analysis
The efficiency analysis highlights that [Your Company Name] has an asset turnover ratio of 0.71 and an inventory turnover ratio of 5.5. This indicates effective utilization of assets to generate revenue, although there is room for improvement in inventory management to enhance overall efficiency.
V. Risk Assessment
A. Financial Risk Analysis
Potential financial risks for [Your Company Name] include increasing debt levels and the associated interest expenses. The company’s strategy of using debt to finance expansion needs to be carefully managed to avoid over-leverage. Continuous monitoring of cash flow is recommended to ensure the company can meet its obligations.
B. Market Risk Analysis
Market risks include heightened competition in the technology sector and volatility in global markets. [Your Company Name] must continue to innovate and adapt to changing market conditions to mitigate the impact of these risks. Additionally, exchange rate fluctuations could pose a risk to the company’s international revenues.
VI. Conclusion and Recommendations
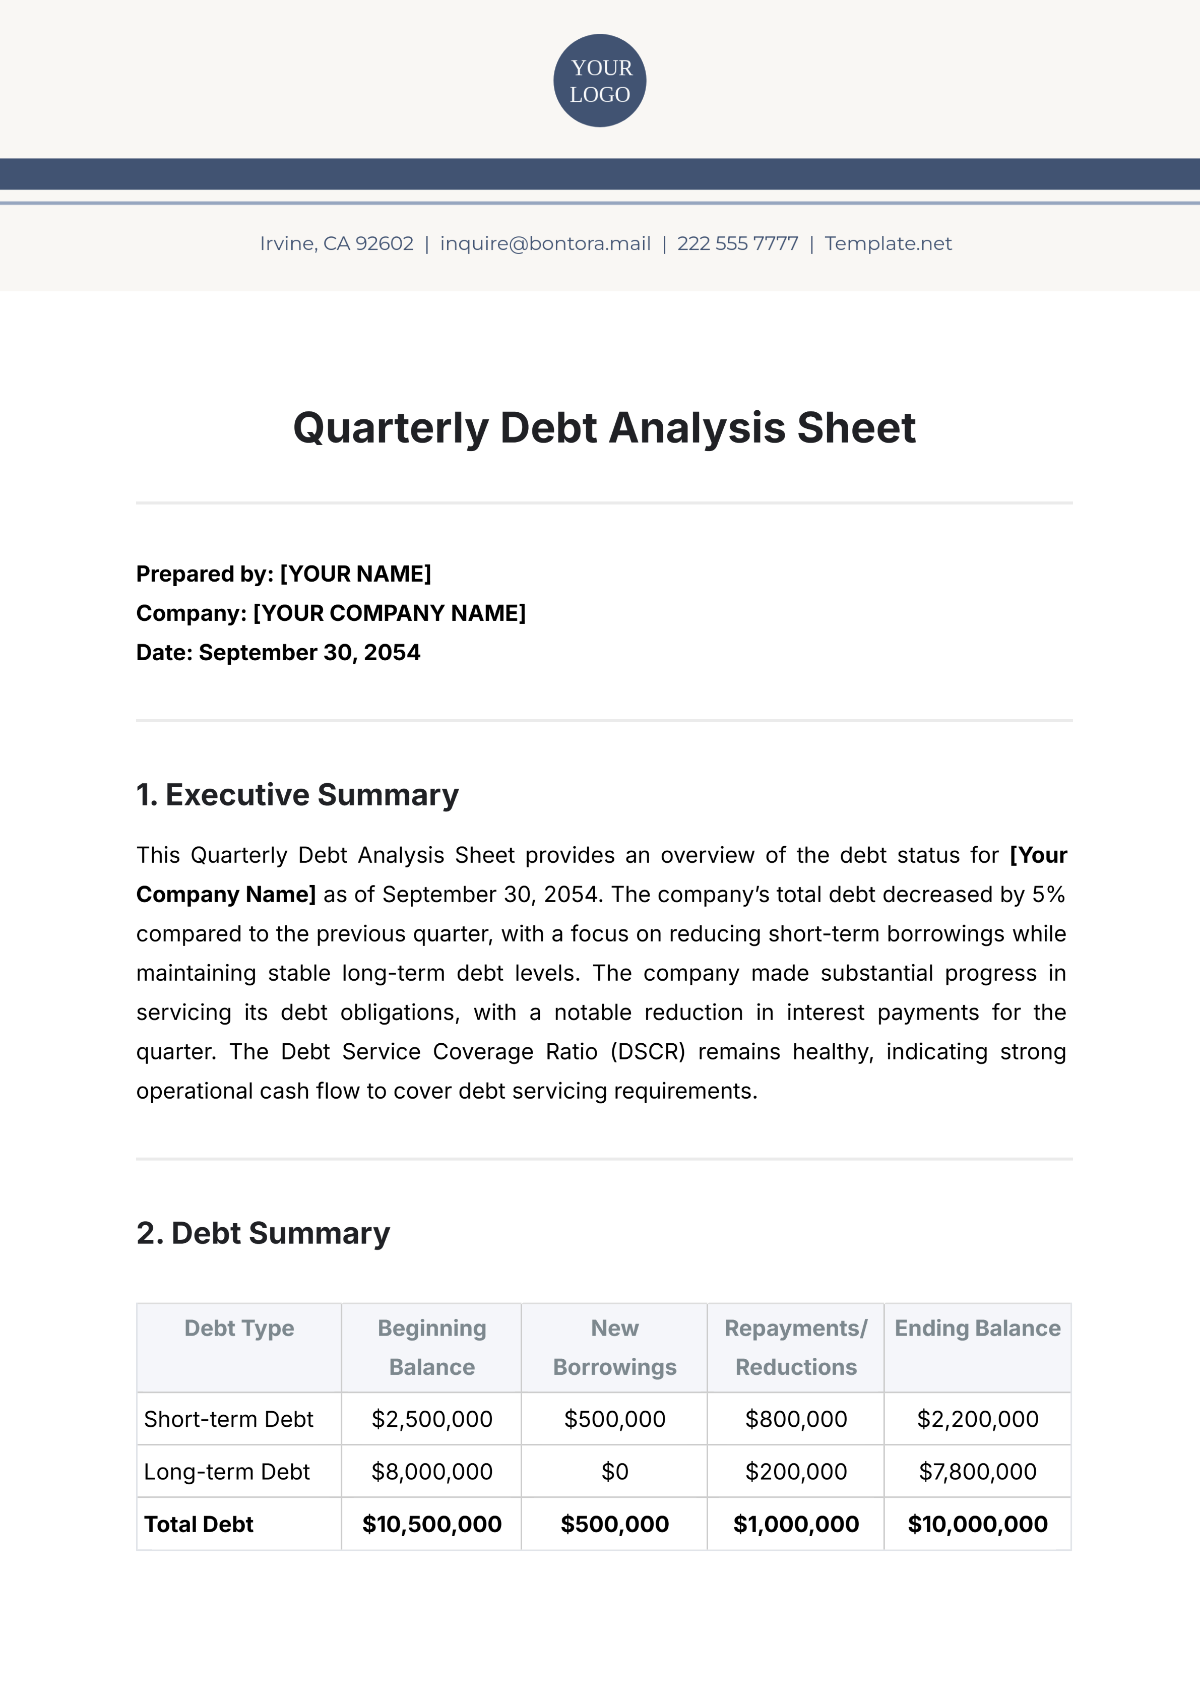
In conclusion, [Your Company Name] has demonstrated a strong financial position with solid revenue growth and adequate liquidity. However, rising costs and increasing debt levels suggest the need for strategic adjustments. The company should focus on cost management, optimize cash flow, and continuously monitor financial and market risks to sustain long-term growth.
Recommendations:
Cost Optimization: Implement strategies to reduce operational costs and improve profit margins.
Debt Management: Regularly assess and manage debt levels to ensure financial flexibility.
Innovation Investment: Continue investing in R&D to maintain a competitive edge in the market.
Risk Mitigation: Develop and execute risk management strategies to address potential financial and market challenges.
This Financial Report Analysis provides a thorough evaluation of [Your Company Name]'s financial health, offering insights and recommendations to guide stakeholders in their decision-making processes.


