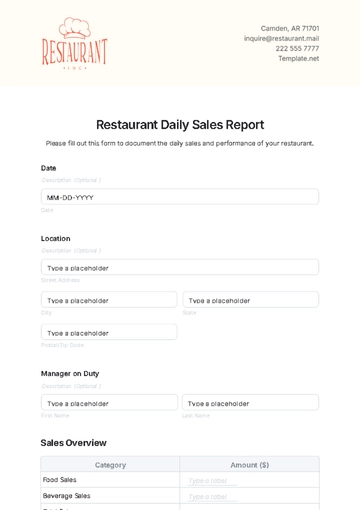
Free Restaurant Daily Sales Report
I. Overview
A. Introduction
Purpose
The purpose of this Daily Sales Report is to provide a comprehensive overview of the sales performance at [Your Company Name] on a daily basis. It aims to track and analyze sales data to make informed business decisions and optimize operations, including inventory management, staffing, and marketing strategies.
Scope
This report covers all sales transactions, including food, beverages, and other items, recorded within the specified reporting period. It includes both in-house dining sales as well as any sales from delivery or takeout orders.
Audience
The audience for this report includes management, stakeholders, and relevant departments involved in sales and operations. This may include the restaurant owner, general manager, kitchen staff, servers, and finance department.
II. Daily Sales Summary
Date: [Date: May 16, 2050]
Total Sales: [$10,500]
Breakdown of Sales:
Category | Sales Amount |
|---|---|
Food | [$7,200] |
Beverage | [$2,500] |
Other | [$800] |
This table provides a breakdown of sales by category for the reporting period. It includes sales figures for food, beverages, and other miscellaneous items such as merchandise or service charges.
III. Sales Analysis
A. Comparison with Previous Day:
Total Sales Increase/Decrease: Compared to the previous day, the total sales have increased by [+/- $500]. This indicates the day-to-day fluctuation in sales performance.
Percentage Change: The percentage change in total sales compared to the previous day is [+/- 5%]. This metric helps assess the magnitude of the change relative to the overall sales volume.
B. Comparison with Same Day Last Week:
Total Sales Increase/Decrease: In comparison with the same day last week, the total sales have increased/decreased by [+/- $1,200]. This comparison provides insights into weekly sales patterns and trends.
Percentage Change: The percentage change in total sales compared to the same day last week is [+/- 12%]. Analyzing week-over-week performance helps identify seasonal variations or shifts in consumer behavior.
C. Comparison with Same Day Last Year:
Total Sales Increase/Decrease: Compared to the sales figure on the same day last year, the total sales have increased/decreased by [+/- $800]. This comparison offers insights into year-over-year growth or decline in sales.
Percentage Change: The percentage change in total sales compared to the same day last year is [+/- 8%]. Understanding year-over-year performance helps evaluate the restaurant's overall growth trajectory and market dynamics.
IV. Sales by Category
A. Food Sales:
This section provides a detailed breakdown of food sales by category, highlighting the performance of different menu items. It includes:
Appetizers: Sales amounting to [$1,500], contributing [14%] to total sales.
Entrees: Sales totaling [$3,500], representing [33%] of total sales.
Desserts: Sales totaling [$1,200], accounting for [11%] of total sales.
Specials: Sales amounting to [$1,000], contributing [9%] to total sales.
Others: Sales totaling [$1,000], representing [9%] of total sales. This category may include items like side dishes or add-ons.
Category | Sales Amount | Percentage of Total Sales |
|---|---|---|
Appetizers | [$1,500] | [14%] |
Entrees | [$3,500] | [33%] |
Desserts | [$1,200] | [11%] |
Specials | [$1,000] | [9%] |
Others | [$1,000] | [9%] |
B. Beverage Sales:
This section provides insights into beverage sales performance, distinguishing between alcoholic and non-alcoholic beverages. It includes:
Alcoholic: Sales amounting to [$1,800], comprising [72%] of total beverage sales.
Non-Alcoholic: Sales totaling [$700], representing [28%] of total beverage sales.
Category | Sales Amount | Percentage of Total Sales |
|---|---|---|
Alcoholic | [$1,800] | [72%] |
Non-Alcoholic | [$700] | [28%] |
V. Sales by Payment Method
Cash: [$5,000]
Credit Card: [$4,000]
Online Payment: [$1,500]
This is a detailed breakdown of sales by different payment methods used by customers to settle their bills. It offers insights into the preferred payment options among patrons, allowing for strategic decision-making regarding payment processing systems and customer convenience initiatives. Analyzing sales by payment method is crucial for identifying trends, understanding customer behavior, and optimizing the payment experience.
VI. Special Notes
A. Promotions/Discounts Applied:
Promotion/Discount Type: "Weekend Brunch Special"
Discount Amount: [$100]
B. Impact on Sales:
The Weekend Brunch Special, offering discounted brunch combos, generated increased foot traffic during the brunch hours, resulting in a [+/- $500] boost in total sales compared to typical weekend mornings.
C. Issues/Challenges Faced:
Description of Issue: Technical malfunction in the point-of-sale (POS) system caused intermittent delays in order processing during the lunch rush.
Impact on Sales: Several orders were delayed, leading to longer wait times for customers and potential loss of revenue due to reduced table turnover.
Action Taken: The technical support team was immediately notified, and temporary workarounds were implemented to expedite order processing. Additionally, affected customers were offered complimentary desserts as a gesture of goodwill.
By documenting promotions, discounts, and operational challenges, this section provides valuable insights into the external and internal factors influencing daily sales performance. This information enables management to evaluate the effectiveness of promotional strategies, address operational inefficiencies, and enhance the overall customer experience.
VII. Recommendations
A. Opportunities for Improvement:
Enhance Online Ordering Experience: Invest in upgrading the online ordering platform to improve user interface and streamline order processing, reducing the likelihood of technical glitches and checkout errors.
Expand Promotional Offerings: Introduce targeted promotions or loyalty programs to incentivize repeat visits and encourage customer retention.
Optimize Menu Selection: Analyze sales data to identify underperforming menu items and consider replacing them with more popular or profitable alternatives to maximize revenue generation.
B. Future Strategies:
Diversify Revenue Streams: Explore opportunities to expand revenue streams by offering catering services, hosting private events, or partnering with local food delivery platforms to reach a wider customer base.
Staff Training and Development: Invest in staff training programs to enhance service quality, product knowledge, and upselling techniques, ultimately improving customer satisfaction and increasing sales.
Community Engagement Initiatives: Engage with the local community through charity events, sponsorships, or collaborations with nearby businesses to foster goodwill and attract new customers.
VIII. Conclusion
A. Summary of Key Insights:
Overall, the daily sales report for [May 16, 2050] reflects steady performance, with total sales reaching [$10,500].
Food sales continue to be the primary revenue driver, comprising [68%] of total sales, while beverage sales contribute [24%].
The analysis of sales by category reveals that appetizers and entrees are popular menu choices, accounting for [47%] of total food sales.
Credit card payments remain the preferred payment method among customers, with [$4,000] in sales recorded through credit card transactions.
B. Action Plan:
Address Technical Issues: Prioritize resolving technical issues with the online ordering system to ensure seamless customer experiences and prevent revenue loss due to transaction delays.
Review Menu Performance: Conduct a comprehensive menu analysis to identify and refresh underperforming items, optimizing menu offerings to align with customer preferences and maximize profitability.
Invest in Staff Development: Allocate resources towards staff training programs to enhance service quality, product knowledge, and upselling techniques, fostering a culture of excellence and driving sales growth.
IX. Prepared by
Name: [Your Name]
Position: [Your Position]
Date: [May 16, 2050]
- 100% Customizable, free editor
- Access 1 Million+ Templates, photo’s & graphics
- Download or share as a template
- Click and replace photos, graphics, text, backgrounds
- Resize, crop, AI write & more
- Access advanced editor
Track daily revenue with Template.net's Restaurant Daily Sales Report Template. This customizable document offers a concise format for recording and analyzing daily sales figures. Ensure accurate and timely financial oversight. Editable in our Ai Editor Tool for seamless customization to fit your restaurant's daily financial tracking needs and operational workflow.
You may also like
- Sales Report
- Daily Report
- Project Report
- Business Report
- Weekly Report
- Incident Report
- Annual Report
- Report Layout
- Report Design
- Progress Report
- Marketing Report
- Company Report
- Monthly Report
- Audit Report
- Status Report
- School Report
- Reports Hr
- Management Report
- Project Status Report
- Handover Report
- Health And Safety Report
- Restaurant Report
- Construction Report
- Research Report
- Evaluation Report
- Investigation Report
- Employee Report
- Advertising Report
- Weekly Status Report
- Project Management Report
- Finance Report
- Service Report
- Technical Report
- Meeting Report
- Quarterly Report
- Inspection Report
- Medical Report
- Test Report
- Summary Report
- Inventory Report
- Valuation Report
- Operations Report
- Payroll Report
- Training Report
- Job Report
- Case Report
- Performance Report
- Board Report
- Internal Audit Report
- Student Report
- Monthly Management Report
- Small Business Report
- Accident Report
- Call Center Report
- Activity Report
- IT and Software Report
- Internship Report
- Visit Report
- Product Report
- Book Report
- Property Report
- Recruitment Report
- University Report
- Event Report
- SEO Report
- Conference Report
- Narrative Report
- Nursing Home Report
- Preschool Report
- Call Report
- Customer Report
- Employee Incident Report
- Accomplishment Report
- Social Media Report
- Work From Home Report
- Security Report
- Damage Report
- Quality Report
- Internal Report
- Nurse Report
- Real Estate Report
- Hotel Report
- Equipment Report
- Credit Report
- Field Report
- Non Profit Report
- Maintenance Report
- News Report
- Survey Report
- Executive Report
- Law Firm Report
- Advertising Agency Report
- Interior Design Report
- Travel Agency Report
- Stock Report
- Salon Report
- Bug Report
- Workplace Report
- Action Report
- Investor Report
- Cleaning Services Report
- Consulting Report
- Freelancer Report
- Site Visit Report
- Trip Report
- Classroom Observation Report
- Vehicle Report
- Final Report
- Software Report
