Filter by:

Restaurant Inventory Report

I. Executive Summary

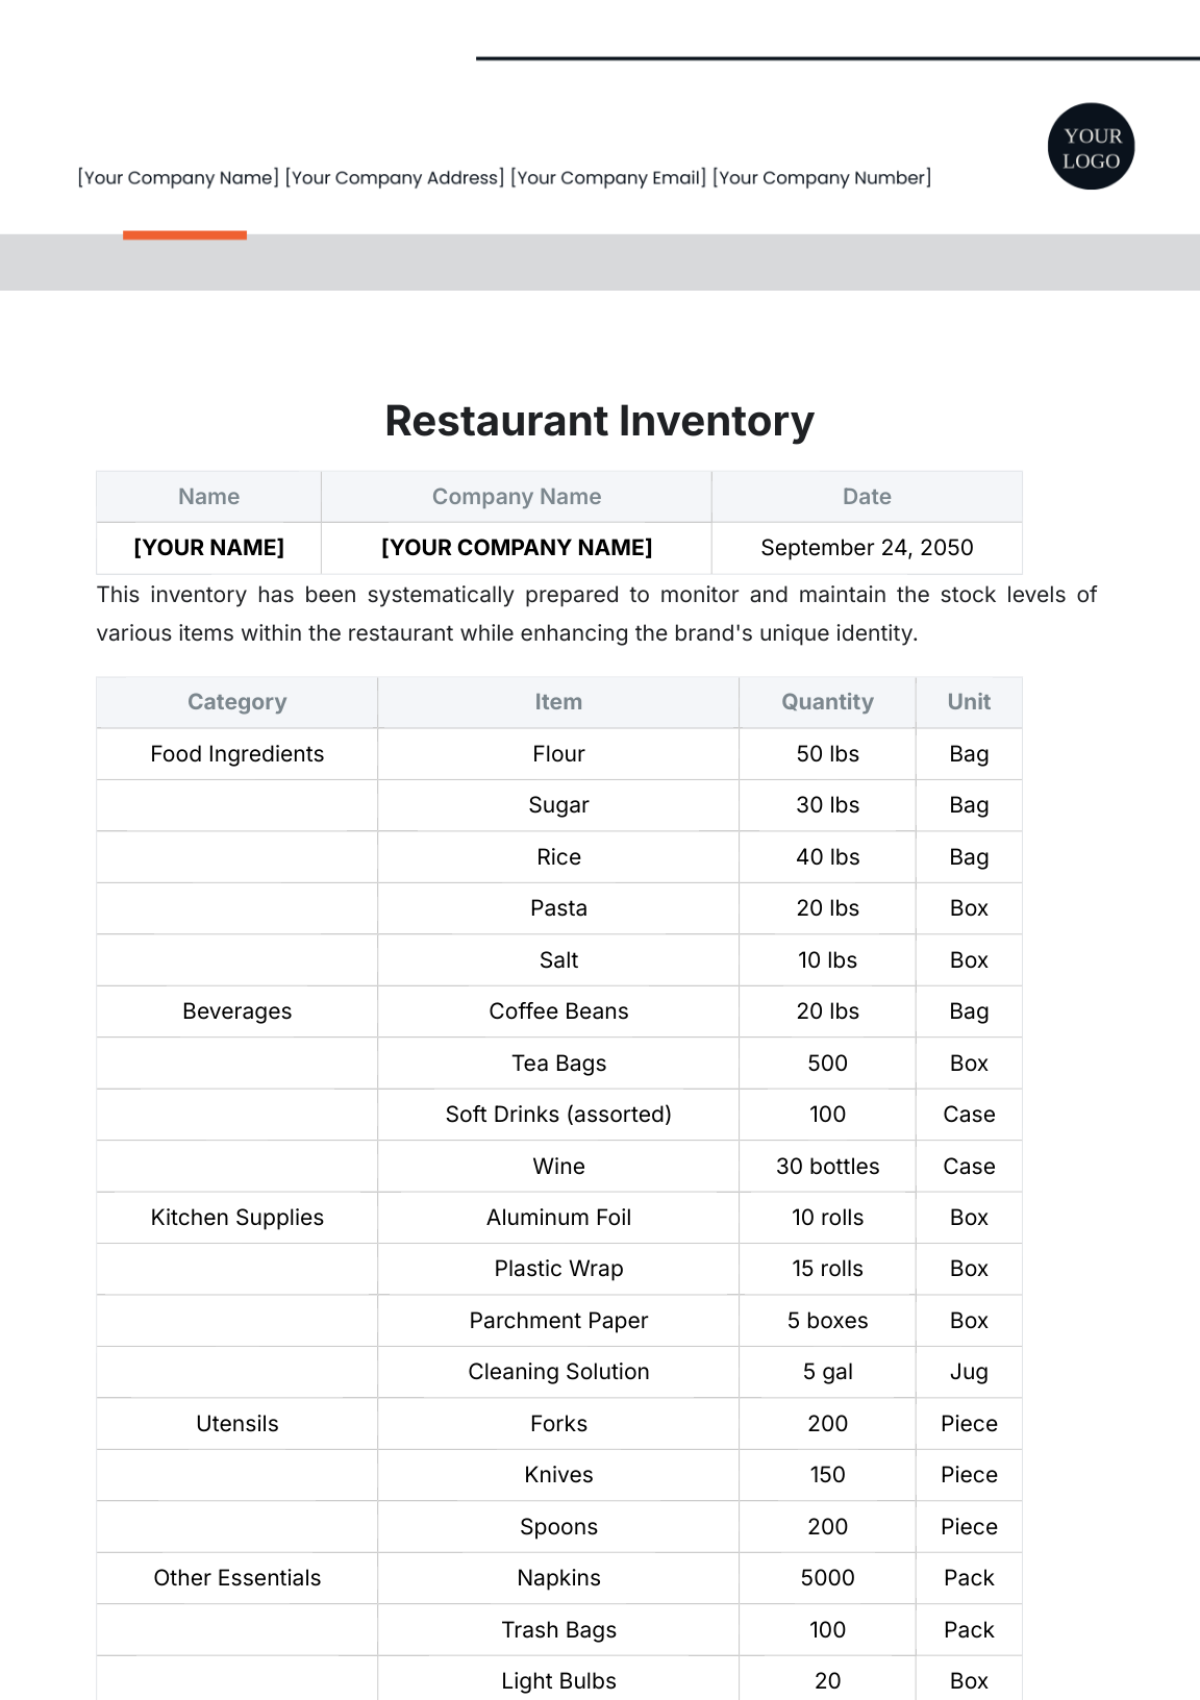
This Restaurant Inventory Report provides a comprehensive overview of the inventory status for [Your Company Name] for the month ending May 31, 2050. The report includes detailed data on stock levels, usage rates, and reorder requirements. The aim is to ensure optimal inventory levels, reduce waste, and maintain cost efficiency. This report will help in identifying areas for improvement in inventory management, thus aiding in better decision-making and resource allocation.

II. Inventory Overview

A. Inventory Valuation

The total value of the inventory on hand as of May 31, 2050, is [$50,000]. This includes all food and beverage items, categorized as follows:

  • Perishables: [$20,000] – These include items such as fresh vegetables, dairy products, and meats, which have a shorter shelf life and need to be replenished more frequently.

  • Non-perishables: [$15,000] – These are items like rice, pasta, and canned goods that have a longer shelf life and can be stocked in larger quantities.

  • Beverages: [$10,000] – This category includes bottled water, wine, beer, and other drink items that are essential for restaurant operations.

  • Supplies: [$5,000] – Supplies include napkins, cleaning supplies, and utensils necessary for the daily functioning of the restaurant.

The valuation provides a snapshot of the restaurant’s investment in inventory, highlighting areas where costs are concentrated.

B. Stock Levels

The current stock levels are adequate to meet the operational needs for the next month. However, some items are approaching their reorder points. It is crucial to monitor these items closely to prevent stockouts, which could disrupt the restaurant's operations. Regular inventory checks and timely reorders are essential to maintaining a smooth workflow and customer satisfaction.

III. Detailed Inventory Data

A. Food Items

1. Perishables

Item

Unit Price

Quantity on Hand

Total Value

Reorder Point

Notes

Fresh Vegetables

$2.00/lb

200 lbs

$400

100 lbs

Reorder 50 lbs weekly to ensure freshness and reduce spoilage.

Dairy Products

$3.00/unit

100 units

$300

50 units

Reorder 25 units weekly to keep up with high demand, especially on weekends.

Meat (Chicken)

$5.00/lb

300 lbs

$1,500

150 lbs

Reorder 75 lbs weekly to meet the needs of popular menu items.

Perishables need to be closely monitored due to their short shelf life. Regular usage tracking helps in making accurate reorder decisions to maintain freshness and quality.
2. Non-perishables

Item

Unit Price

Quantity on Hand

Total Value

Reorder Point

Notes

Rice

$1.00/lb

500 lbs

$500

200 lbs

Reorder 100 lbs monthly to keep up with steady usage patterns.

Pasta

$1.50/lb

300 lbs

$450

100 lbs

Reorder 50 lbs monthly, considering the consistent demand in various dishes.

Canned Tomatoes

$2.00/can

250 cans

$500

100 cans

Reorder 50 cans bi-monthly to ensure a steady supply for sauces and bases.

Non-perishables are easier to manage due to their longer shelf life. However, it is still essential to monitor stock levels to avoid running out of key ingredients.

B. Beverages

Item

Unit Price

Quantity on Hand

Total Value

Reorder Point

Notes

Bottled Water

$1.00/bottle

500 bottles

$500

200 bottles

Reorder 100 bottles monthly to meet the regular demand from customers.

Wine

$10.00/bottle

100 bottles

$1,000

50 bottles

Reorder 25 bottles monthly, considering the moderate to high demand.

Beer

$2.00/can

300 cans

$600

150 cans

Reorder 75 cans monthly to ensure a consistent supply for the bar.

Beverages are critical for customer satisfaction and revenue. Maintaining optimal stock levels ensures that popular drinks are always available.

C. Supplies

Item

Unit Price

Quantity on Hand

Total Value

Reorder Point

Notes

Napkins

$0.10/pc

5,000 pcs

$500

2,000 pcs

Reorder 1,000 pcs monthly to maintain a sufficient supply for dining services.

Cleaning Supplies

$5.00/unit

100 units

$500

50 units

Reorder 25 units monthly to ensure the restaurant maintains hygiene standards.

Utensils

$0.50/pc

2,000 pcs

$1,000

1,000 pcs

Reorder 500 pcs quarterly, taking into account breakage and loss.

Supplies are essential for daily operations, and it is important to keep them well-stocked to avoid any disruption in service.

IV. Inventory Usage Analysis

A. Monthly Usage Rates

The table below summarizes the usage rates of major inventory items for the month of May 2050:

Item

Quantity Used

Average Daily Usage

Notes

Fresh Vegetables

150 lbs

5 lbs/day

Consistent usage throughout the month, reflecting steady customer orders.

Dairy Products

80 units

2.67 units/day

Peaks during weekends due to higher footfall.

Meat (Chicken)

200 lbs

6.67 lbs/day

Increased demand on weekends, particularly for popular dishes.

Rice

300 lbs

10 lbs/day

High usage during lunch hours, reflecting its inclusion in many meals.

Bottled Water

300 bottles

10 bottles/day

Steady consumption, indicating constant demand.

Napkins

2,000 pcs

66.67 pcs/day

High usage during dinner hours, requiring frequent restocking.

Understanding usage rates helps in planning inventory purchases and managing stock levels efficiently.
B. Cost Analysis
Item

Cost This Month

Previous Month Cost

Percentage Change

Notes

Fresh Vegetables

$300

$350

-14%

Seasonal price drop has reduced costs this month.

Dairy Products

$240

$200

+20%

Increased supplier prices due to higher demand.

Meat (Chicken)

$1,000

$900

+11%

Higher demand on weekends has driven up costs.

Rice

$300

$280

+7%

Slight increase in consumption, leading to higher costs.

Cost analysis helps in understanding the financial impact of inventory usage and identifying trends in pricing.

V. Reorder Recommendations

A. Items to Reorder

Item

Quantity to Reorder

Supplier

Lead Time

Notes

Fresh Vegetables

50 lbs

[Local Farm Suppliers]

2 days

Weekly delivery ensures fresh produce.

Dairy Products

25 units

[Dairy Co.]

3 days

Weekly delivery to keep up with high demand, especially on weekends.

Meat (Chicken)

75 lbs

[Butcher Shop]

1 day

Twice weekly delivery to ensure availability for popular dishes.

Bottled Water

100 bottles

[Beverage Distributors]

5 days

Monthly delivery to meet the regular demand.

Timely reorders are crucial for maintaining stock levels and ensuring that all menu items are available to customers.

B. Inventory Adjustments

To optimize inventory levels and reduce waste, consider the following adjustments:

  • Reduce order quantities for perishables: Given the high turnover, ordering smaller quantities more frequently can minimize spoilage. This approach will also ensure that the restaurant always has fresh ingredients on hand.

  • Monitor usage patterns: Track daily usage more closely to adjust order sizes in real-time. This will help in aligning stock levels with actual demand, reducing excess inventory.

  • Supplier negotiations: Negotiate with suppliers for better prices or discounts on bulk purchases. Long-term agreements or volume-based discounts can significantly reduce costs.

Implementing these adjustments can lead to more efficient inventory management and cost savings.

VI. Conclusion

The inventory levels for [Your Company Name] are generally well-managed, with some areas needing adjustments to improve cost efficiency and reduce waste. The reorder recommendations and adjustments suggested will help maintain optimal stock levels and support operational needs effectively. Regular monitoring and strategic planning are essential to ensure that inventory management contributes to the overall success of the restaurant.

Prepared by:

[Your Name]
Inventory Manager
[Your Company Name]
[Your Company Email]

Restaurant Templates @ Template.net