Quarterly Expense Report
Prepared by: [YOUR NAME]
Date: [DATE]
I. Introduction
The following report outlines the corporate expenses for [YOUR COMPANY NAME] over the second quarter of the year 2050. This document aims to provide a detailed account of the company's financial activities, ensuring transparency and enabling informed decision-making by the management team.
II. Summary of Expenses
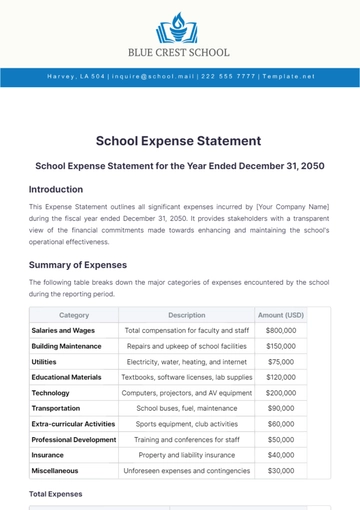
Category | Amount (USD) | Percentage of Total |
|---|
Personnel Expenses | $1,200,000 | 40% |
Marketing | $600,000 | 20% |
Operations | $900,000 | 30% |
Travel | $200,000 | 6.67% |
Miscellaneous | $100,000 | 3.33% |
Total | $3,000,000 | 100% |
III. Detailed Expense Breakdown
Expense Category | Subcategory | Amount (USD) | Description | Percentage of Category |
|---|
Personnel Expenses | Salaries
Benefits | $1,000,000
$200,000 | Salaries for all employees
Health, dental, and retirement benefits | 83.33%
16.67% |
Marketing | Digital Marketing
Print Advertising | $400,000
$200,000 | Online ads, social media, SEO, and email
Flyers, brochures, and magazine ads | 66.67%
33.33% |
Operations | Rent
Utilities
Supplies | $400,000
$300,000
$200,000 | Office and warehouse rent
Electricity, water, and internet
Office and operational supplies | 44.44%
33.33%
22.22% |
Travel | Domestic Travel
International Travel | $150,000
$50,000 | Business trips within the country
Business trips abroad | 75%
25% |
Miscellaneous | Other Expenses | $100,000 | Unforeseen expenses and miscellaneous items | 100% |
IV. Comparison with Budget
Category | Budgeted Amount (USD) | Actual Amount (USD) | Variance (USD) | Variance (%) |
|---|
Personnel Expenses | $1,250,000 | $1,200,000 | -$50,000 | -4% |
Marketing | $700,000 | $600,000 | -$100,000 | -14.29% |
Operations | $850,000 | $900,000 | $50,000 | 5.88% |
Travel | $250,000 | $200,000 | -$50,000 | -20% |
Miscellaneous | $150,000 | $100,000 | -$50,000 | -33.33% |
Total | $3,200,000 | $3,000,000 | -$200,000 | -6.25% |
V. Variance Analysis
Personnel Expenses: Slightly under budget due to delays in hiring new staff.
Marketing: Significant savings achieved in digital marketing campaigns.
Operations: Slightly over budget due to unexpected maintenance costs.
Travel: Under budget due to reduced international travel.
Miscellaneous: Under budget due to stringent cost control measures.
VI. Future Projections
Based on the current trends and the financial performance in Q2, the projections for Q3 include a slight increase in marketing expenditures due to planned campaigns and a stable trend in operational costs. Personnel expenses are expected to rise as new hires are onboarded.
Category | Projected Amount (USD) |
|---|
Personnel Expenses | $1,300,000 |
Marketing | $700,000 |
Operations | $900,000 |
Travel | $250,000 |
Miscellaneous | $150,000 |
Total | $3,300,000 |
VII. Conclusion
In conclusion, [YOUR COMPANY NAME] has managed to keep overall expenses within the budget for Q2 2050, achieving savings in several key areas. Moving forward, the focus will be on maintaining cost control while supporting strategic initiatives, particularly in marketing and personnel growth.
Report Templates @ Template.net
