Free Annual Income Expense Report
I. Introduction
This Annual Income Expense Report has been prepared by [YOUR COMPANY NAME], a leading financial services firm specializing in comprehensive financial analysis and consulting services. Our team of experts has meticulously compiled and analyzed the financial data to provide stakeholders with a comprehensive overview of the company's performance for the fiscal year ending December 31, 2050.
This report aims to offer transparency, insight, and guidance to our stakeholders, including shareholders, investors, creditors, and regulatory bodies, enabling them to make informed decisions regarding their engagement with Bold Financial Solutions.
II. Executive Summary
In the fiscal year 2050, [YOUR COMPANY NAME] continued to demonstrate resilience and growth amidst challenging market conditions. Key highlights include:
Metric | Amount |
|---|---|
Total Revenue | $15,250,000 |
Net Profit | $3,750,000 |
Total Assets | $27,500,000 |
Total Liabilities | $9,500,000 |
III. Financial Analysis
A. Income Statement
Metric | Amount |
|---|---|
Revenue | $15,250,000 |
Cost of Goods Sold | $7,500,000 |
Gross Profit | $7,750,000 |
B. Balance Sheet
Assets
Asset Category | Amount |
|---|---|
Current Assets | $10,500,000 |
Fixed Assets | $17,000,000 |
Total Assets | $27,500,000 |
Liabilities and Equity
Liability Category | Amount |
|---|---|
Current Liabilities | $5,500,000 |
Long-term Liabilities | $4,000,000 |
Total Liabilities | $9,500,000 |
Shareholders' Equity | $18,000,000 |
C. Cash Flow Statement
Cash Flow Category | Amount |
|---|---|
Operating Activities | $5,000,000 |
Investing Activities | -$2,500,000 |
Financing Activities | $2,250,000 |
Net Cash Flow | $4,750,000 |
IV. Credit Analysis
A. Creditworthiness Assessment
Ratio | Value |
|---|---|
Debt-to-Equity Ratio | 0.53 |
Interest Coverage Ratio | 4.25 |
Current Ratio | 1.91 |
Quick Ratio | 1.64 |
B. Financial Health Indicators
Profitability
Metric | Value |
|---|---|
Gross Profit Margin | 50.82% |
Net Profit Margin | 24.59% |
Liquidity
Metric | Value |
|---|---|
Current Ratio | 1.91 |
Quick Ratio | 1.64 |
Solvency
Metric | Value |
|---|---|
Debt-to-Equity Ratio | 0.53 |
Interest Coverage Ratio | 4.25 |
V. Conclusion
Despite economic uncertainties, [YOUR COMPANY NAME] remains committed to delivering exceptional value to its stakeholders through prudent financial management and strategic decision-making. As we look ahead, we are confident in our ability to navigate challenges, capitalize on opportunities, and sustain long-term growth. We extend our gratitude to our stakeholders for their continued trust and support, and we remain dedicated to upholding the highest standards of integrity, transparency, and excellence in all our endeavors.
- 100% Customizable, free editor
- Access 1 Million+ Templates, photo’s & graphics
- Download or share as a template
- Click and replace photos, graphics, text, backgrounds
- Resize, crop, AI write & more
- Access advanced editor
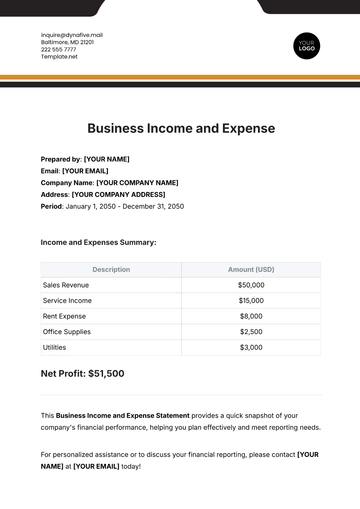
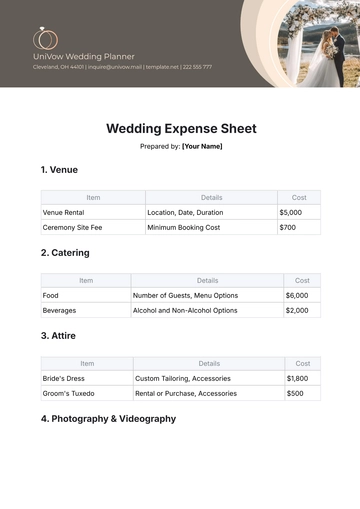
Stay organized with our Annual Income Expense Report Template from Template.net. This fully customizable and editable template simplifies financial tracking for your business. Effortlessly manage your income and expenses with our AI Editor Tool, ensuring accurate and efficient reporting. Perfect for professionals seeking a reliable financial overview, this template streamlines your accounting process.
