Free Board Meeting Financial Report
Date: January 15, 2050
I. Executive Summary
The past quarter has seen significant developments in our financial performance, driven by both internal strategies and external market conditions. This report provides an in-depth review of our revenue streams, expenses, and net profits.
Key Highlights
Total revenue increased by 12% compared to the previous quarter.
Operational expenses were reduced by 8% due to optimized processes.
Net profit margins improved from 15% to 18%.
II. Revenue Analysis
Quarterly Revenue Breakdown
Month | Revenue (in millions) |
|---|---|
October 2050 | $12M |
November 2050 | $13M |
December 2050 | $15M |
Revenue by Segment
[Product A] | $20M |
[Product B] | $10M |
[Service C] | $10M |
III. Expense Analysis
Quarterly Expense Breakdown
Category | Expenses (in millions) |
|---|---|
Research and Development | $5M |
Marketing | $3M |
Operations | $4M |
General and Administrative | $2M |
Cost Saving Initiatives
Implemented energy-efficient systems reducing utility costs by 10%.
Negotiated bulk purchasing agreements saving $1M annually.
IV. Profit Analysis
Quarterly Profit Performance
Metric | Value (in millions) |
|---|---|
Gross Profit | $24M |
Net Profit | $10M |
Net Profit Margin | 18% |
V. Future Outlook
Projected Growth
Based on current market trends and our strategic initiatives, we project a continuous growth in both revenue and net profit margins over the next quarter.
Upcoming Initiatives
Launch of [Product D], expected to generate an additional $5M in revenue.
Expansion into new markets in Asia and Europe.
Prepared by: [Your Name]
Email: [Your Email]
- 100% Customizable, free editor
- Access 1 Million+ Templates, photo’s & graphics
- Download or share as a template
- Click and replace photos, graphics, text, backgrounds
- Resize, crop, AI write & more
- Access advanced editor
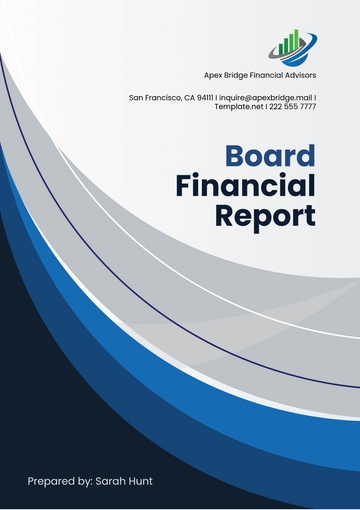
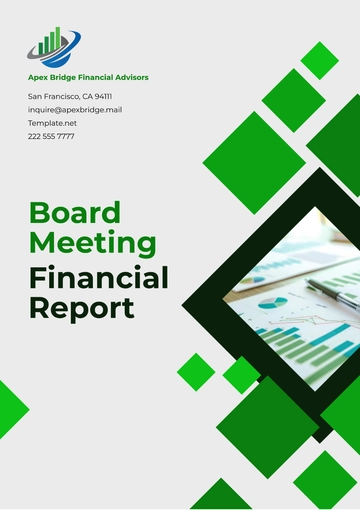
The Board Meeting Financial Report Template from Template.net is an essential resource for presenting financial information to board members. It includes sections for revenue, expenses, budget variances, and financial projections, ensuring that all key aspects of the organization's financial status are covered. The template is customizable and printable, allowing for easy adaptation to specific needs.
You may also like
- Sales Report
- Daily Report
- Project Report
- Business Report
- Weekly Report
- Incident Report
- Annual Report
- Report Layout
- Report Design
- Progress Report
- Marketing Report
- Company Report
- Monthly Report
- Audit Report
- Status Report
- School Report
- Reports Hr
- Management Report
- Project Status Report
- Handover Report
- Health And Safety Report
- Restaurant Report
- Construction Report
- Research Report
- Evaluation Report
- Investigation Report
- Employee Report
- Advertising Report
- Weekly Status Report
- Project Management Report
- Finance Report
- Service Report
- Technical Report
- Meeting Report
- Quarterly Report
- Inspection Report
- Medical Report
- Test Report
- Summary Report
- Inventory Report
- Valuation Report
- Operations Report
- Payroll Report
- Training Report
- Job Report
- Case Report
- Performance Report
- Board Report
- Internal Audit Report
- Student Report
- Monthly Management Report
- Small Business Report
- Accident Report
- Call Center Report
- Activity Report
- IT and Software Report
- Internship Report
- Visit Report
- Product Report
- Book Report
- Property Report
- Recruitment Report
- University Report
- Event Report
- SEO Report
- Conference Report
- Narrative Report
- Nursing Home Report
- Preschool Report
- Call Report
- Customer Report
- Employee Incident Report
- Accomplishment Report
- Social Media Report
- Work From Home Report
- Security Report
- Damage Report
- Quality Report
- Internal Report
- Nurse Report
- Real Estate Report
- Hotel Report
- Equipment Report
- Credit Report
- Field Report
- Non Profit Report
- Maintenance Report
- News Report
- Survey Report
- Executive Report
- Law Firm Report
- Advertising Agency Report
- Interior Design Report
- Travel Agency Report
- Stock Report
- Salon Report
- Bug Report
- Workplace Report
- Action Report
- Investor Report
- Cleaning Services Report
- Consulting Report
- Freelancer Report
- Site Visit Report
- Trip Report
- Classroom Observation Report
- Vehicle Report
- Final Report
- Software Report
