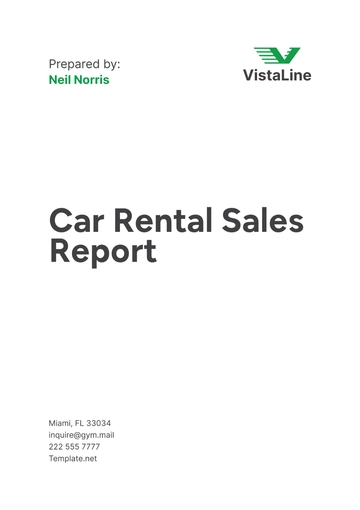
Free Car Rental Sales Report
I. Introduction
This Sales Report provides a comprehensive analysis of [Your Company Name]'s sales performance over the past fiscal year, 2051. The report aims to offer insights into sales trends, revenue generation, customer demographics, and operational efficiency. The findings will be used to inform strategic decisions and improve sales performance in the future.
A. Objectives
Evaluate Sales Performance: Analyze the sales data to assess the performance of the car rental business. This evaluation will highlight key areas of strength and potential weaknesses.
Identify Sales Trends: Highlight key sales trends and patterns observed throughout the year. Understanding these trends will aid in forecasting future sales and planning accordingly.
Customer Insights: Provide insights into customer demographics and preferences. This information is crucial for tailoring services and marketing strategies to meet customer needs.
Operational Efficiency: Assess the efficiency of sales operations and identify areas for improvement. Streamlining operations can lead to increased profitability and better customer service.
B. Methodology
Data Collection: Sales data was collected from the company’s internal databases and customer feedback forms. This comprehensive approach ensures a broad perspective on sales performance.
Analysis Techniques: Quantitative analysis was conducted using statistical tools to interpret the data. This method allows for precise and accurate insights into the sales figures.
Reporting: Findings were compiled into this report with detailed sections for each aspect of the analysis. The structured format ensures clarity and ease of understanding.
II. Sales Performance Overview
The following table presents an overview of [Your Company Name]'s sales performance for the past fiscal year, including total revenue, number of rentals, and average rental duration:
No. | Metric | Value |
|---|---|---|
1 | Total Revenue | $5,250,000 |
2 | Number of Rentals | 52,000 |
3 | Average Rental Duration | 4 days |
4 | Revenue per Rental | $100 |
A. Total Revenue
Revenue Growth: The total revenue of $5,250,000 represents a significant growth compared to the previous year. This increase indicates an upward trend in demand for our services.
Profitability: Sustained revenue growth enhances the profitability of the company. Increased revenue supports future expansion plans and operational improvements.
B. Number of Rentals
Customer Volume: With 52,000 rentals over the year, the volume of customers served highlights the popularity of our services. High rental volumes indicate a strong customer base.
Market Penetration: A high number of rentals reflects effective market penetration and customer acquisition strategies. This success is crucial for maintaining and growing market share.
C. Average Rental Duration
Utilization Rate: An average rental duration of 4 days indicates a healthy utilization rate of the fleet. Maximizing utilization rates leads to better revenue generation and operational efficiency.
Customer Preference: Understanding the average rental duration helps tailor our services to meet customer preferences and needs. This knowledge is important for optimizing fleet management and rental policies.
D. Revenue per Rental
Pricing Strategy: The revenue per rental of $100 underscores the effectiveness of our pricing strategy. Balancing affordability with profitability is key to maintaining a competitive edge.
Sales Performance: Monitoring revenue per rental assists in evaluating the overall sales performance. Identifying opportunities for revenue enhancement helps in making informed strategic decisions.
III. Monthly Sales Analysis
The following table provides a detailed breakdown of monthly sales performance, including total revenue, number of rentals, and average rental duration for each month:
No. | Month | Total Revenue | Number of Rentals | Average Rental Duration |
|---|---|---|---|---|
1 | January | $400,000 | 4,000 | 3.5 days |
2 | February | $350,000 | 3,500 | 3.7 days |
3 | March | $450,000 | 4,500 | 4.1 days |
4 | April | $480,000 | 4,800 | 4.0 days |
5 | May | $520,000 | 5,200 | 4.2 days |
6 | June | $550,000 | 5,500 | 4.3 days |
7 | July | $600,000 | 6,000 | 4.5 days |
8 | August | $590,000 | 5,900 | 4.4 days |
9 | September | $510,000 | 5,100 | 4.3 days |
10 | October | $470,000 | 4,700 | 4.1 days |
11 | November | $440,000 | 4,400 | 3.9 days |
12 | December | $490,000 | 4,900 | 4.0 days |
A. Revenue Trends
Peak Seasons: July and August were peak months with the highest total revenue. This trend reflects increased demand during the summer season when travel activity is typically higher.
Off-Peak Trends: Lower revenue in February and November suggests off-peak periods. Targeted marketing campaigns during these times can help boost sales and mitigate seasonal dips.
B. Rental Volume
Customer Engagement: A consistent number of rentals each month indicates stable customer engagement throughout the year. This stability is crucial for maintaining revenue levels and ensuring fleet utilization.
Seasonal Variations: The variation in rental volume across months highlights seasonal trends. These insights can inform inventory and staffing decisions to better meet fluctuating demand.
C. Average Rental Duration
Duration Patterns: The average rental duration peaked in July at 4.5 days. This trend indicates longer rental periods during the summer when customers are likely to take extended trips.
Customer Behavior: Understanding these patterns helps tailor promotional offers and service enhancements. Aligning services with customer behavior can improve satisfaction and drive repeat business.
IV. Customer Demographics
The following table presents the demographic breakdown of [Your Company Name]'s customers, including age group, gender, and geographic location:
No. | Demographic Factor | Percentage |
|---|---|---|
1 | Age Group 18-24 | 15% |
2 | Age Group 25-34 | 30% |
3 | Age Group 35-44 | 25% |
4 | Age Group 45-54 | 20% |
5 | Age Group 55+ | 10% |
6 | Male | 55% |
7 | Female | 45% |
8 | Urban | 70% |
9 | Suburban | 20% |
10 | Rural | 10% |
A. Age Group Analysis
Youth Engagement: The 18-24 age group constitutes 15% of customers, indicating a significant presence of younger renters. This demographic may value affordability and convenience.
Primary Market: The 25-34 age group, making up 30% of customers, represents the primary market. Marketing efforts should be targeted towards this demographic to maximize reach and engagement.
B. Gender Distribution
Male Dominance: With males constituting 55% of customers, it is important to consider male preferences. Tailoring service offerings and marketing strategies to this demographic can enhance customer satisfaction.
Female Representation: Females account for 45% of the customer base, highlighting the need for gender-inclusive marketing. Inclusive strategies ensure that both male and female customers feel valued and catered to.
C. Geographic Location
Urban Focus: Urban customers represent 70% of the customer base, indicating a strong preference for car rental services in urban areas. High urban demand underscores the importance of maintaining a robust urban presence.
Rural Opportunities: The lower percentage of rural customers suggests potential growth opportunities in rural areas. Targeted marketing efforts can help tap into this under-served market.
V. Revenue by Car Category
The following chart and table break down the revenue generated by different car categories, including economy, compact, intermediate, full-size, and luxury vehicles:
No. | Car Category | Revenue | Percentage |
|---|---|---|---|
1 | Economy | $1,050,000 | 20% |
2 | Compact | $1,575,000 | 30% |
3 | Intermediate | $1,312,500 | 25% |
4 | Full-Size | $787,500 | 15% |
5 | Luxury | $525,000 | 10% |
Total | $5,250,000 | 100% |
A. Economy Cars
High Demand: Economy cars generate 20% of total revenue, reflecting high demand for affordable rental options. This category is crucial for attracting cost-conscious customers.
Fleet Composition: Maintaining a substantial number of economy cars in the fleet ensures that customer demand for affordable rentals is consistently met.
B. Compact Cars
Revenue Contribution: Compact cars account for 30% of total revenue, making them the highest revenue-generating category. This indicates strong customer preference for compact vehicles.
Customer Preference: Compact cars offer a balance of affordability and comfort, making them popular among a wide range of customers. This popularity is essential for sustained revenue generation.
C. Intermediate Cars
Mid-Range Option: Intermediate cars contribute 25% to total revenue, serving as a mid-range option for customers seeking a balance between economy and luxury. This category appeals to customers looking for value and comfort.
Versatility: The versatility of intermediate cars makes them suitable for various customer needs, from business travel to family trips. This versatility enhances their appeal and drives revenue.
D. Full-Size Cars
Lower Demand: Full-size cars, contributing 15% to total revenue, are preferred by customers seeking comfort and ample space for longer trips. Despite lower demand, they play a key role in the fleet.
Higher Rental Rates: Full-size cars command higher rental rates, contributing significantly to revenue despite lower rental volumes. This makes them an important part of the fleet mix.
E. Luxury Cars
Premium Segment: Luxury cars, accounting for 10% of total revenue, cater to the premium segment of the market. They attract customers willing to pay a premium for high-end features and superior service.
Niche Market: While representing a smaller portion of the revenue, luxury cars attract a niche market. This market's willingness to pay higher rates justifies the inclusion of luxury vehicles in the fleet.
VI. Sales by Location
The following table provides a breakdown of sales performance by geographic location, including total revenue and number of rentals for each location:
No. | Location | Total Revenue | Number of Rentals |
|---|---|---|---|
1 | New York | $1,500,000 | 15,000 |
2 | Los Angeles | $1,200,000 | 12,000 |
3 | Chicago | $900,000 | 9,000 |
4 | Houston | $750,000 | 7,500 |
5 | Miami | $600,000 | 6,000 |
A. New York
Major Market: New York generates the highest revenue of $1,500,000, reflecting its status as a major market with high demand for car rental services. The bustling urban environment contributes significantly to this demand.
Urban Mobility: The high number of rentals (15,000) indicates a strong need for urban mobility solutions in New York. This trend underscores the importance of maintaining a significant fleet presence in the city.
B. Los Angeles
Tourism Hub: Los Angeles, with $1,200,000 in revenue, benefits from its status as a tourism hub. The city's attractions and business opportunities draw a diverse range of customers.
High Demand: The 12,000 rentals highlight the high demand for car rental services in Los Angeles. This demand is driven by both tourism and business travel, making it a key market for growth.
C. Chicago
Business Center: Chicago generates $900,000 in revenue, serving as a business center with substantial demand for rental services. The city's economic activity supports a steady flow of rentals.
Steady Growth: The consistent rental volume (9,000) indicates steady growth and a reliable customer base. This stability is crucial for long-term planning and investment in the region.
D. Houston
Regional Demand: Houston, with $750,000 in revenue, reflects regional demand for car rental services. The city's growing population and economic activities drive this demand.
Expansion Opportunities: The rental volume (7,500) suggests opportunities for expansion and increased market share in Houston. Strategic investments in this market can yield significant returns.
E. Miami
Leisure Market: Miami, generating $600,000 in revenue, is a key market for leisure travelers. The city's vibrant tourism industry contributes to high rental volumes, particularly during peak seasons.
Seasonal Trends: The rental volume (6,000) highlights seasonal trends that can inform promotional strategies. Understanding these trends helps in planning inventory and marketing efforts.
VII. Customer Feedback
The following table summarizes customer feedback on key aspects of the car rental experience, including service quality, vehicle condition, and overall satisfaction:
No. | Aspect | Average Rating (out of 5) |
|---|---|---|
1 | Service Quality | 4.5 |
2 | Vehicle Condition | 4.2 |
3 | Overall Satisfaction | 4.3 |
A. Service Quality
High Ratings: The high average rating of 4.5 for service quality reflects the effectiveness of our customer service efforts. Exceptional service is a cornerstone of our business strategy.
Customer Expectations: Meeting and exceeding customer expectations in service quality contributes to positive reviews and repeat business. Continuous training and development of staff are essential to maintain these high standards.
B. Vehicle Condition
Maintenance Standards: An average rating of 4.2 for vehicle condition indicates that our fleet maintenance standards are generally high. Regular maintenance ensures that vehicles are safe and reliable for customers.
Improvement Areas: While the rating is positive, there is still room for improvement in maintaining and updating our fleet. Investing in newer vehicles can further enhance customer satisfaction and reduce maintenance costs.
C. Overall Satisfaction
Positive Experience: The overall satisfaction rating of 4.3 suggests that customers have a generally positive experience with [Your Company Name]. This positive experience is crucial for building brand loyalty and encouraging repeat business.
Feedback Utilization: Regularly collecting and analyzing customer feedback helps identify strengths and areas for improvement. Addressing feedback promptly demonstrates our commitment to customer satisfaction and continuous improvement.
VIII. Recommendations
Based on the analysis conducted, the following recommendations are proposed to enhance [Your Company Name]'s sales performance and customer satisfaction:
A. Operational Improvements
Fleet Optimization: Regularly review and optimize the fleet composition to ensure a balance of popular car categories. This optimization helps meet customer demand and reduce maintenance costs by retiring older, less efficient vehicles.
Efficiency Enhancements: Implement technology solutions to streamline operations and reduce turnaround times. Improved efficiency can lead to better fleet utilization and increased customer satisfaction by providing faster service.
Training Programs: Enhance staff training programs to ensure consistent high-quality service. Addressing areas of improvement highlighted by customer feedback ensures that staff are well-equipped to meet customer expectations.
B. Marketing Strategies
Targeted Campaigns: Develop targeted marketing campaigns to attract customers during off-peak periods. This strategy can help boost rentals and revenue when demand is typically lower.
Loyalty Programs: Introduce or enhance loyalty programs to retain existing customers and encourage repeat business. Loyalty programs can offer discounts, upgrades, and other incentives to keep customers returning.
Regional Focus: Tailor marketing strategies to the specific needs and preferences of different geographic locations. Understanding regional differences helps in designing effective campaigns that resonate with local customers.
C. Customer Engagement
Feedback Mechanisms: Continuously collect and analyze customer feedback to identify and address service gaps. Regular feedback collection helps in making timely improvements and demonstrating our commitment to customer satisfaction.
Promotional Offers: Introduce promotional offers and discounts during peak and off-peak seasons. Strategic promotions can attract new customers and encourage existing customers to rent more frequently.
Personalized Services: Leverage customer data to offer personalized services and recommendations. Personalization can improve customer satisfaction and loyalty by making customers feel valued and understood.
IX. Conclusion
This Car Rental Sales Report of [Your Company Name] has provided a detailed analysis of sales performance, customer demographics, revenue by car category, sales by location, and customer feedback. The findings highlight the strengths and areas for improvement in the company's operations, offering valuable insights for strategic decision-making.
By addressing the recommendations outlined in this report, [Your Company Name] can enhance its sales performance, optimize operations, and improve customer satisfaction, ensuring sustained growth and competitiveness in the car rental market. The data and insights from the analysis serve as a foundation for future strategic planning and operational enhancements.
- 100% Customizable, free editor
- Access 1 Million+ Templates, photo’s & graphics
- Download or share as a template
- Click and replace photos, graphics, text, backgrounds
- Resize, crop, AI write & more
- Access advanced editor
Track sales performance with the Car Rental Sales Report Template! Only on Template.net, this template is customizable for various reporting needs. Its editable format allows for detailed sales data documentation. The AI Editor Tool aids in creating a comprehensive and accurate sales report, helping you monitor and improve sales strategies!
You may also like
- Sales Report
- Daily Report
- Project Report
- Business Report
- Weekly Report
- Incident Report
- Annual Report
- Report Layout
- Report Design
- Progress Report
- Marketing Report
- Company Report
- Monthly Report
- Audit Report
- Status Report
- School Report
- Reports Hr
- Management Report
- Project Status Report
- Handover Report
- Health And Safety Report
- Restaurant Report
- Construction Report
- Research Report
- Evaluation Report
- Investigation Report
- Employee Report
- Advertising Report
- Weekly Status Report
- Project Management Report
- Finance Report
- Service Report
- Technical Report
- Meeting Report
- Quarterly Report
- Inspection Report
- Medical Report
- Test Report
- Summary Report
- Inventory Report
- Valuation Report
- Operations Report
- Payroll Report
- Training Report
- Job Report
- Case Report
- Performance Report
- Board Report
- Internal Audit Report
- Student Report
- Monthly Management Report
- Small Business Report
- Accident Report
- Call Center Report
- Activity Report
- IT and Software Report
- Internship Report
- Visit Report
- Product Report
- Book Report
- Property Report
- Recruitment Report
- University Report
- Event Report
- SEO Report
- Conference Report
- Narrative Report
- Nursing Home Report
- Preschool Report
- Call Report
- Customer Report
- Employee Incident Report
- Accomplishment Report
- Social Media Report
- Work From Home Report
- Security Report
- Damage Report
- Quality Report
- Internal Report
- Nurse Report
- Real Estate Report
- Hotel Report
- Equipment Report
- Credit Report
- Field Report
- Non Profit Report
- Maintenance Report
- News Report
- Survey Report
- Executive Report
- Law Firm Report
- Advertising Agency Report
- Interior Design Report
- Travel Agency Report
- Stock Report
- Salon Report
- Bug Report
- Workplace Report
- Action Report
- Investor Report
- Cleaning Services Report
- Consulting Report
- Freelancer Report
- Site Visit Report
- Trip Report
- Classroom Observation Report
- Vehicle Report
- Final Report
- Software Report
