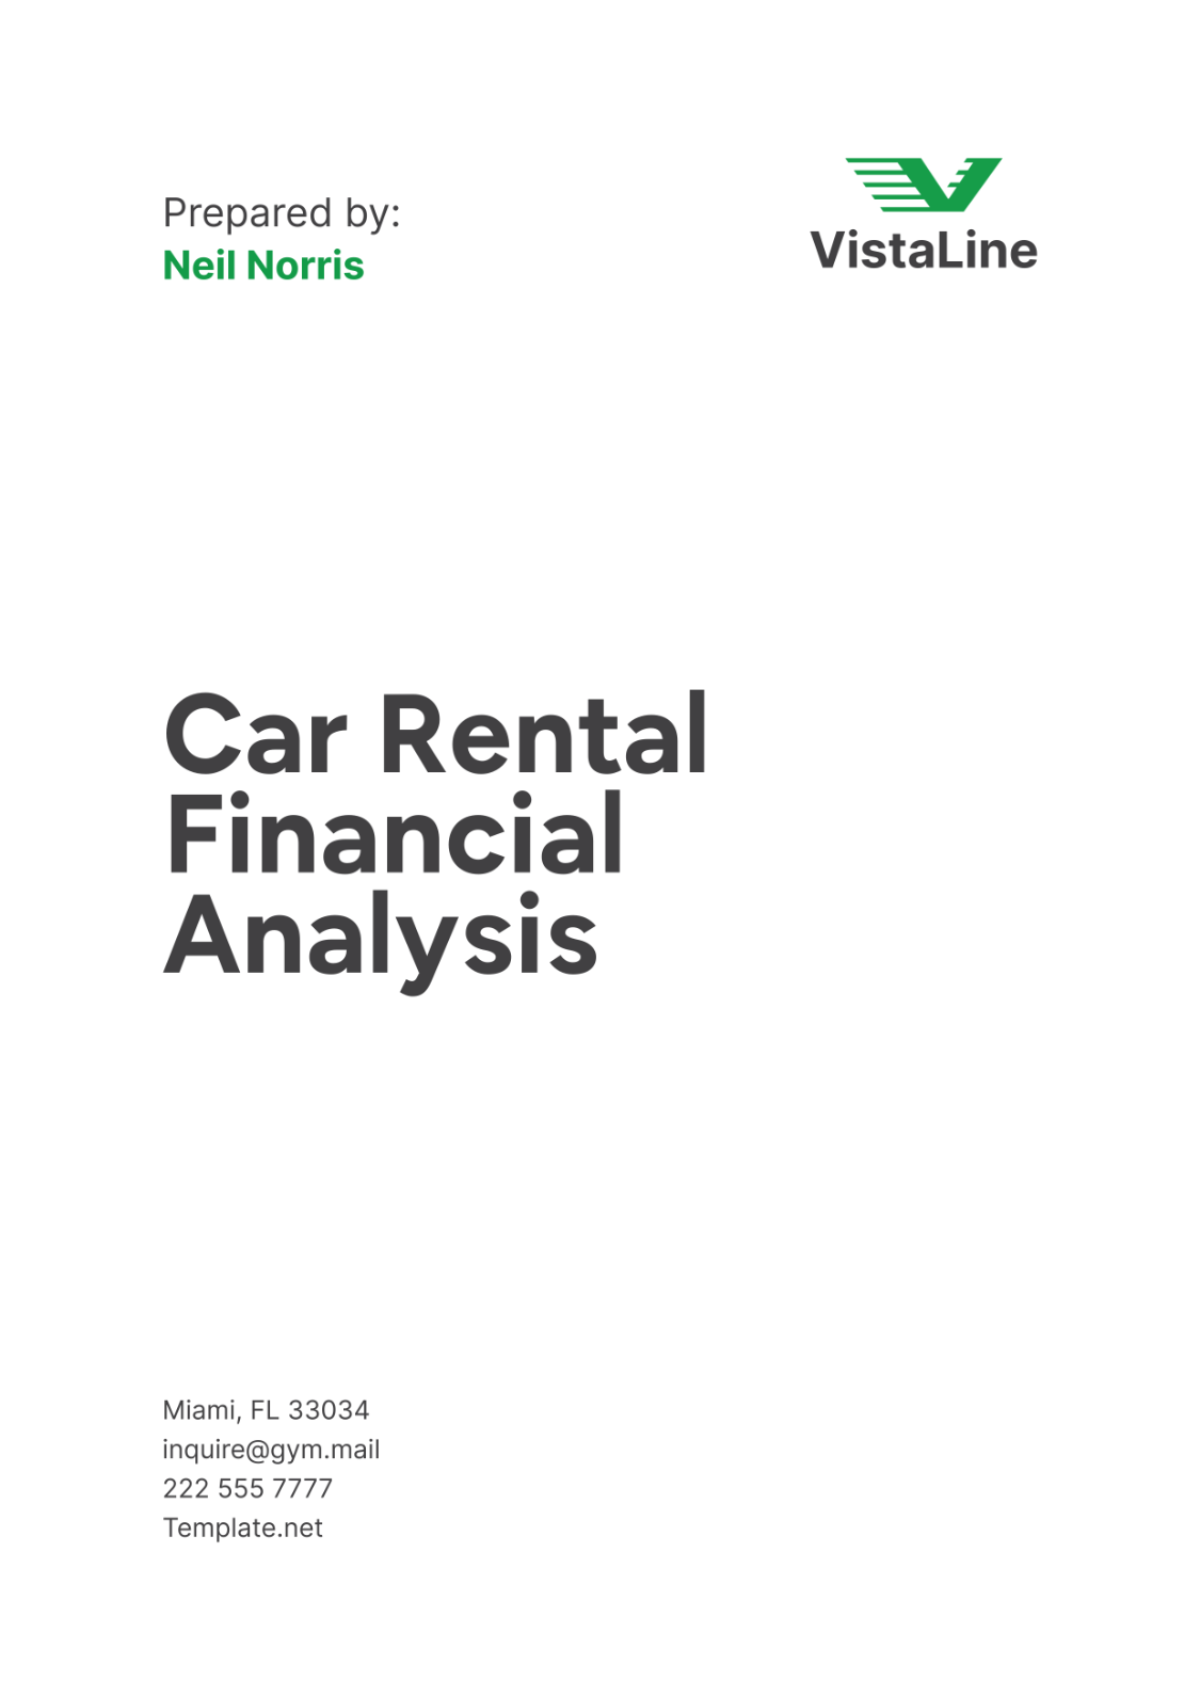
Free Car Rental Financial Analysis
I. Executive Summary
Our Car Rental Financial Analysis provides a comprehensive view of our financial performance and strategic insights. Key findings include:
Total revenue increased by 15% year-over-year, reaching $2.5 million.
Rental income breakdown:
Compact Cars: $800,000
Sedans: $600,000
SUVs: $700,000
Luxury Vehicles: $400,000
Net profit margin improved to 12%, reflecting effective cost management and pricing strategies.
II. Introduction
Our financial analysis aims to evaluate our financial health, identify growth opportunities, and optimize operational efficiency. It provides insights into revenue generation, cost management, and profitability within the competitive car rental market.
III. Financial Performance
Our rental income breakdown from different vehicle types for the fiscal year is as follows:
Vehicle Type | Rental Income ($) |
|---|---|
Compact Cars | 800,000 |
Sedans | 600,000 |
SUVs | 700,000 |
Luxury Vehicles | 400,000 |
Total | 2,500,000 |
This breakdown highlights the strong performance across vehicle categories, with SUVs contributing significantly to overall revenue. Compact cars and sedans also show steady income streams, while luxury vehicles cater to high-value clients.
Our analysis reveals that our pricing strategies and market positioning have effectively captured diverse customer segments, contributing to robust revenue growth. Moving forward, optimizing fleet management and enhancing customer service will further strengthen our financial performance.
IV. Cost Analysis
Our operational expenses for the fiscal year are detailed below:
Expense Category | Amount ($) |
|---|---|
Vehicle Maintenance | 450,000 |
Insurance | 200,000 |
Personnel Costs | 350,000 |
Marketing and Advertising | 150,000 |
Administrative Expenses | 100,000 |
Total Operating Expenses | 1,250,000 |
Our cost analysis underscores the significant investment in vehicle maintenance and insurance, essential for fleet reliability and customer satisfaction. Personnel costs and marketing expenditures support service quality and market visibility. Effective cost management strategies have optimized operational efficiency, contributing to profitability.
V. Profitability Assessment
Key financial ratios for the fiscal year are as follows:
Ratio | Value |
|---|---|
Gross Profit Margin | 40% |
Net Profit Margin | 12% |
Return on Assets (ROA) | 18% |
Return on Equity (ROE) | 25% |
Our profitability assessment demonstrates healthy margins, with a strong return on assets and equity. The gross profit margin of 40% indicates effective pricing strategies and cost control measures. A net profit margin of 12% reflects sustainable profitability despite competitive pressures and operational costs.
Moving forward, optimizing cost structures and exploring revenue diversification opportunities will be critical to sustaining profitability and achieving long-term financial objectives.
VI. Financial Position
Our balance sheet provides a snapshot of our financial position as of the end of the fiscal year:
Asset Category | Amount ($) |
|---|---|
Current Assets | |
Cash and Cash Equivalents | 300,000 |
Accounts Receivable | 150,000 |
Inventory | 100,000 |
Total Current Assets | 550,000 |
Non-Current Assets | |
Property, Plant, and Equipment | 1,200,000 |
Vehicles | 2,000,000 |
Total Non-Current Assets | 3,200,000 |
Total Assets | 3,750,000 |
Liability and Equity Category | Amount ($) |
|---|---|
Current Liabilities | |
Accounts Payable | 100,000 |
Short-Term Debt | 200,000 |
Total Current Liabilities | 300,000 |
Non-Current Liabilities | |
Long-Term Debt | 1,000,000 |
Total Non-Current Liabilities | 1,000,000 |
Total Liabilities | 1,300,000 |
Equity | |
Retained Earnings | 2,150,000 |
Total Equity | 2,450,000 |
Total Liabilities and Equity | 3,750,000 |
Our balance sheet highlights a healthy mix of current and non-current assets, primarily composed of vehicles and property. Adequate liquidity and manageable debt levels support our operational needs and expansion initiatives. Retained earnings reflect strong profitability and reinvestment in business growth.
VII. Cash Flow Analysis
Our cash flow analysis for the fiscal year illustrates cash flow trends and operational liquidity:
Category | Amount ($) |
|---|---|
Operating Activities | |
Cash Inflows | 2,800,000 |
Cash Outflows | (2,000,000) |
Net Cash from Operations | 800,000 |
Investing Activities | |
Purchase of Vehicles | (500,000) |
Purchase of Equipment | (200,000) |
Net Cash from Investing | (700,000) |
Financing Activities | |
Proceeds from Loans | 500,000 |
Repayment of Debt | (300,000) |
Net Cash from Financing | 200,000 |
Net Increase in Cash | 300,000 |
Cash and Cash Equivalents, Beginning | 0 |
Cash and Cash Equivalents, Ending | 300,000 |
Our cash flow analysis indicates positive net cash from operations, driven by strong rental income and effective cost management. Investing activities reflect strategic investments in fleet expansion, while financing activities demonstrate prudent debt management and capital raising efforts.
VIII. Key Performance Indicators
Our key performance indicators (KPIs) for the fiscal year reflect operational efficiency and financial health:
Metric | Reported Value |
|---|---|
Average Rental Duration | 7 days |
Occupancy Rate | 85% |
Customer Acquisition Cost | $150 per customer |
Revenue per Vehicle | $1,250 per month |
These KPIs demonstrate our strong market presence, with high occupancy rates and efficient customer acquisition costs. Average rental duration and revenue per vehicle indicate effective utilization of our fleet assets. Moving forward, we aim to optimize these metrics further to enhance profitability and customer satisfaction.
IX. Financial Forecast
Our financial forecast projects revenue and expenses for the upcoming fiscal year:
Category | Projection ($) |
|---|---|
Revenue | 3,000,000 |
Operating Expenses | (1,800,000) |
Net Income | 600,000 |
Our forecast anticipates steady revenue growth through increased market penetration and expanded service offerings. Operating expenses include investments in fleet maintenance and customer service enhancements to sustain profitability. This outlook positions us for continued financial stability and growth in a competitive market environment.
X. Conclusion
Looking ahead, we are committed to implementing strategic initiatives aimed at further enhancing operational efficiency and customer experience. Key priorities include optimizing fleet management, expanding market reach through targeted marketing efforts, and leveraging technology to streamline operations. By focusing on these areas, we aim to achieve sustainable growth and maintain our leadership in the car rental industry.
- 100% Customizable, free editor
- Access 1 Million+ Templates, photo’s & graphics
- Download or share as a template
- Click and replace photos, graphics, text, backgrounds
- Resize, crop, AI write & more
- Access advanced editor
Explore the Car Rental Financial Analysis Template on Template.net. This editable and customizable template provides comprehensive financial insights. Analyze revenue, expenses, and profitability with its user-friendly format, editable in our AI Editor tool. Gain valuable insights to optimize financial strategies in the car rental industry effectively.
