Content KPI and Metrics
[Your Company Name]
[Your Company Address]
[Your Company Email]
[Your Company Number]
[Your Company Website]
[Your Company Social Media]
Overview
Content Title: "The Future of AI in Healthcare"
Content Type: Blog Post
Content Creator: Sarah Johnson
Date Published: July 15, 2050
Target Audience: Healthcare Professionals, Tech Enthusiasts
Key Performance Indicators (KPIs)
KPI | Description | Target Value | Actual Value | % Achieved |
|---|---|---|---|---|
Page Views | Number of times the content was viewed | 10,000 | 8,500 | 85% |
Unique Visitors | Number of distinct visitors | 7,000 | 6,200 | 89% |
Average Time on Page | Average time spent on the content | 3 minutes | 2.5 minutes | 83% |
Bounce Rate | Percentage of visitors who leave after one page | 40% | 45% | 89% |
Social Shares | Number of times the content was shared | 500 | 450 | 90% |
Comments | Number of comments received | 50 | 42 | 84% |
Conversion Rate | Percentage of visitors who completed a desired action | 5% | 4.2% | 84% |
Insights
What worked well: High engagement on social media with significant shares and comments. The content resonated well with healthcare professionals.
Areas for improvement: Bounce rate was higher than expected; consider adding more engaging content to keep visitors on the page longer.
Recommendations: Optimize for SEO to increase visibility, and include more interactive elements in the content to improve average time on page.
Additional Notes
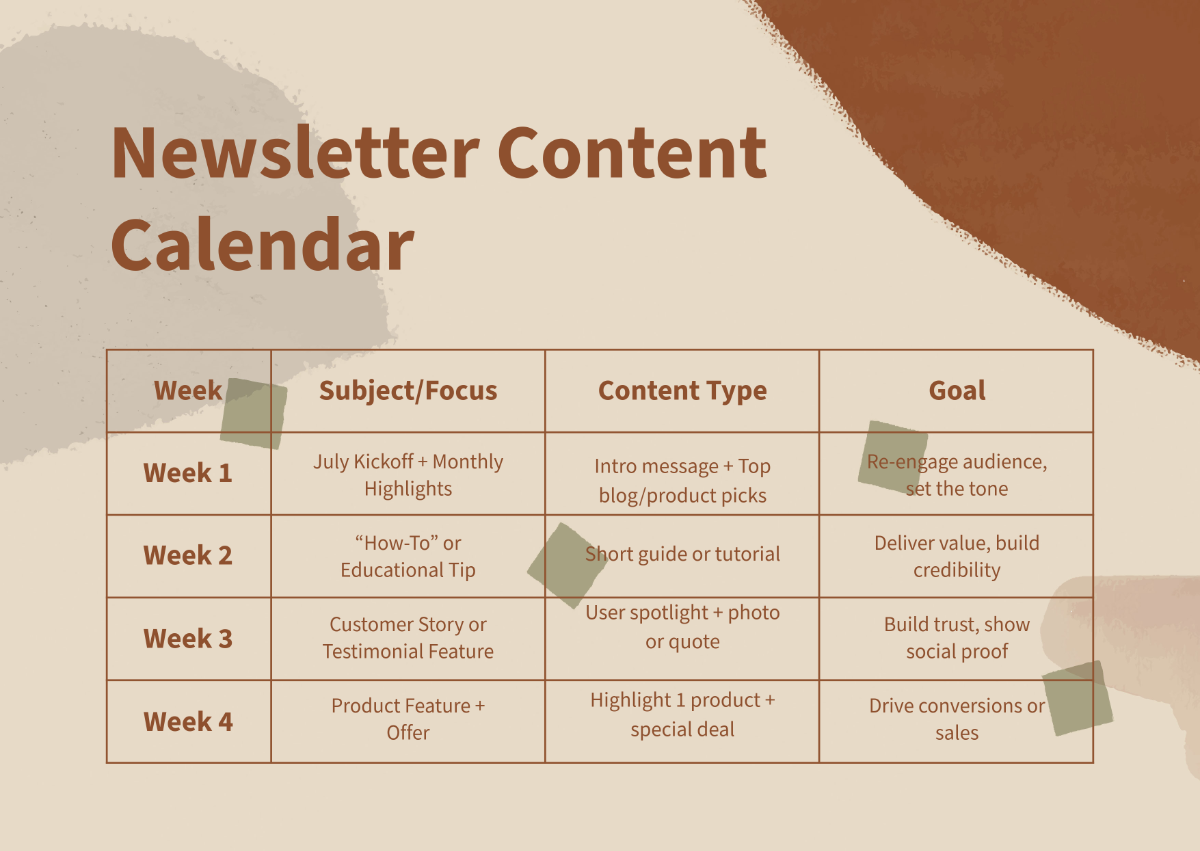
The blog post was featured in our monthly newsletter, which may have influenced the traffic and engagement metrics.
Prepared by: [Your Name]
Date: July 31, 2050
For more information, contact:
[Your Email]
[Your Number]
