SaaS Business Review
I. Executive Summary
[YOUR COMPANY NAME], a leading SaaS provider, achieved significant milestones in terms of customer acquisition, revenue growth, and product innovation. This business review covers key performance indicators, customer feedback, market trends, and strategic initiatives undertaken during the year. The objective is to provide stakeholders with a comprehensive overview of the company's performance and future directions.
II. Financial Performance
A. Revenue Analysis
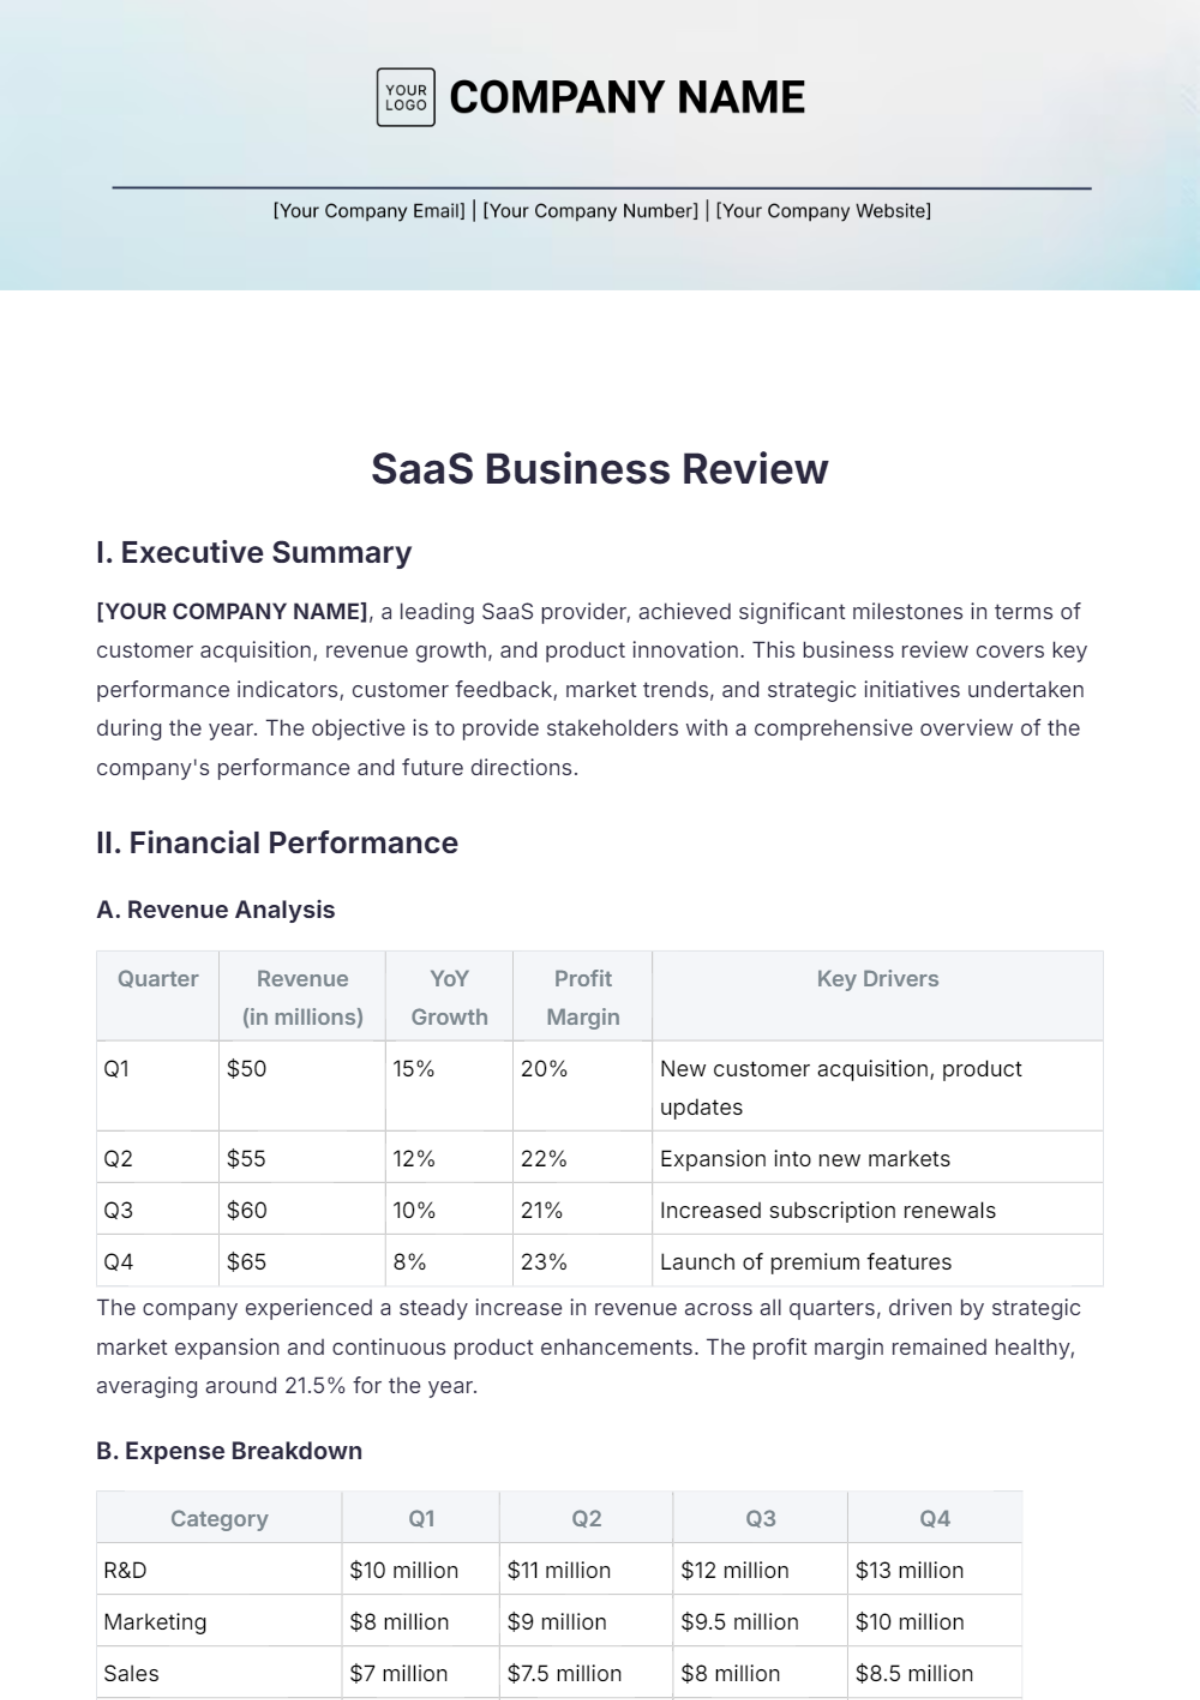
Quarter | Revenue (in millions) | YoY Growth | Profit Margin | Key Drivers |
|---|
Q1 | $50 | 15% | 20% | New customer acquisition, product updates |
Q2 | $55 | 12% | 22% | Expansion into new markets |
Q3 | $60 | 10% | 21% | Increased subscription renewals |
Q4 | $65 | 8% | 23% | Launch of premium features |
The company experienced a steady increase in revenue across all quarters, driven by strategic market expansion and continuous product enhancements. The profit margin remained healthy, averaging around 21.5% for the year.
B. Expense Breakdown
Category | Q1 | Q2 | Q3 | Q4 |
|---|
R&D | $10 million | $11 million | $12 million | $13 million |
Marketing | $8 million | $9 million | $9.5 million | $10 million |
Sales | $7 million | $7.5 million | $8 million | $8.5 million |
Customer Support | $5 million | $5.2 million | $5.4 million | $5.6 million |
General & Admin | $4 million | $4.1 million | $4.3 million | $4.5 million |
The main areas of expenditure were research and development (R&D), marketing, and sales. Investment in R&D increased steadily, highlighting the company's commitment to innovation.
III. Customer Metrics
A. Customer Acquisition and Retention
Metric | Q1 | Q2 | Q3 | Q4 |
|---|
New Customers | 500 | 550 | 600 | 650 |
Customer Churn Rate (%) | 3% | 2.8% | 2.5% | 2.3% |
Net Promoter Score (NPS) | 70 | 72 | 74 | 75 |
The customer acquisition rate showed a consistent upward trend, while the churn rate decreased, reflecting improved customer satisfaction and loyalty. The Net Promoter Score (NPS) also improved, indicating higher customer satisfaction.
B. Customer Feedback
Customers praised the platform for its ease of use, reliability, and the continuous addition of new features. Areas identified for improvement include enhanced customer support and more comprehensive onboarding resources.
IV. Product Development
A. New Features and Updates
[YOUR COMPANY NAME] introduced several key features:
AI-Powered Analytics: Enhanced data analytics capabilities to provide actionable insights.
Mobile App Enhancements: Improved user interface and added functionalities for the mobile app.
Security Upgrades: Implementation of advanced security protocols to ensure data protection.
These updates were driven by customer feedback and market demands, positioning the company at the forefront of innovation in the SaaS industry.
V. Market Trends
A. Industry Growth
The SaaS market continued to grow robustly, with a global market size exceeding $300 billion. Key trends included:
Increased adoption of AI and machine learning.
Greater emphasis on data security and privacy.
Rise in demand for mobile-friendly solutions.
B. Competitive Landscape
[YOUR COMPANY NAME] maintained its competitive edge by focusing on innovation, customer satisfaction, and strategic partnerships. The company faced competition from established players and new entrants, but its strong brand reputation and comprehensive product suite helped it remain a leader in the market.
VI. Strategic Initiatives
A. Market Expansion
[YOUR COMPANY NAME] expanded into new geographical markets, including Asia and South America, contributing to revenue growth. Strategic partnerships with local companies facilitated smoother market entry and customer acquisition.
B. Sustainability Efforts
In alignment with global sustainability goals, the company implemented several green initiatives:
Reduced carbon footprint by optimizing data center operations.
Launched a paperless office campaign.
Encouraged remote work to minimize commuting emissions.
VII. Human Resources
A. Workforce Development
Metric | Q1 | Q2 | Q3 | Q4 |
|---|
Total Employees | 1,000 | 1,050 | 1,100 | 1,150 |
Employee Satisfaction Score | 85 | 87 | 88 | 90 |
Training Hours per Employee | 10 | 12 | 15 | 18 |
The company focused on employee development through continuous training programs and career advancement opportunities. Employee satisfaction scores improved throughout the year, reflecting a positive workplace culture.
VIII. Future Outlook
A. Growth Projections
Looking ahead, [YOUR COMPANY NAME] aims to achieve the following objectives:
Revenue Target: $300 million
Customer Base: 10,000 active customers
New Market Entries: Europe and Africa
B. Strategic Priorities
Innovation: Continue investing in R&D to stay ahead of technological advancements.
Customer Experience: Enhance support services and improve the overall user experience.
Sustainability: Further reduce environmental impact through eco-friendly practices.
This comprehensive SaaS Business Review provides a detailed analysis of [YOUR COMPANY NAME]'s performance, highlighting key achievements, financial metrics, customer insights, and strategic directions for the future.
Review Templates @ Template.net
