Free Aesthetic Grocery Store Monthly Sales Statement
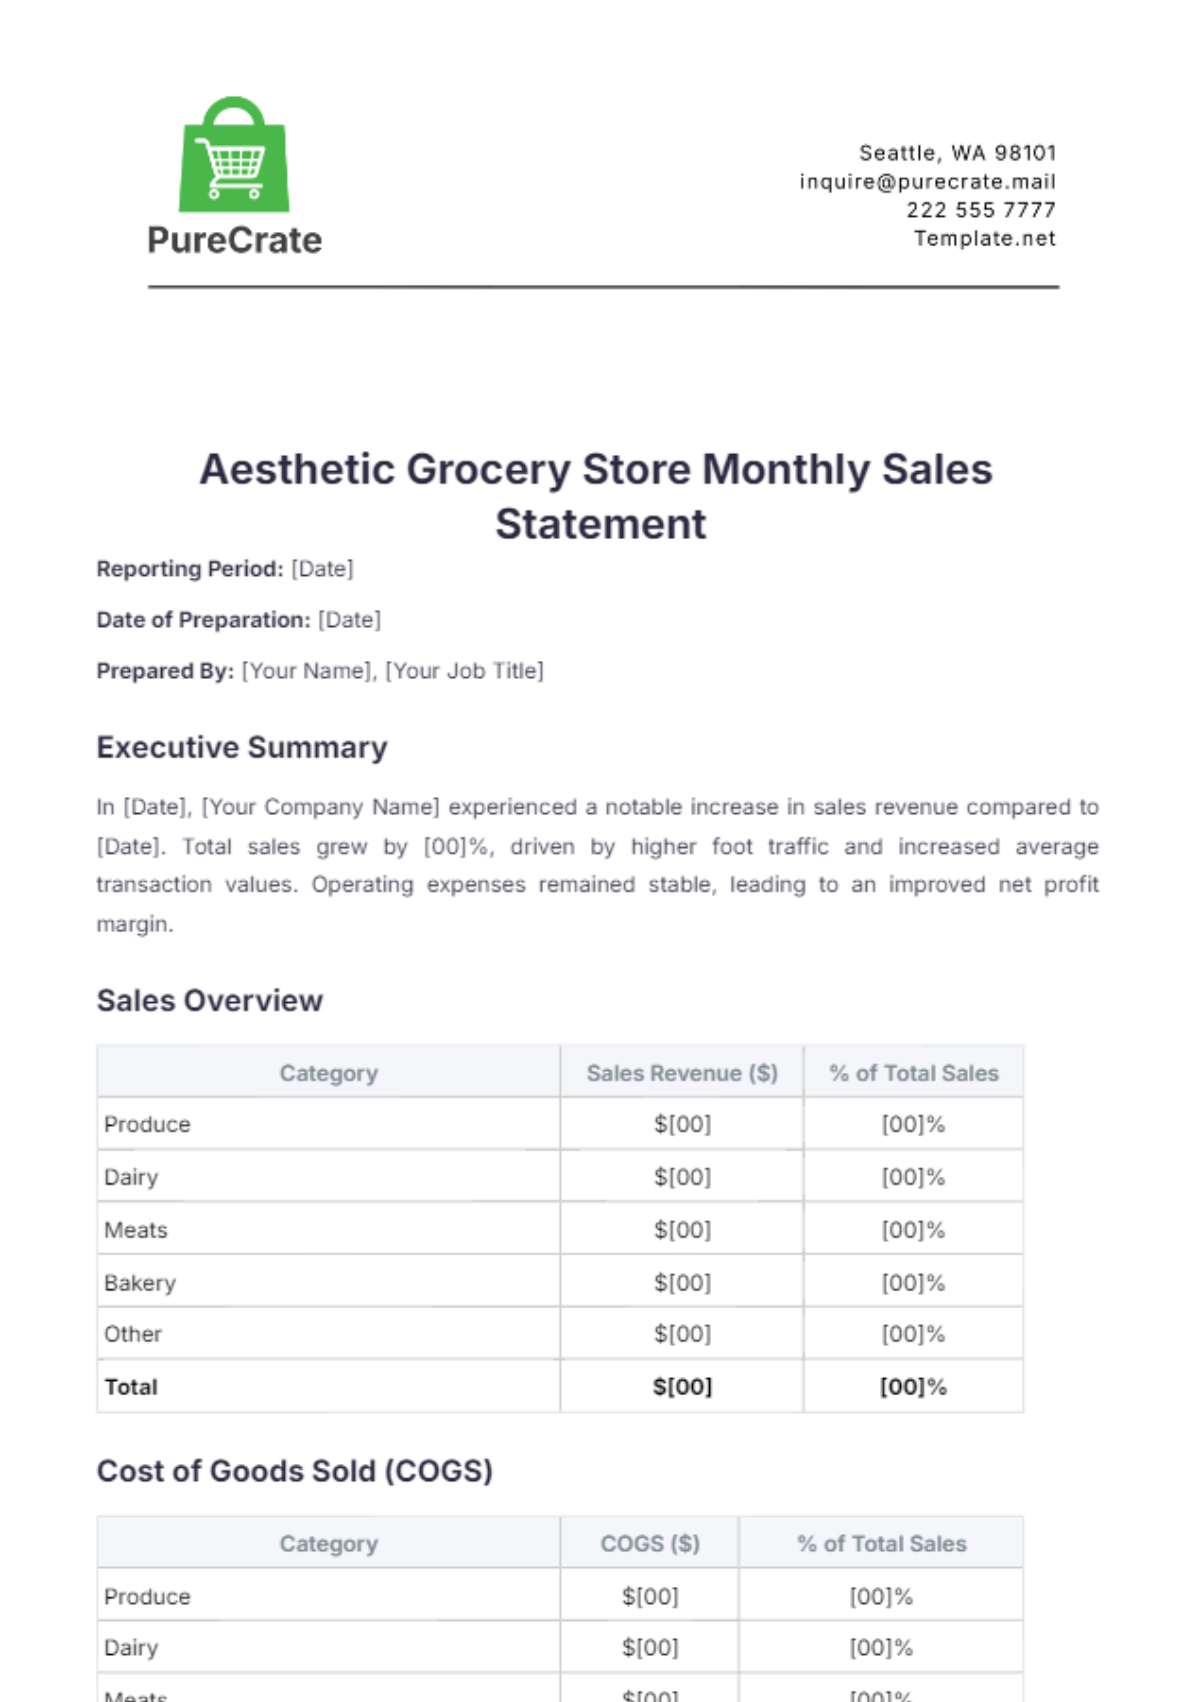
Reporting Period: [Date]
Date of Preparation: [Date]
Prepared By: [Your Name], [Your Job Title]
Executive Summary
In [Date], [Your Company Name] experienced a notable increase in sales revenue compared to [Date]. Total sales grew by [00]%, driven by higher foot traffic and increased average transaction values. Operating expenses remained stable, leading to an improved net profit margin.
Sales Overview
Category | Sales Revenue ($) | % of Total Sales |
|---|---|---|
Produce | $[00] | [00]% |
Dairy | $[00] | [00]% |
Meats | $[00] | [00]% |
Bakery | $[00] | [00]% |
Other | $[00] | [00]% |
Total | $[00] | [00]% |
Cost of Goods Sold (COGS)
Category | COGS ($) | % of Total Sales |
|---|---|---|
Produce | $[00] | [00]% |
Dairy | $[00] | [00]% |
Meats | $[00] | [00]% |
Bakery | $[00] | [00]% |
Other | $[00] | [00]% |
Total COGS | $[00] | [00]% |
Gross Profit
Gross Profit ($): [00] - [00] = [00]
Gross Profit Margin: ([00] / [00]) * 100 = [00]%
Operating Expenses
Expense | Amount ($) |
|---|---|
Salaries and Wages | $[00] |
Rent | $[00] |
Utilities | $[00] |
Maintenance | $[00] |
Other Costs | $[00] |
Total Expenses | $[00] |
Net Profit
Net Profit ($): [00] - [00] = [00]
Net Profit Margin: ([00] / [00]) * 100 = [00]%
Sales Trends and Analysis
Month-over-Month Comparison: [Month] sales increased by [00]% compared to [Month Year].
Year-over-Year Comparison: Sales in [Month Year] were [00]% higher than [Month Year].
Seasonal Trends: Higher sales in the produce and dairy categories during summer months.
Inventory Analysis
Inventory Turnover Rate: 4.5 (ratio of cost of goods sold to average inventory)
Stock Levels and Shrinkage: Inventory shrinkage at 1.2% of total inventory
Action Items and Recommendations
Improve Stock Levels: Address low stock issues in the bakery category.
Increase Marketing Efforts: Focus on promotions for dairy products.
Evaluate Staffing: Consider additional staff during peak hours to improve customer service.
- 100% Customizable, free editor
- Access 1 Million+ Templates, photo’s & graphics
- Download or share as a template
- Click and replace photos, graphics, text, backgrounds
- Resize, crop, AI write & more
- Access advanced editor
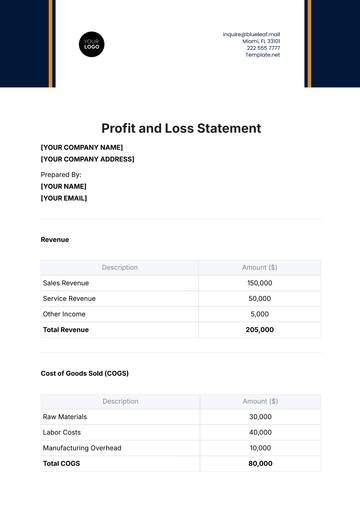
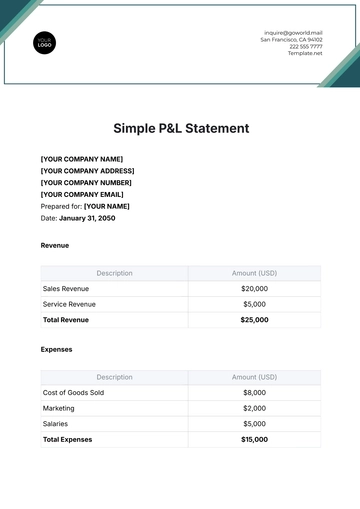
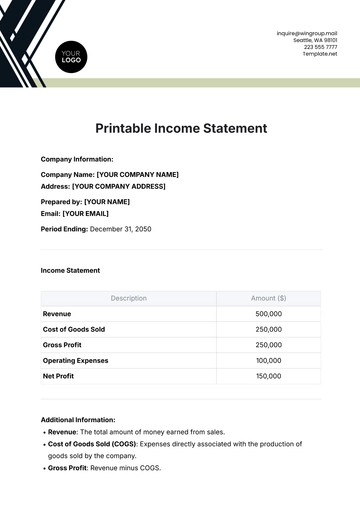
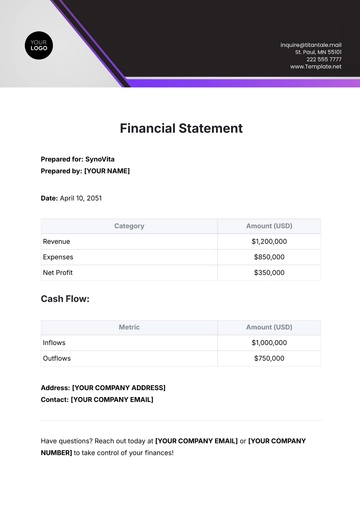
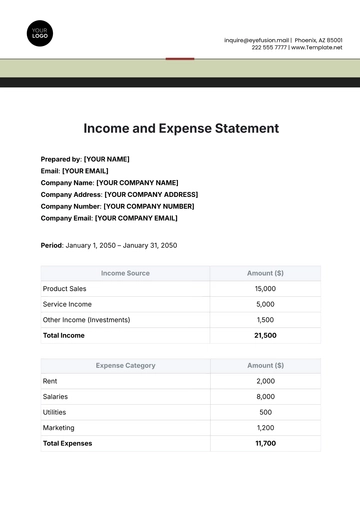
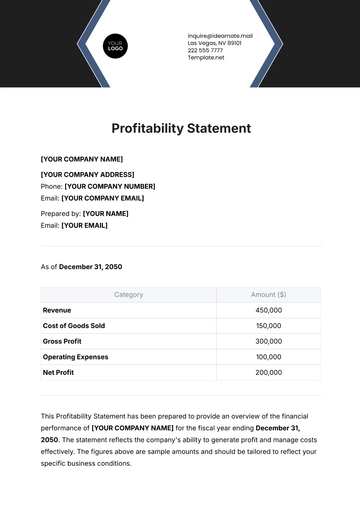
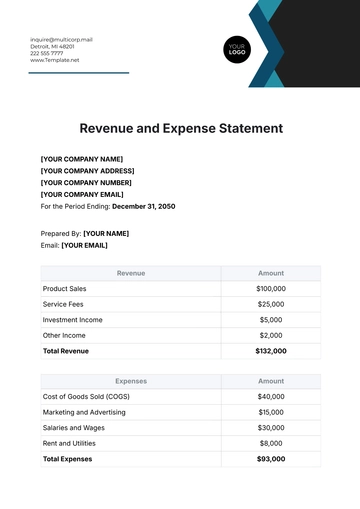
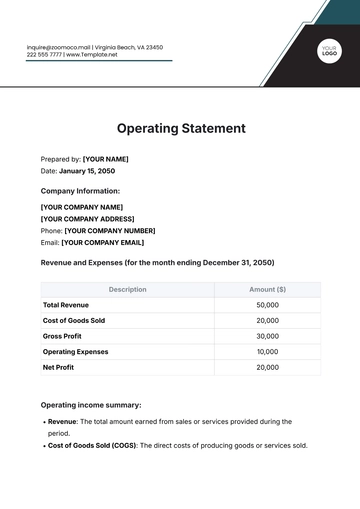
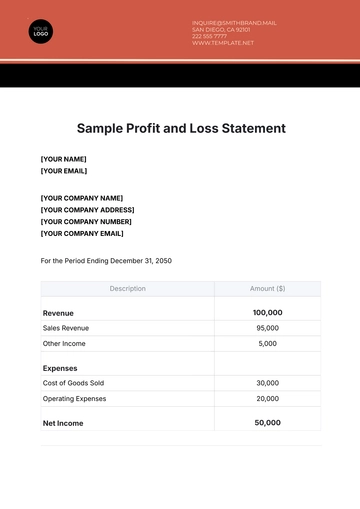
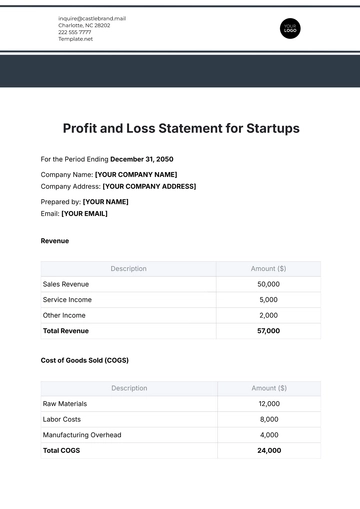
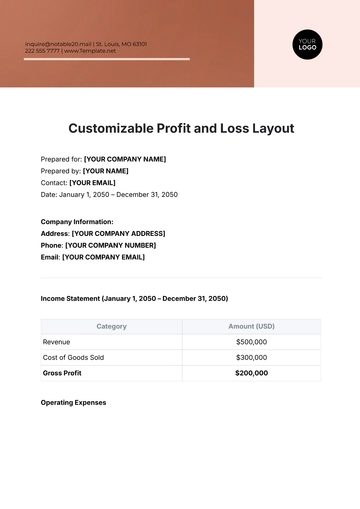
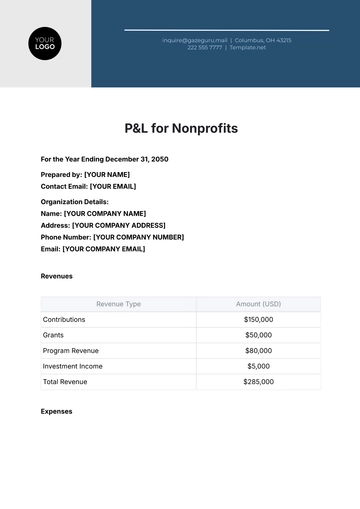
Create stunning monthly sales reports with the Aesthetic Grocery Store Monthly Sales Statement Template from Template.net. This customizable and editable template features an intuitive AI Editor Tool, making it easy to tailor the statement to your store’s needs. Streamline your financial reporting with this user-friendly, professional design that adapts to your business requirements.
