Sales Performance Review Format
Prepared by: [Your Name]
Company: [Your Company Name]
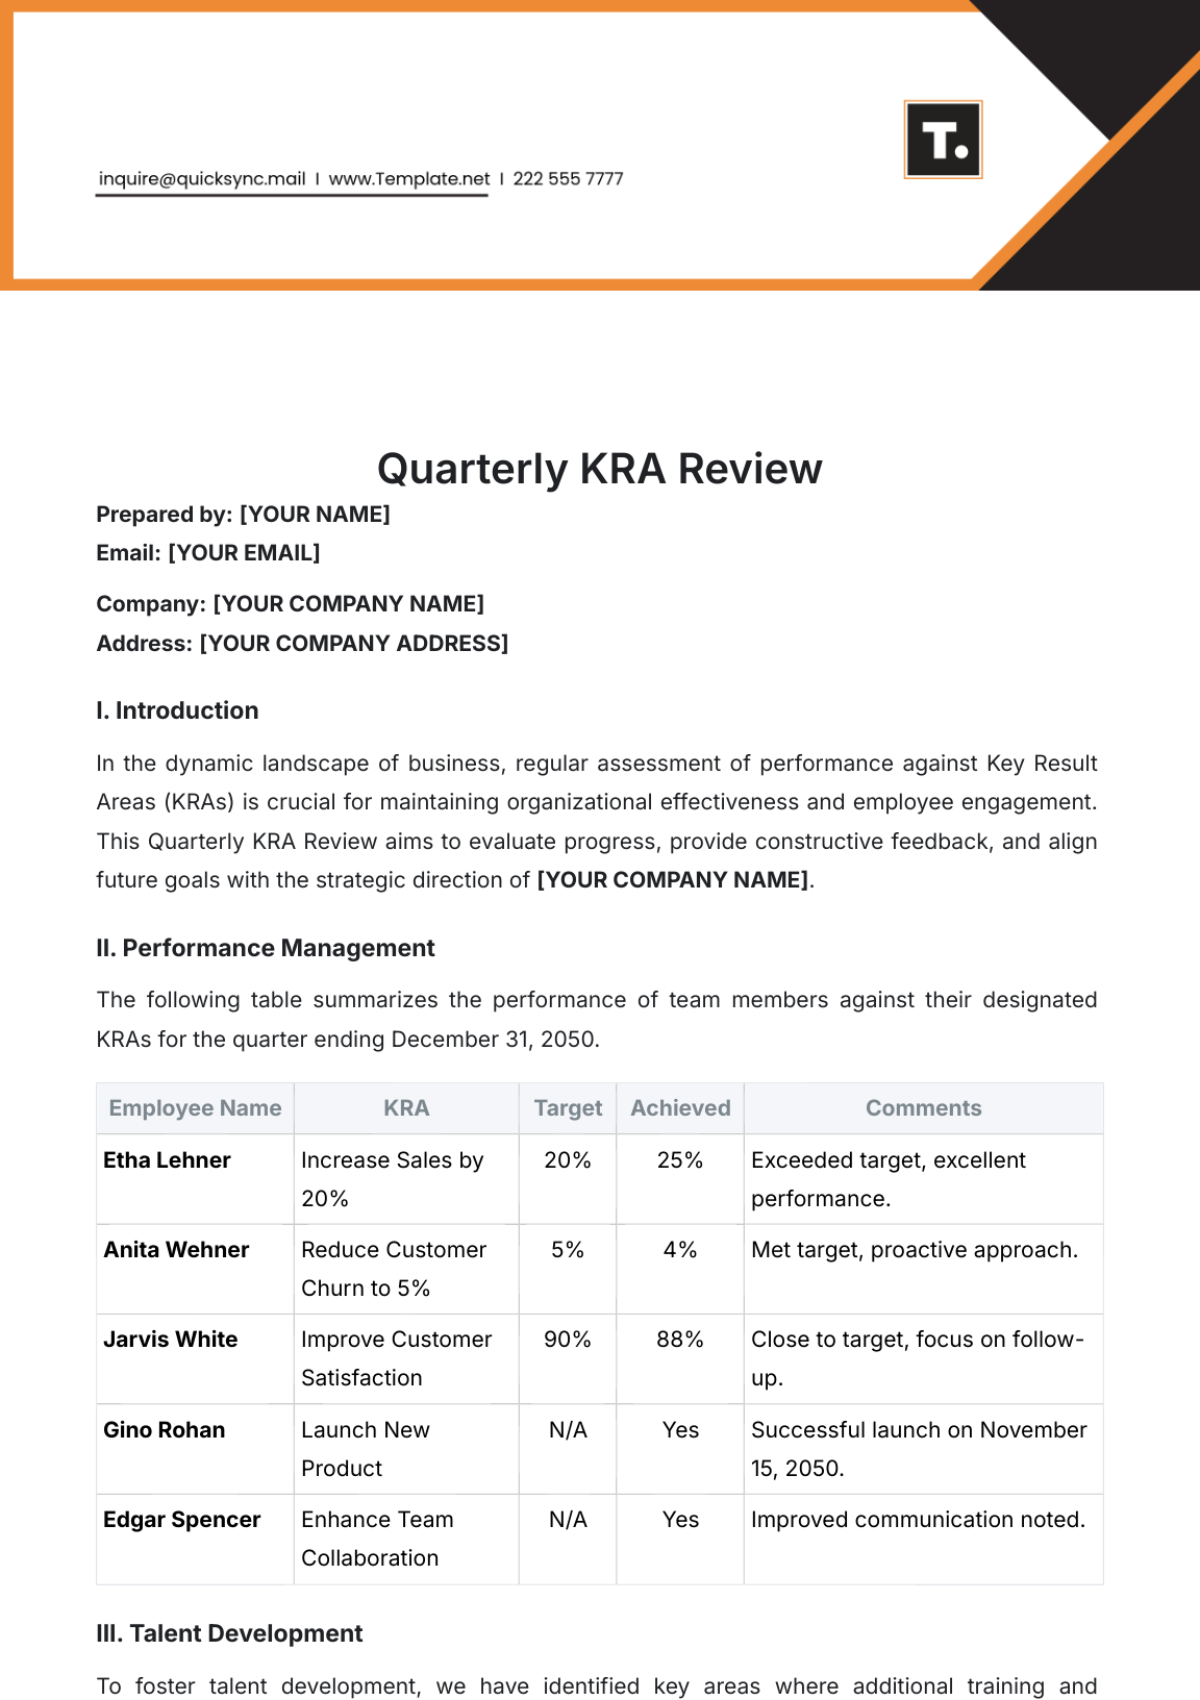
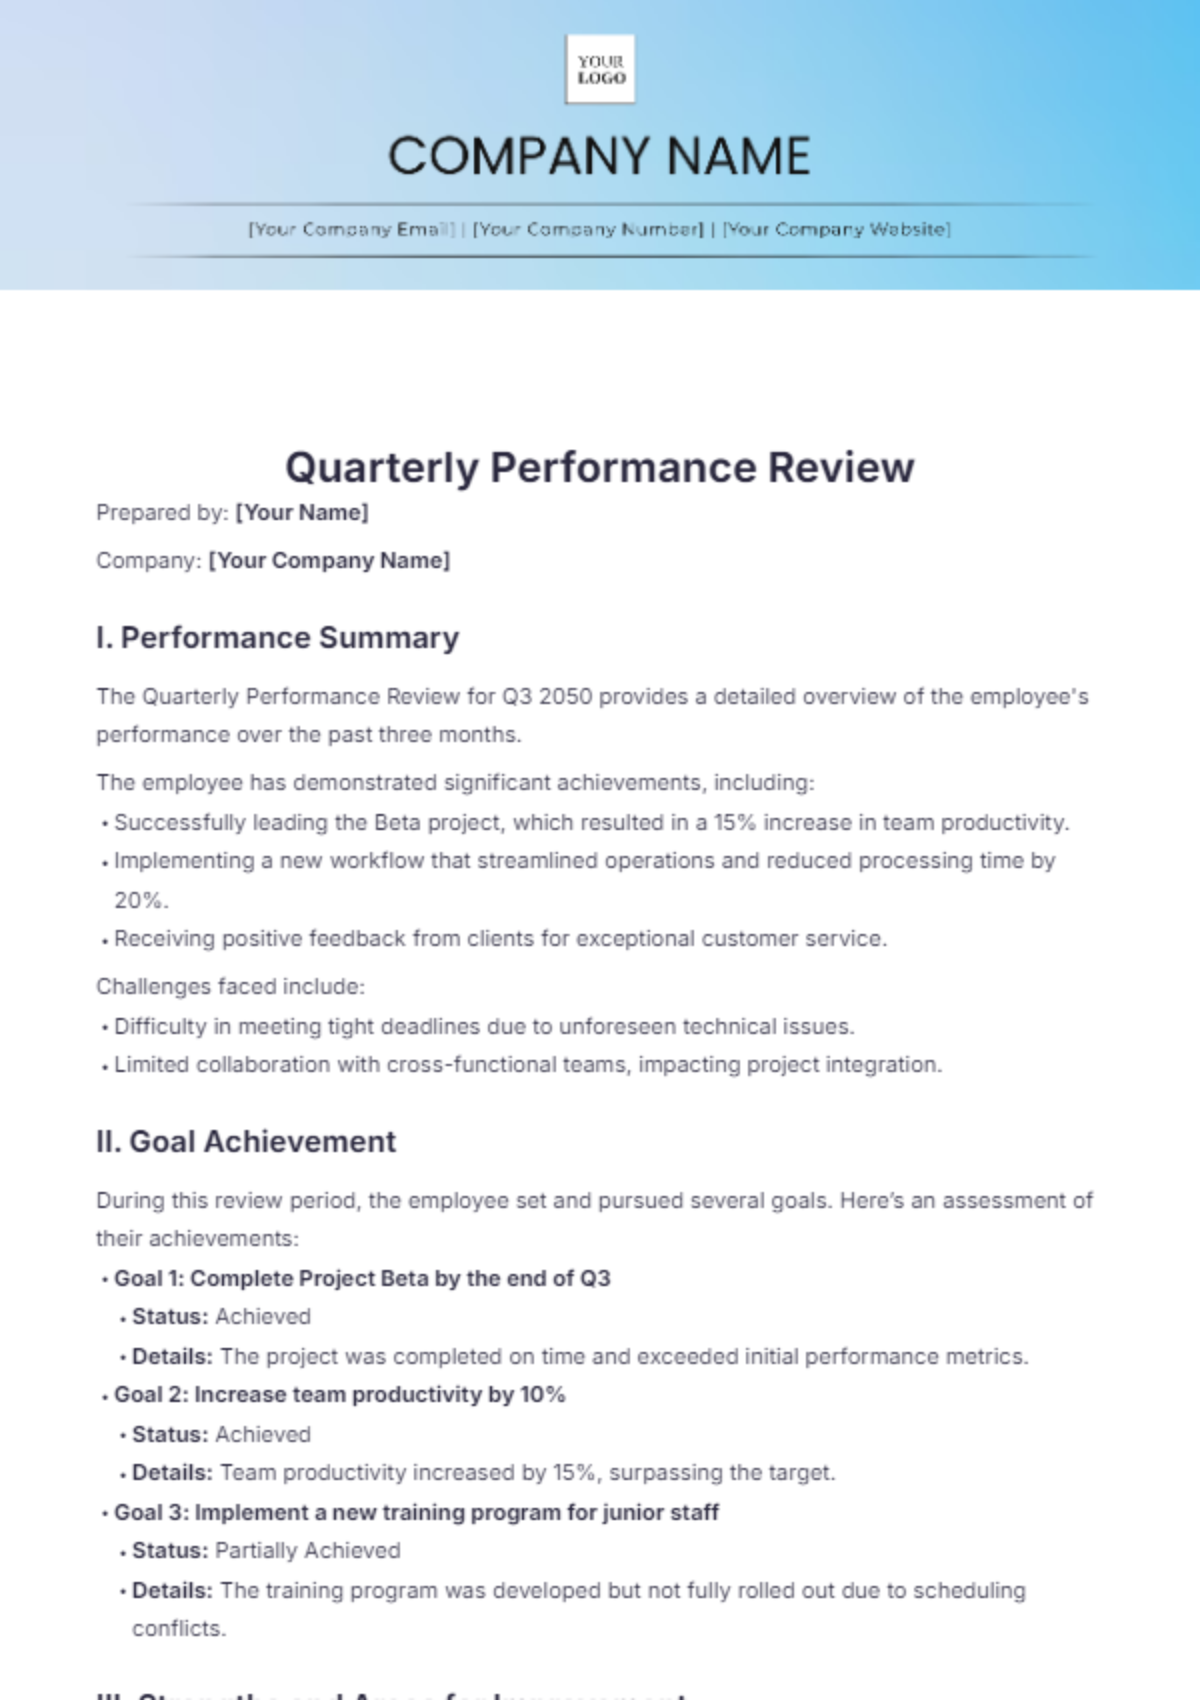
I. Purpose: Performance Appraisals
The purpose section outlines the objective of the performance review. In this case, it should clarify the purpose of evaluating the sales team’s performance, whether for bonuses, promotions, or other incentives. It helps set the stage for understanding the importance of the review.
II. Executive Summary
This section provides a brief overview of the sales performance review process. Summarize key points such as the year of review, what the review will cover (metrics, team performance, client feedback), and how the results will impact decisions. This sets expectations for the audience.
III. Performance Metrics
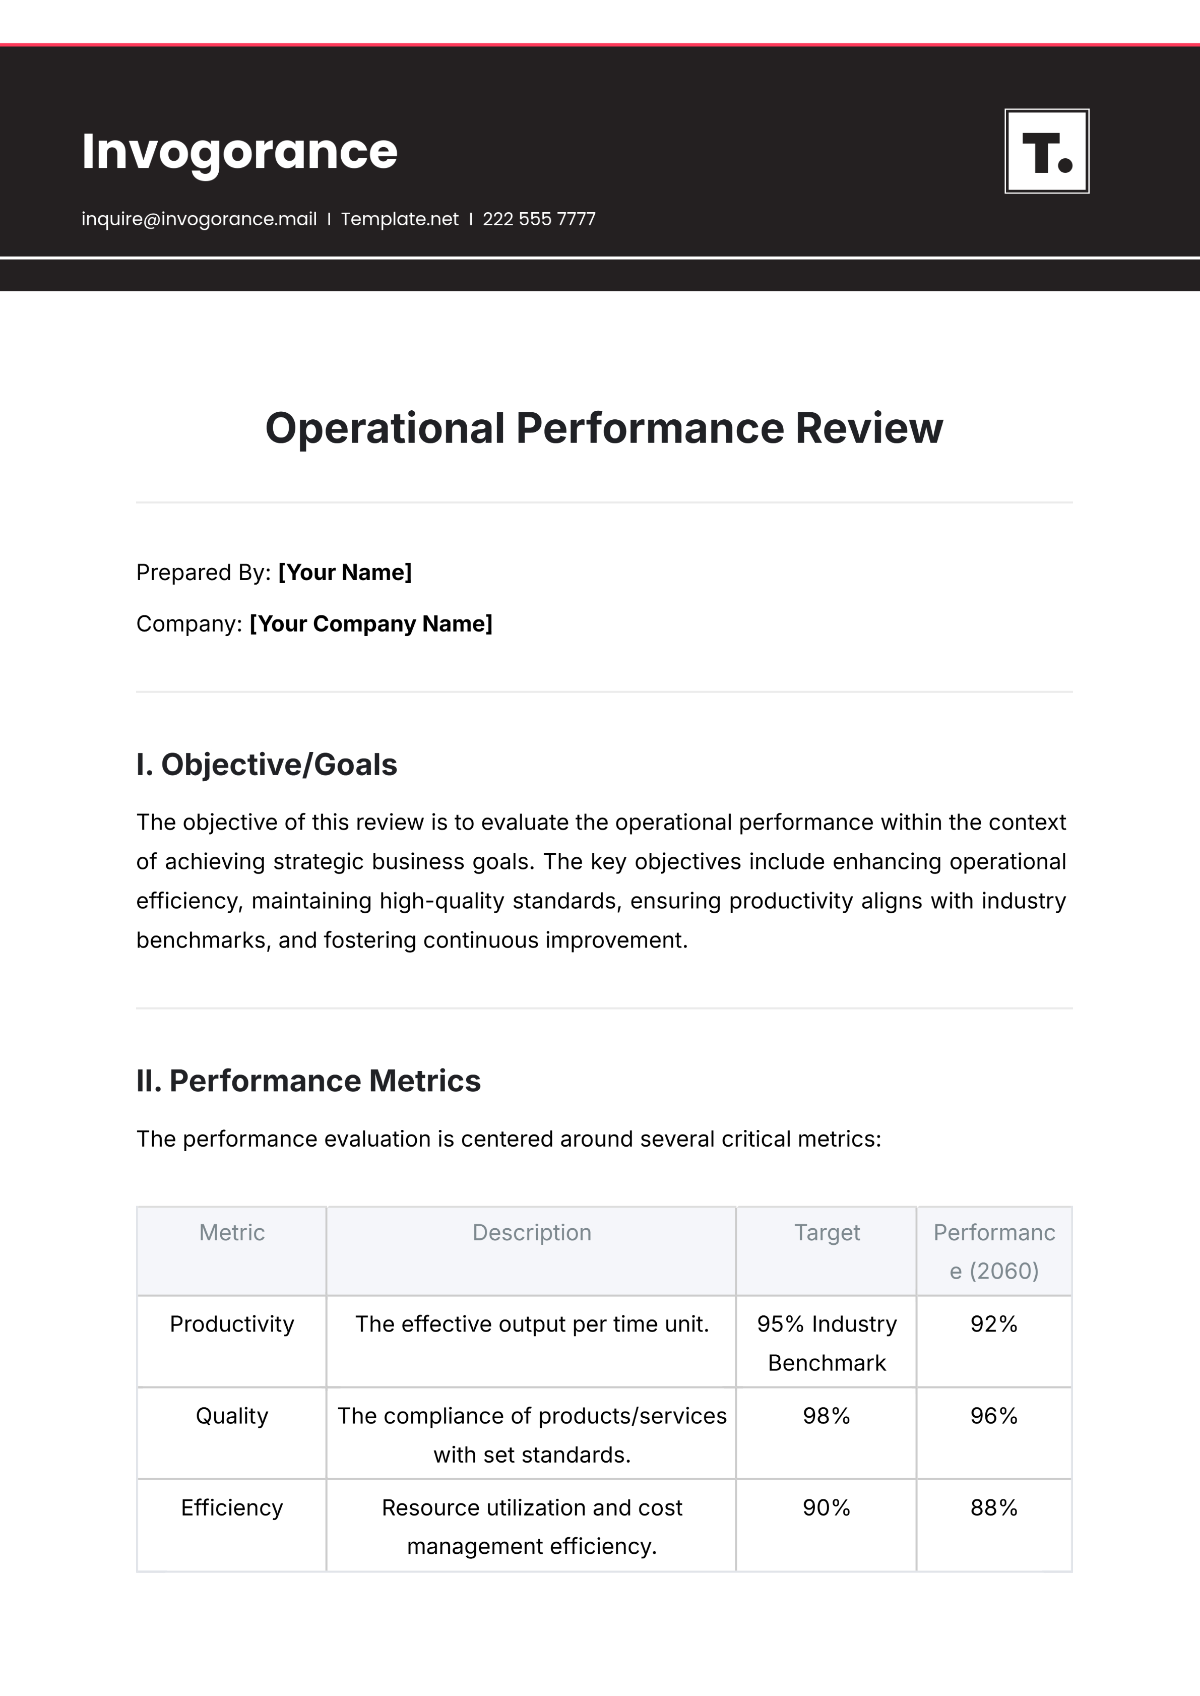
This section details the measurable aspects of sales performance. Include various metrics that are critical for evaluating success:
Sales Revenue: A breakdown of total and quarterly sales to assess overall performance.
Conversion Rates: Shows how effectively leads are turning into sales opportunities and actual sales.
Average Deal Size: Helps determine the scale of each sale.
Customer Acquisition Costs (CAC): Indicates how much is being spent to acquire a new customer.
Provide clear figures and metrics for each category, comparing current performance to previous years or industry standards, as needed.
IV. Individual Assessments
For each salesperson, provide an in-depth performance assessment. Include:
Strengths: Highlight positive attributes and achievements.
Areas for Improvement: Constructively point out areas that need growth or focus.
Goal Achievements: Meeting or exceeding sales targets.
Feedback: Summary of perceptions on the salesperson's performance.
Recommendations: Advice for sales improvement or continued excellence.
Repeat the structure for each individual assessed.
V. Comparative Analysis
This section compares the sales team’s overall performance to set targets and industry benchmarks. Address the following:
Performance Against Targets: Was the team successful in meeting or exceeding goals? Quantify the level of success.
Performance Against Industry Benchmarks: Compare the team’s performance with industry standards (e.g., average deal size, CAC). Show how your team’s performance stacks up against competitors or industry norms.
VI. Training and Development Plans
Outline specific training programs for individuals or the team as a whole. This section should identify:
Salesperson-specific training: Identify individual areas of development for salespeople and provide resources or programs that will address them.
Team-wide training: Highlight any initiatives designed to enhance overall team performance, such as new product training or techniques to boost conversion rates.
VII. Action Plan
This is a detailed plan of action for the coming quarters. Include:
Quarter 1, 2051: Prioritize immediate training and tweak digital marketing strategies.
Quarter 2, 2051: Follow-up to assess training impact and boost team engagement.
Quarter 3, 2051: Monitor progress and make adjustments based on data collected.
Quarter 4, 2051: Evaluate yearly performance and plan for the upcoming year.
Each action should have a specific goal and timeframe for completion.
