Free Half-Year Business Review Star this template Unstar this template Share to Social Media
Free Edit this free template No sign up needed
100% Customizable, free editor Access 1 Million+ Templates, photo’s & graphics Download or share as a template Click and replace photos, graphics, text, backgrounds Resize, crop, AI write & more Access advanced editor Evaluate mid-year progress and set future goals with the Half-Year Business Review Template available on Template.net. This editable and customizable template helps you analyze performance, achievements, and areas for improvement. Utilize our AI Editor Tool to refine your review, ensuring a thorough and professional mid-year business assessment. Try it now!
You may also like
Half-Year Business Review
I. Executive Summary Purpose : Provide an overview of the business performance and key achievements for the first half of 2050.
Scope : Analysis of financial performance, operational efficiency, market position, and strategic initiatives.
Key Highlights :
II. Financial Performance Metric
Current Period
Previous Period
Change
Total Revenue
$24 million
$21.4 million
+12%
Net Profit Margin
18%
15%
+3%
Gross Profit Margin
30%
28%
+2%
Operating Expenses
$6 million
$5.5 million
+$500,000
Cash Flow
$2.5 million
$1.8 million
+$700,000
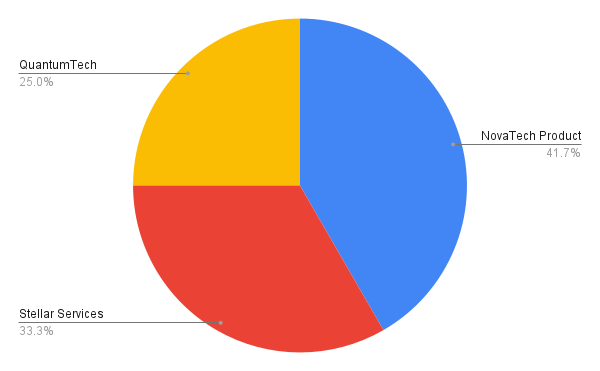
Revenue Breakdown :[Your Company Name] Product Line: $10 million (42%)
Stellar Services: $8 million (33%)
QuantumTech Product Line: $6 million (25%)
Budget Variance :
III. Operational Efficiency Production/Service Delivery :Production efficiency improved by 8%, reducing production time from 10 days to 9 days per unit.
Service delivery times improved from 72 hours to 48 hours.
Supply Chain Management :Supply chain performance enhanced with a 5% reduction in material costs.
Challenges included delays in raw material shipments, resolved through alternative sourcing strategies.
Technology and Infrastructure :Upgraded IT systems with new ERP software, increasing operational efficiency by 15%.
New data center established, enhancing system reliability.
IV. Market Position Region
Revenue
North America
$12 million
Europe
$8 million
Asia-Pacific
$4 million
Market Share :Increased by 2%, now at 18%.
Key competitors: Zenith Corp (25% market share), Orion Inc. (20% market share).
Customer Insights :Marketing and Sales Performance :
V. Strategic Initiatives Major Projects :[Your Company Name] product line launched in January 2050, achieving $10 million in sales within six months.
Expansion into the European market with new distribution centers.
New Product/Service Launches :QuantumTech Smart Widget introduced in March 2050, generating $3 million in sales.
Positive market reception with strong customer reviews.
Partnerships and Alliances :
VI. Risk Management Identified Risks :Compliance and Regulatory Issues :
VII. Future Outlook Short-Term Goals :Long-Term Strategy :Recommendations :
VIII. Conclusion Summary of Findings : The first half of 2050 has seen significant revenue growth, improved customer satisfaction, and strategic advancements.
Acknowledgements : Recognition of the product development and marketing teams for their contributions.
Next Steps : Prepare for a comprehensive review at the end of 2050, focusing on achieving goals and addressing emerging challenges.
Review Templates @ Template.net