Survey Design Quantitative Research
Prepared By: [YOUR NAME]
Date: [DATE]
I. Introduction
The primary aim of conducting this survey is to thoroughly evaluate the levels of satisfaction and engagement among employees within our organization. By gaining a deeper understanding of these critical factors, we can take informed steps to enhance workplace conditions, bolster employee morale, and ultimately increase overall productivity. Therefore, we highly value and depend on your participation in this survey. Please be assured that every response you provide will be treated with the utmost confidentiality.
II. Methodology
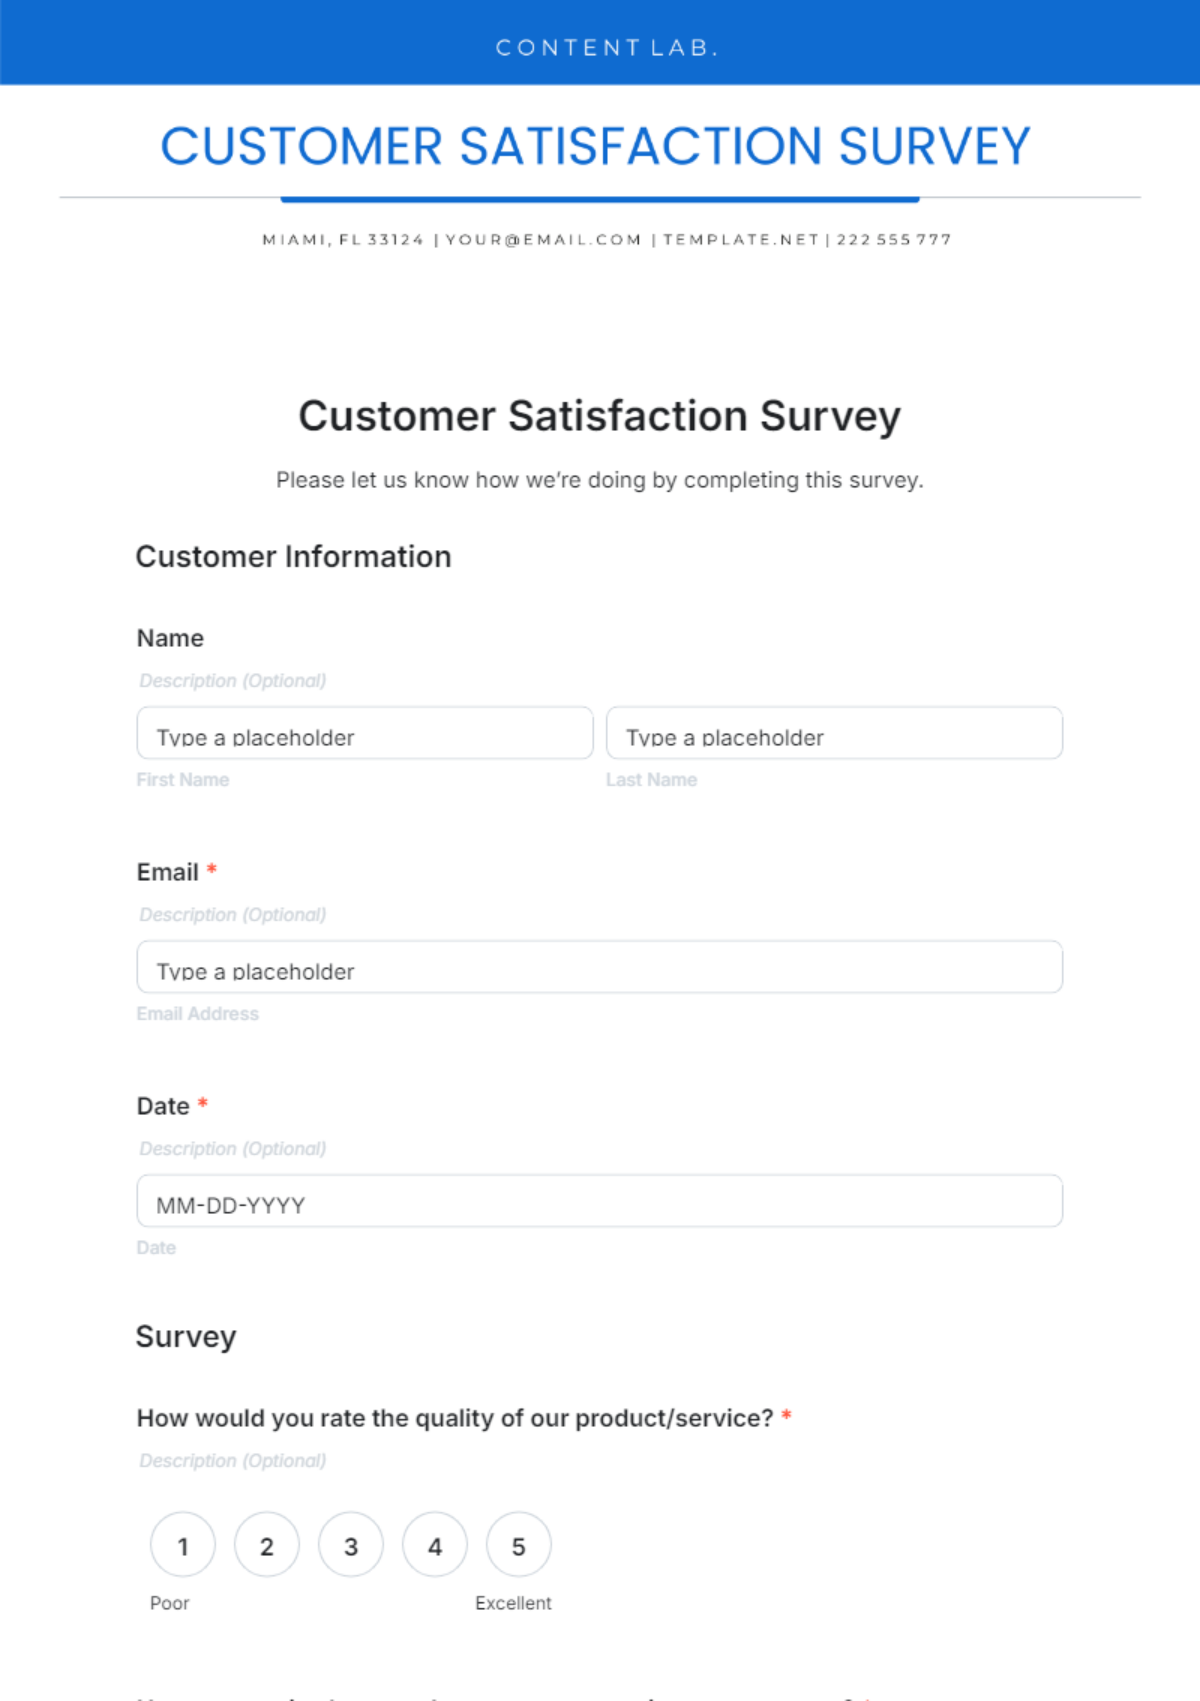
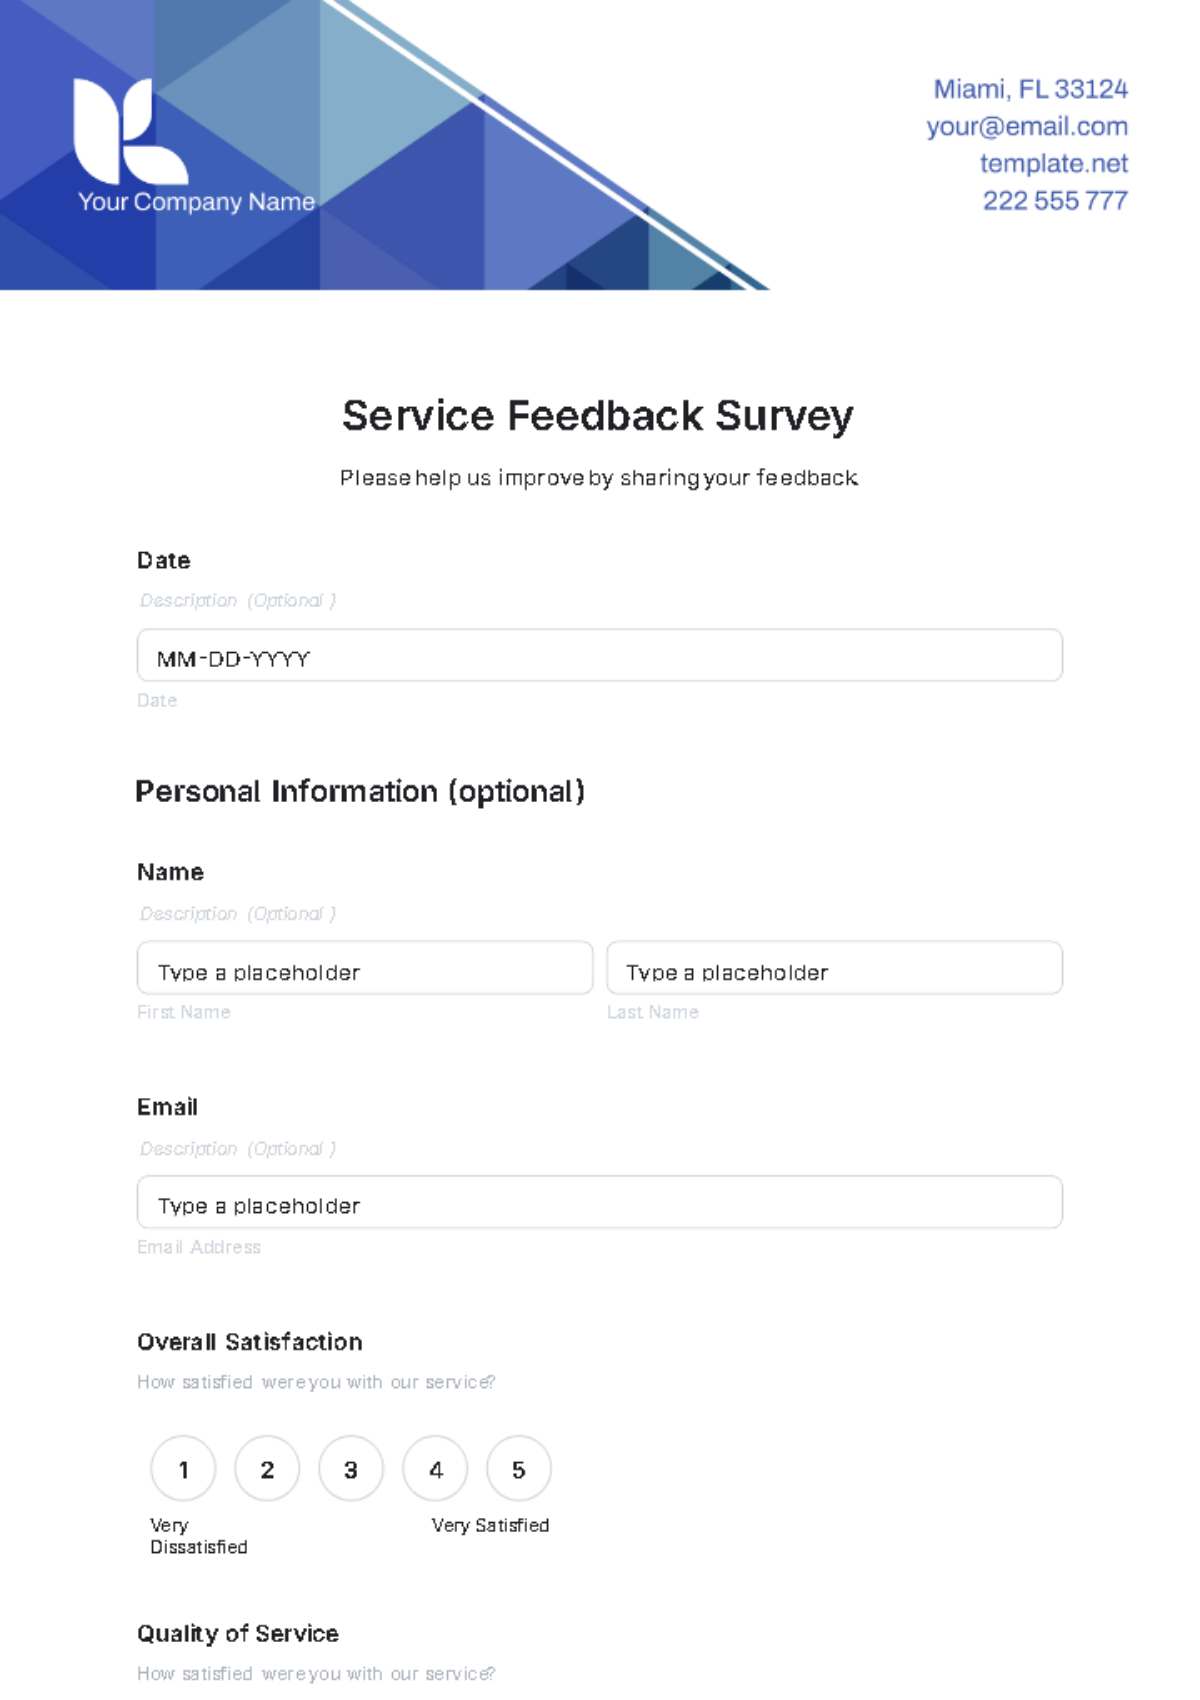
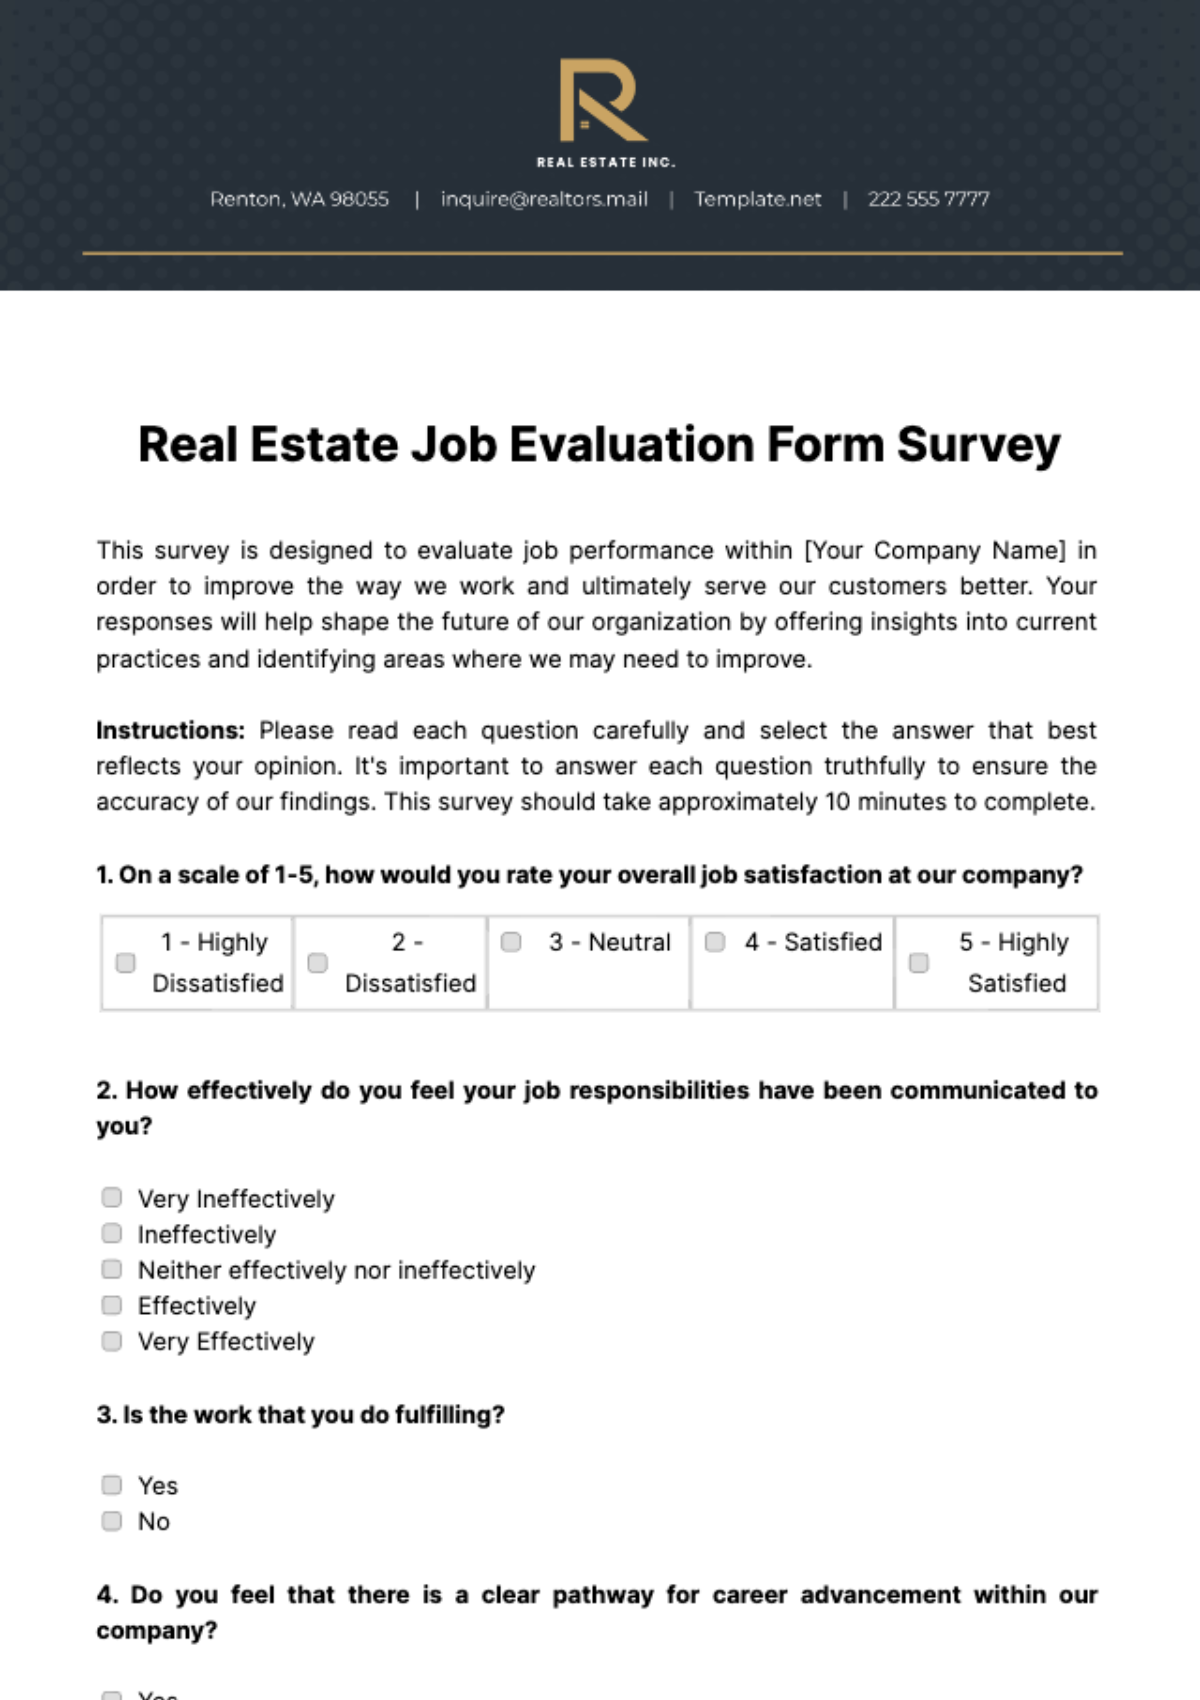
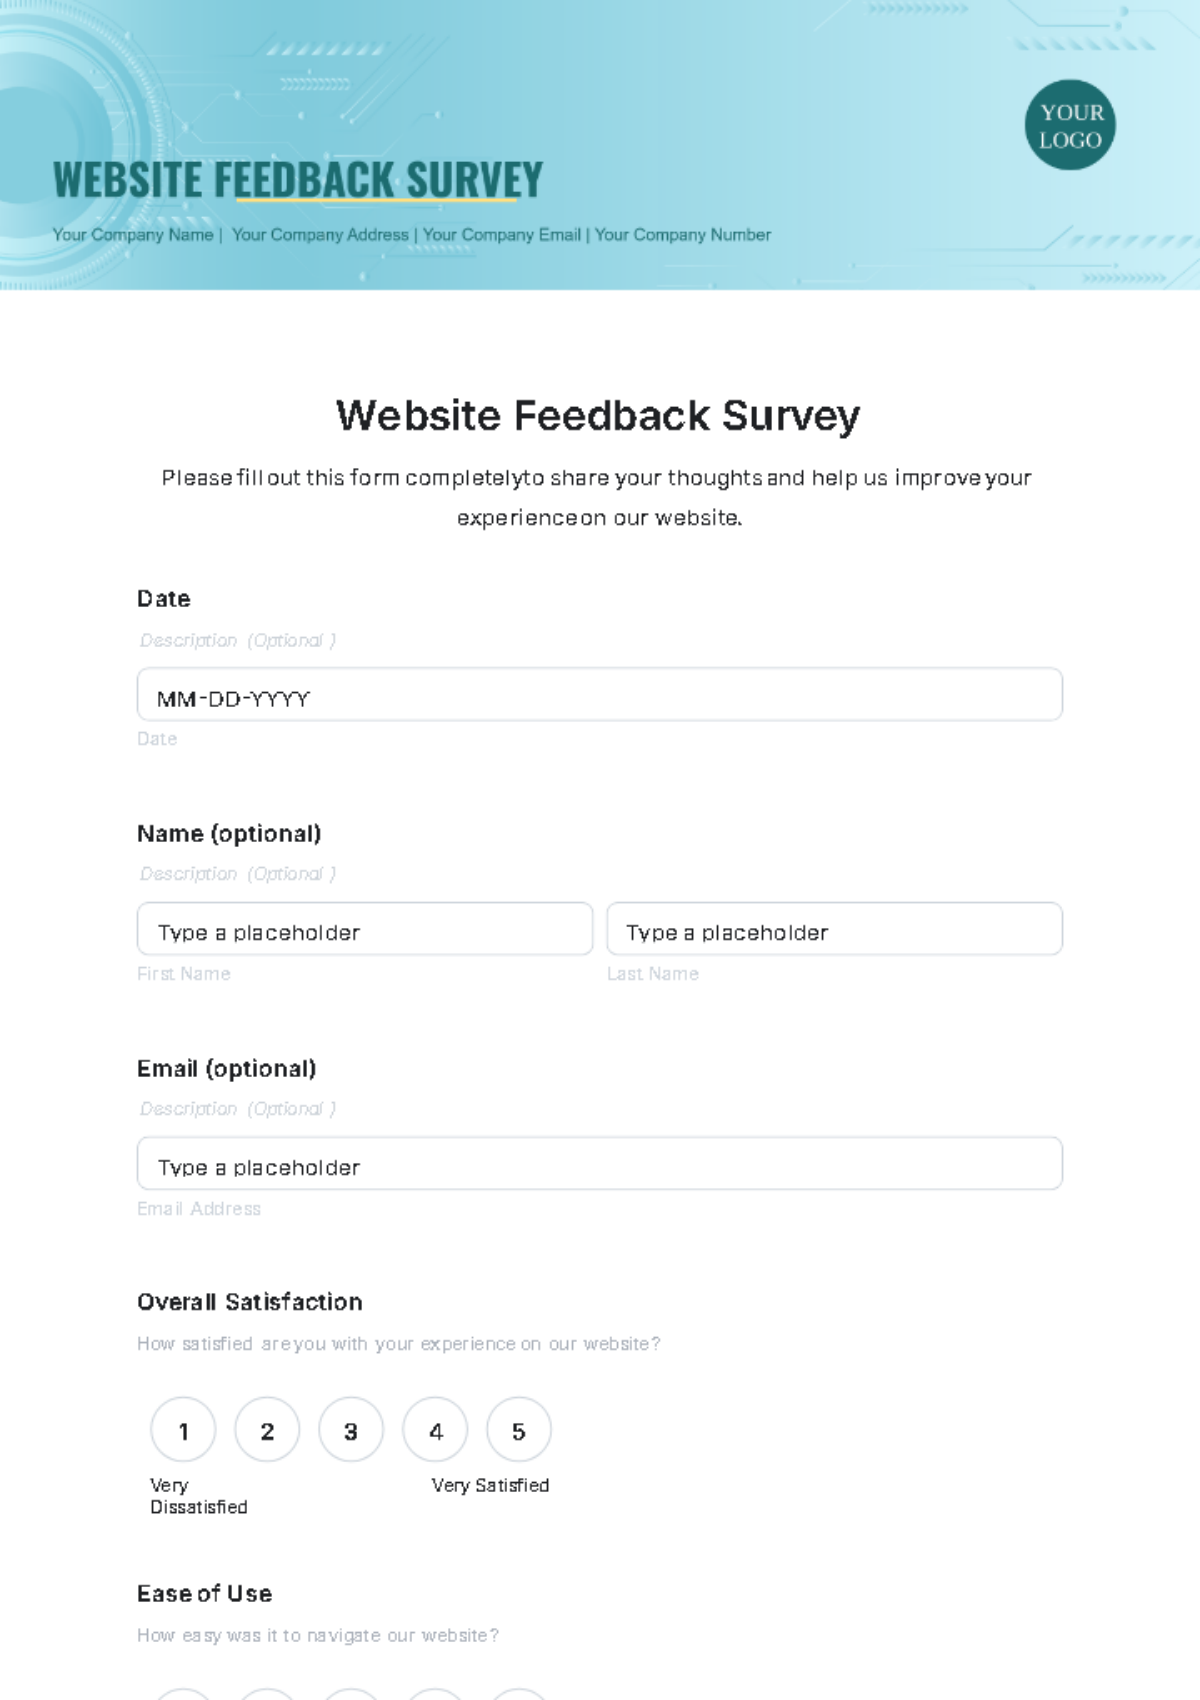
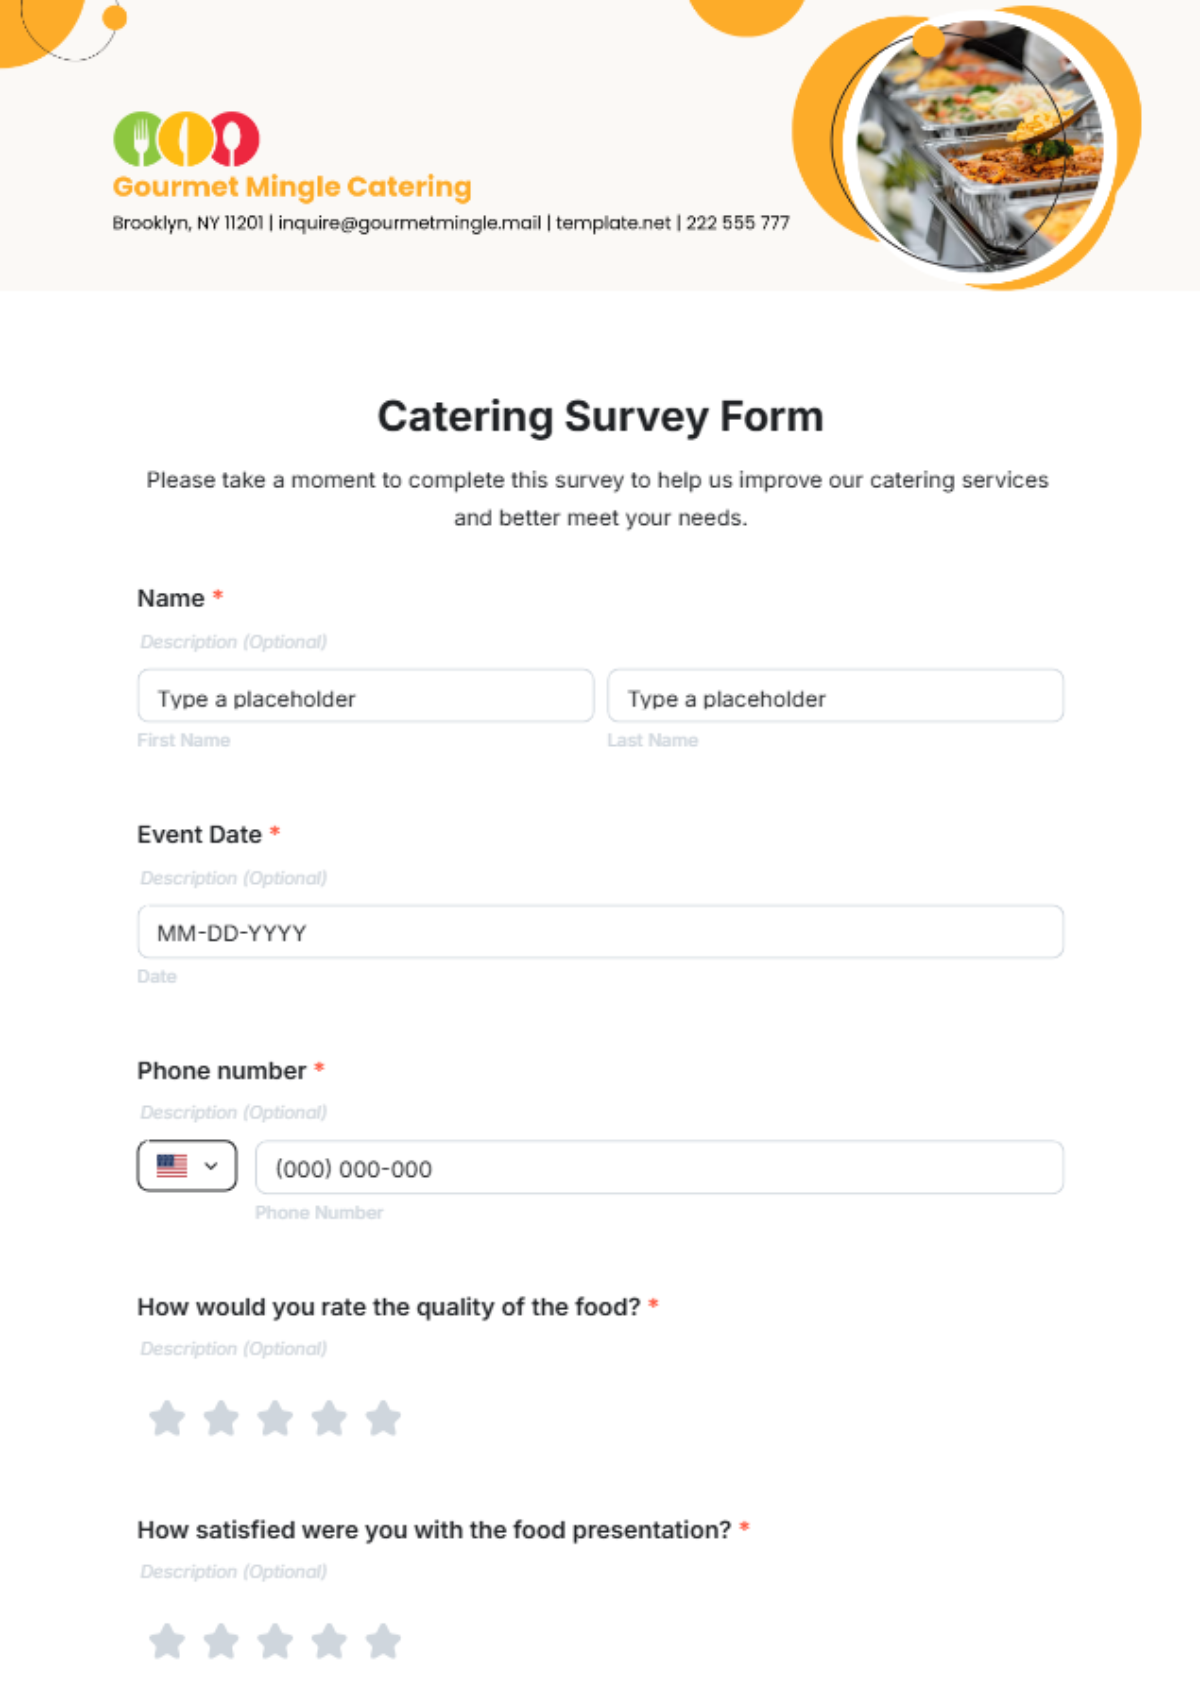
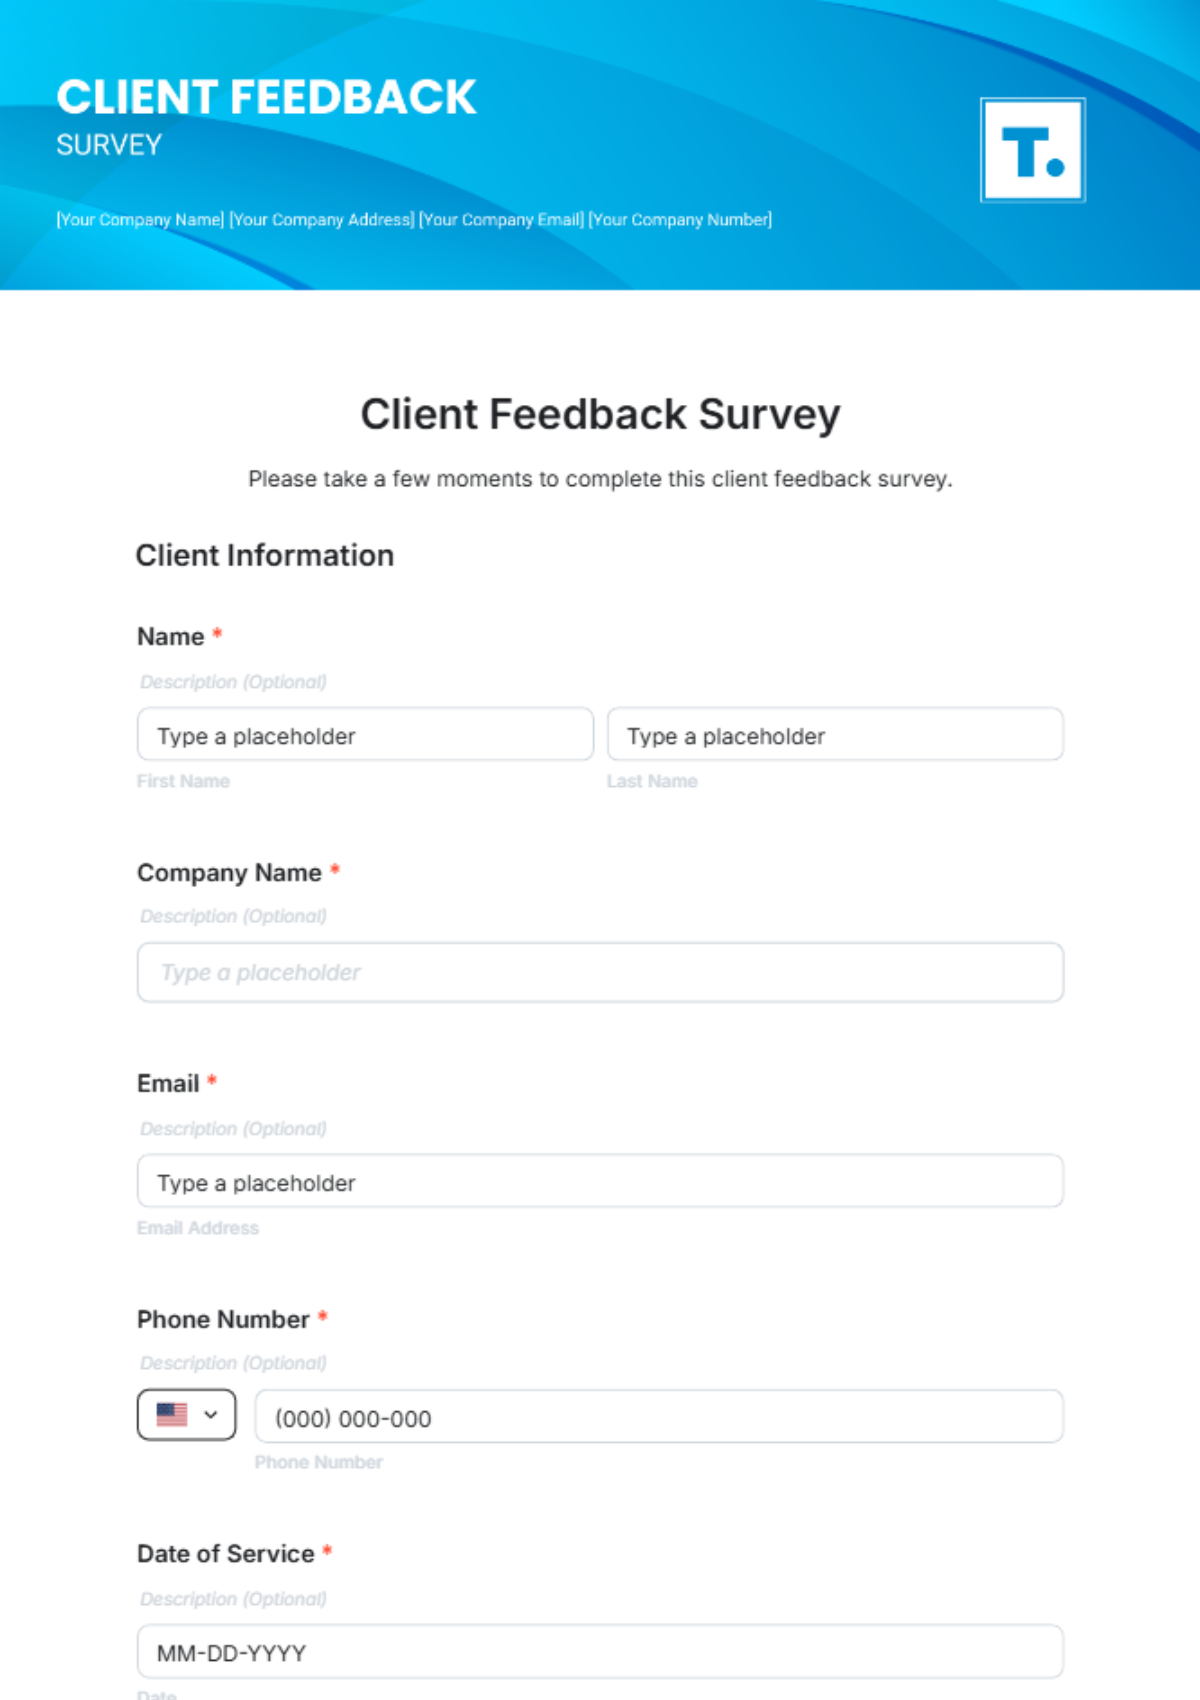
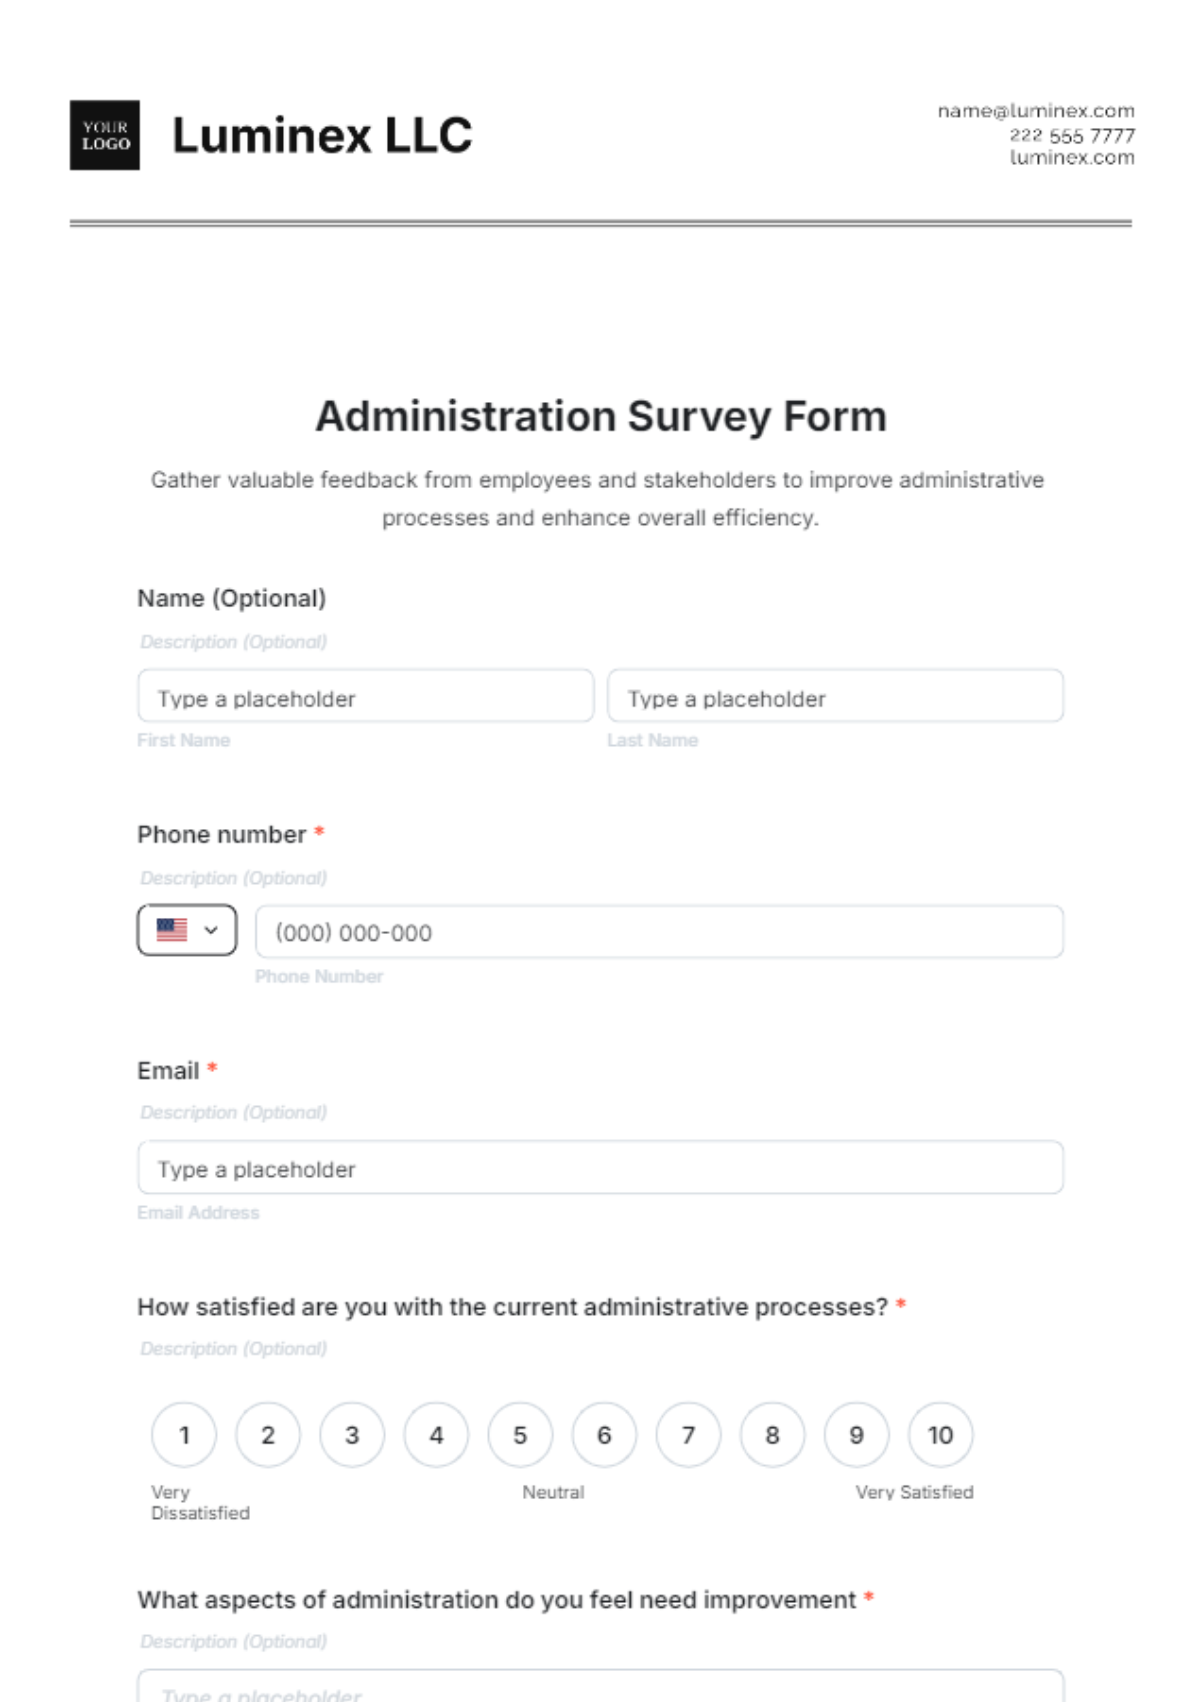
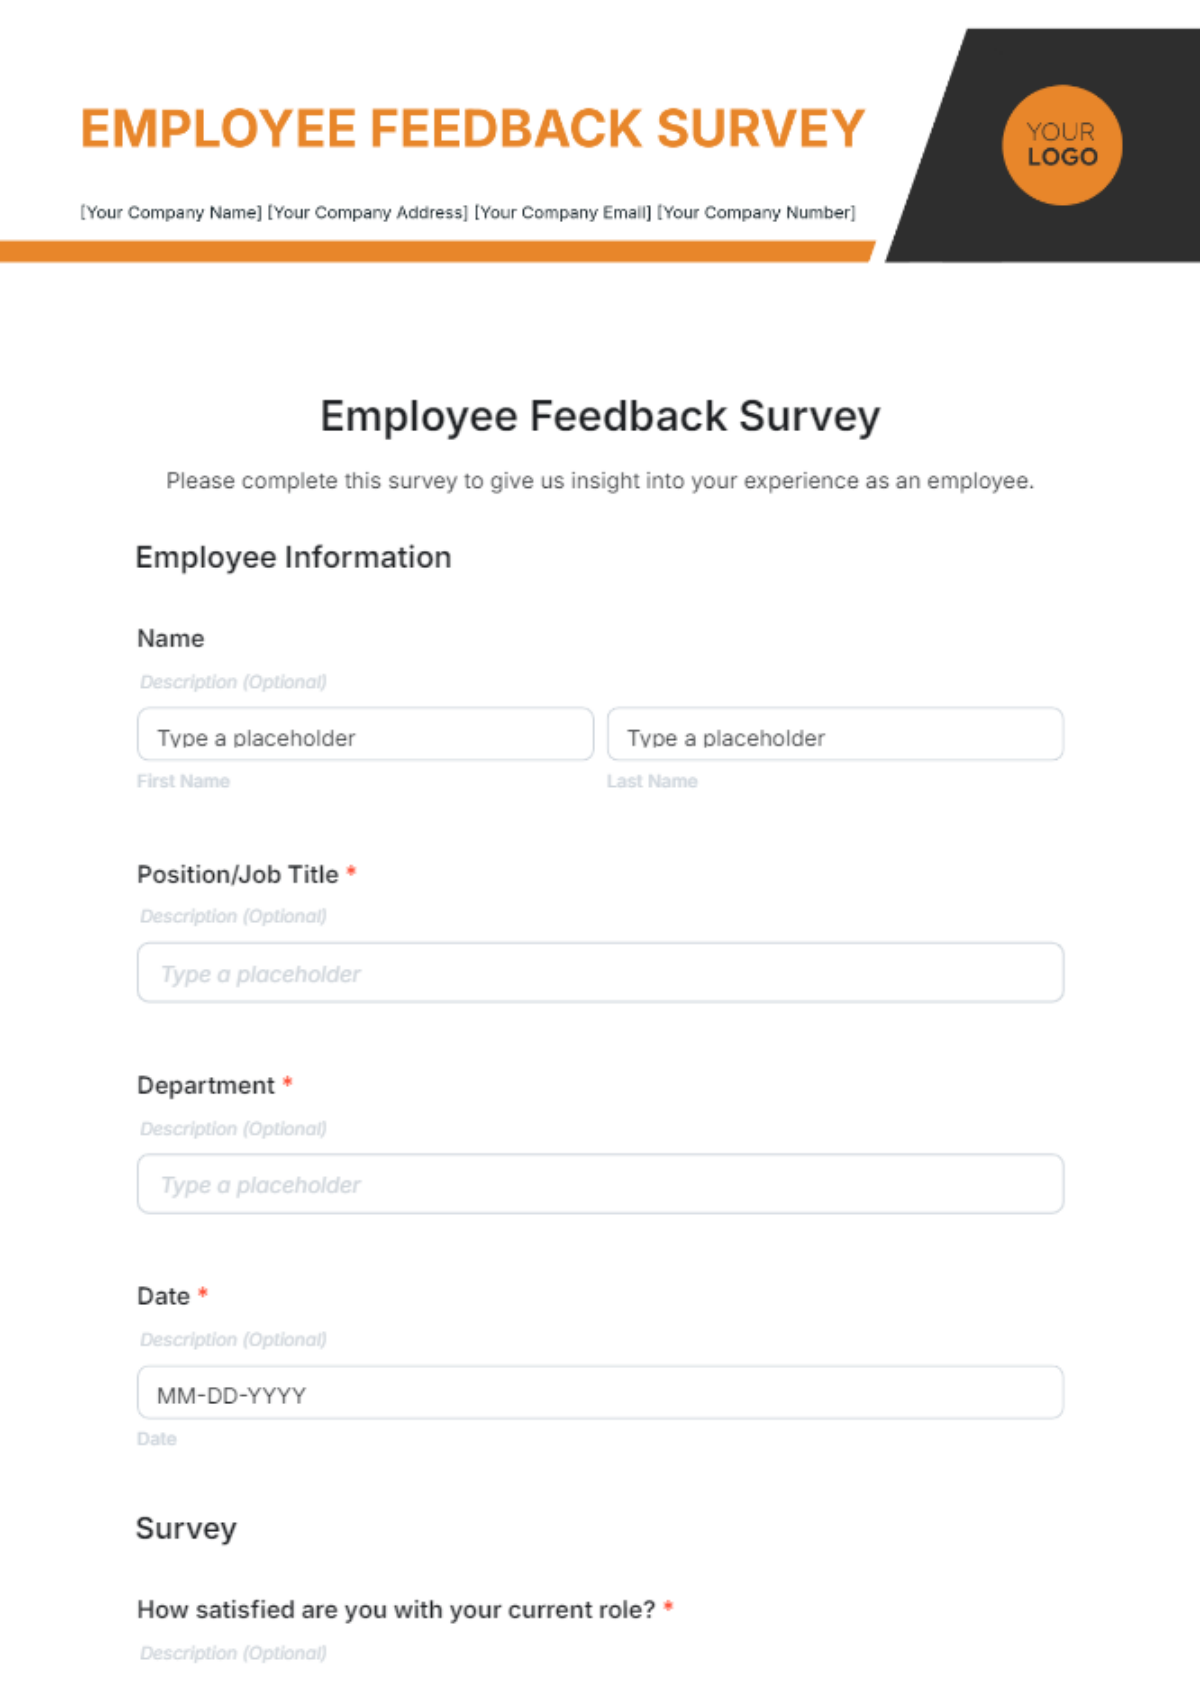
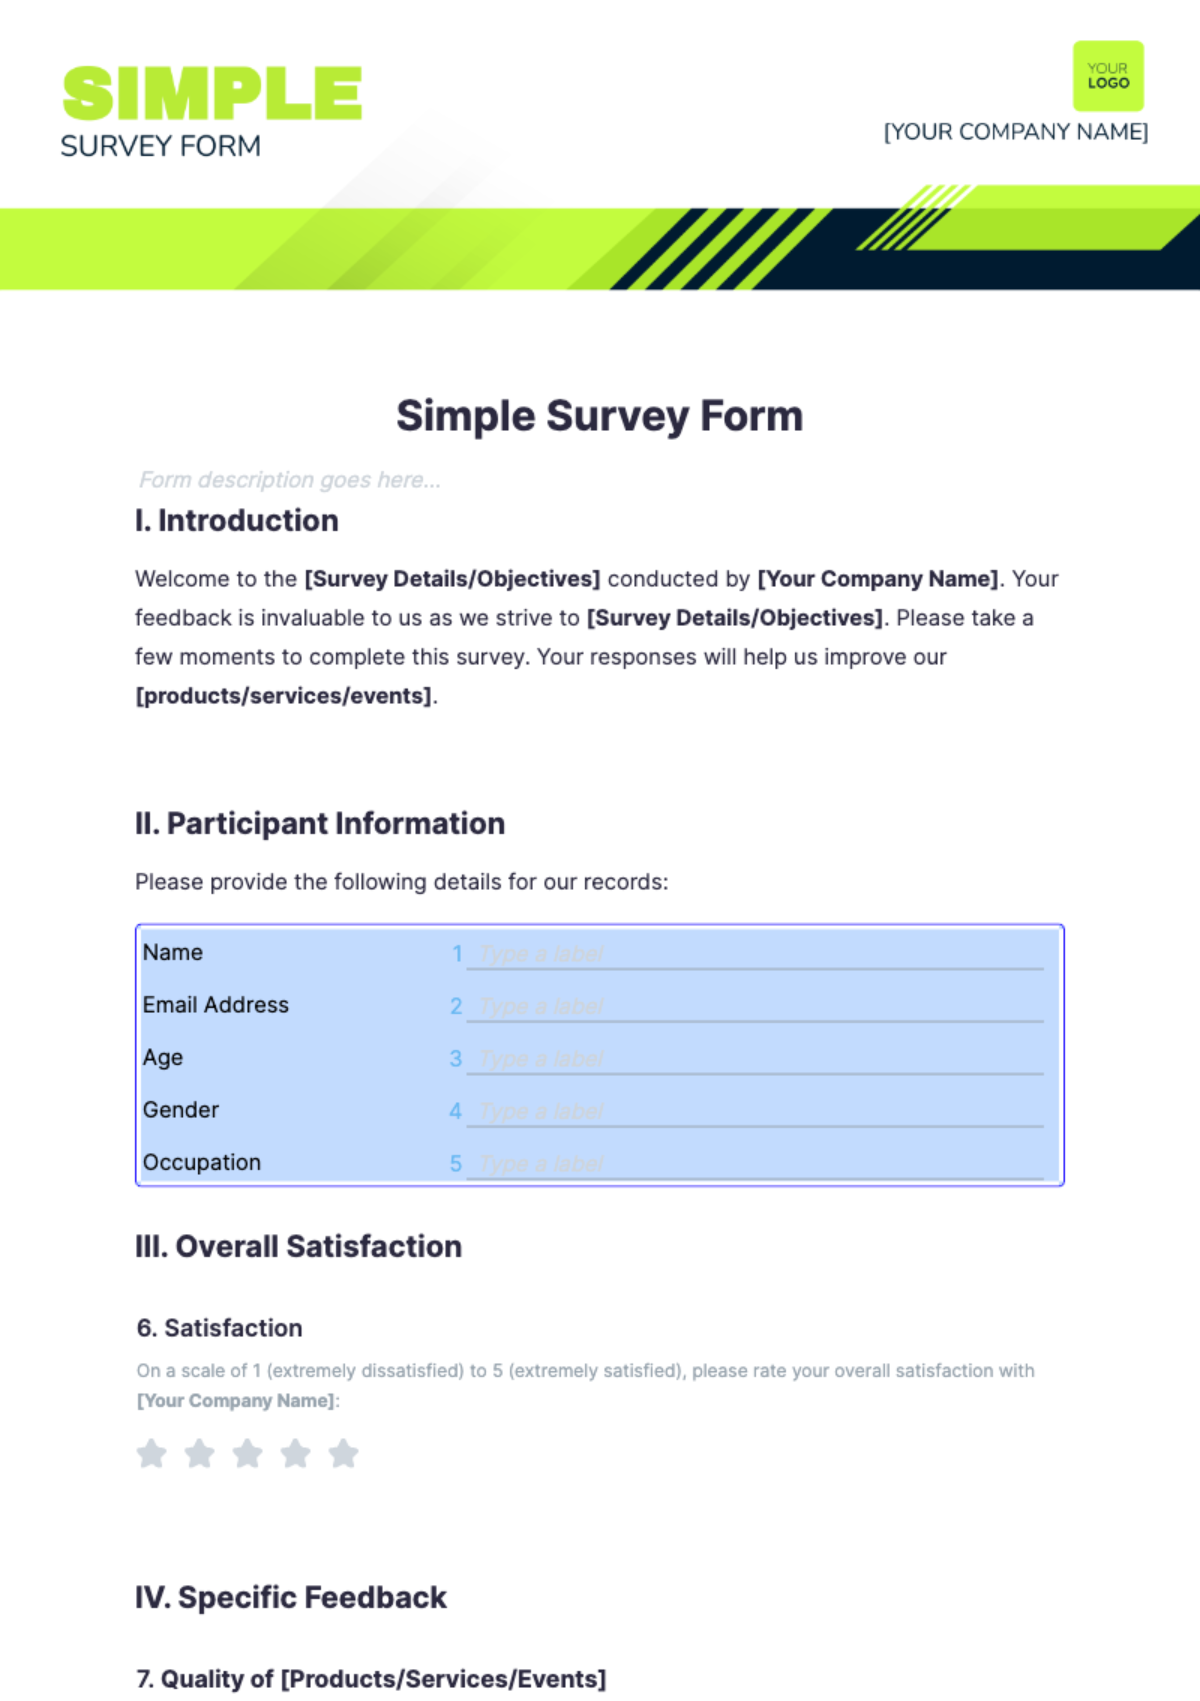
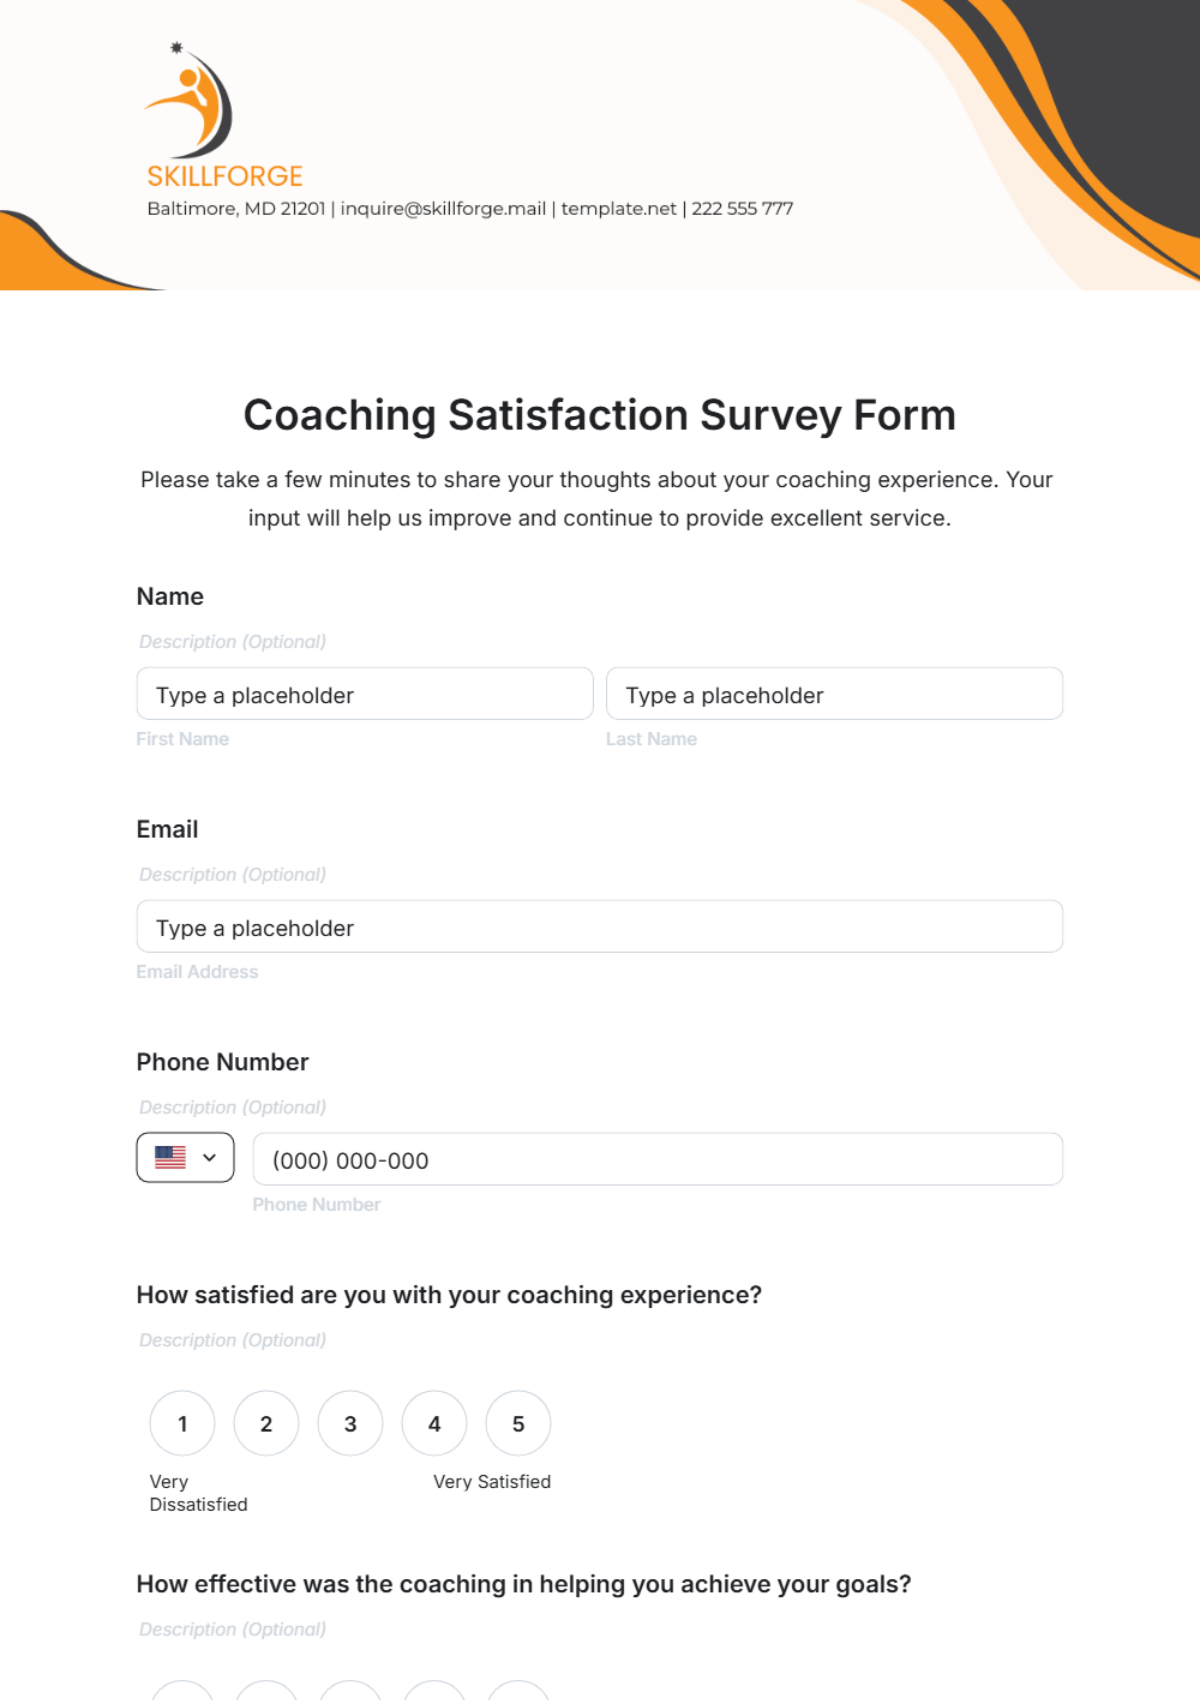
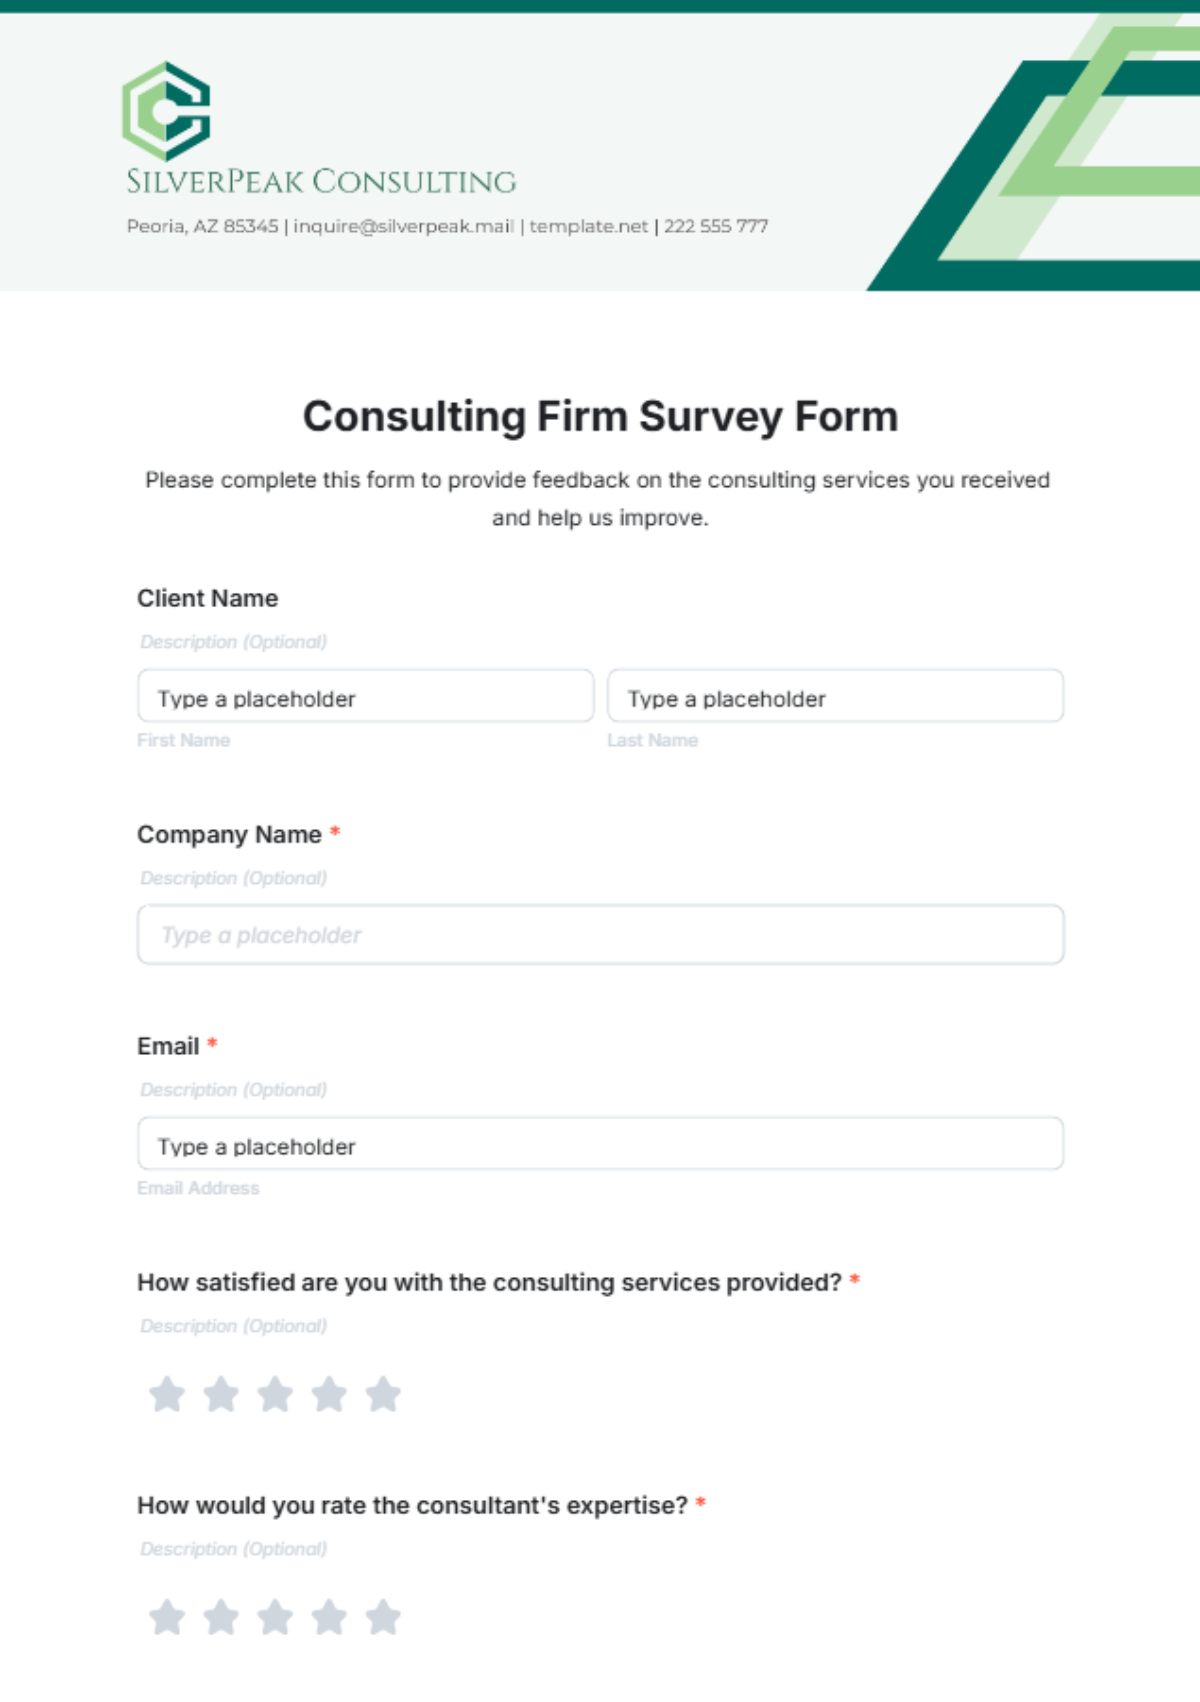
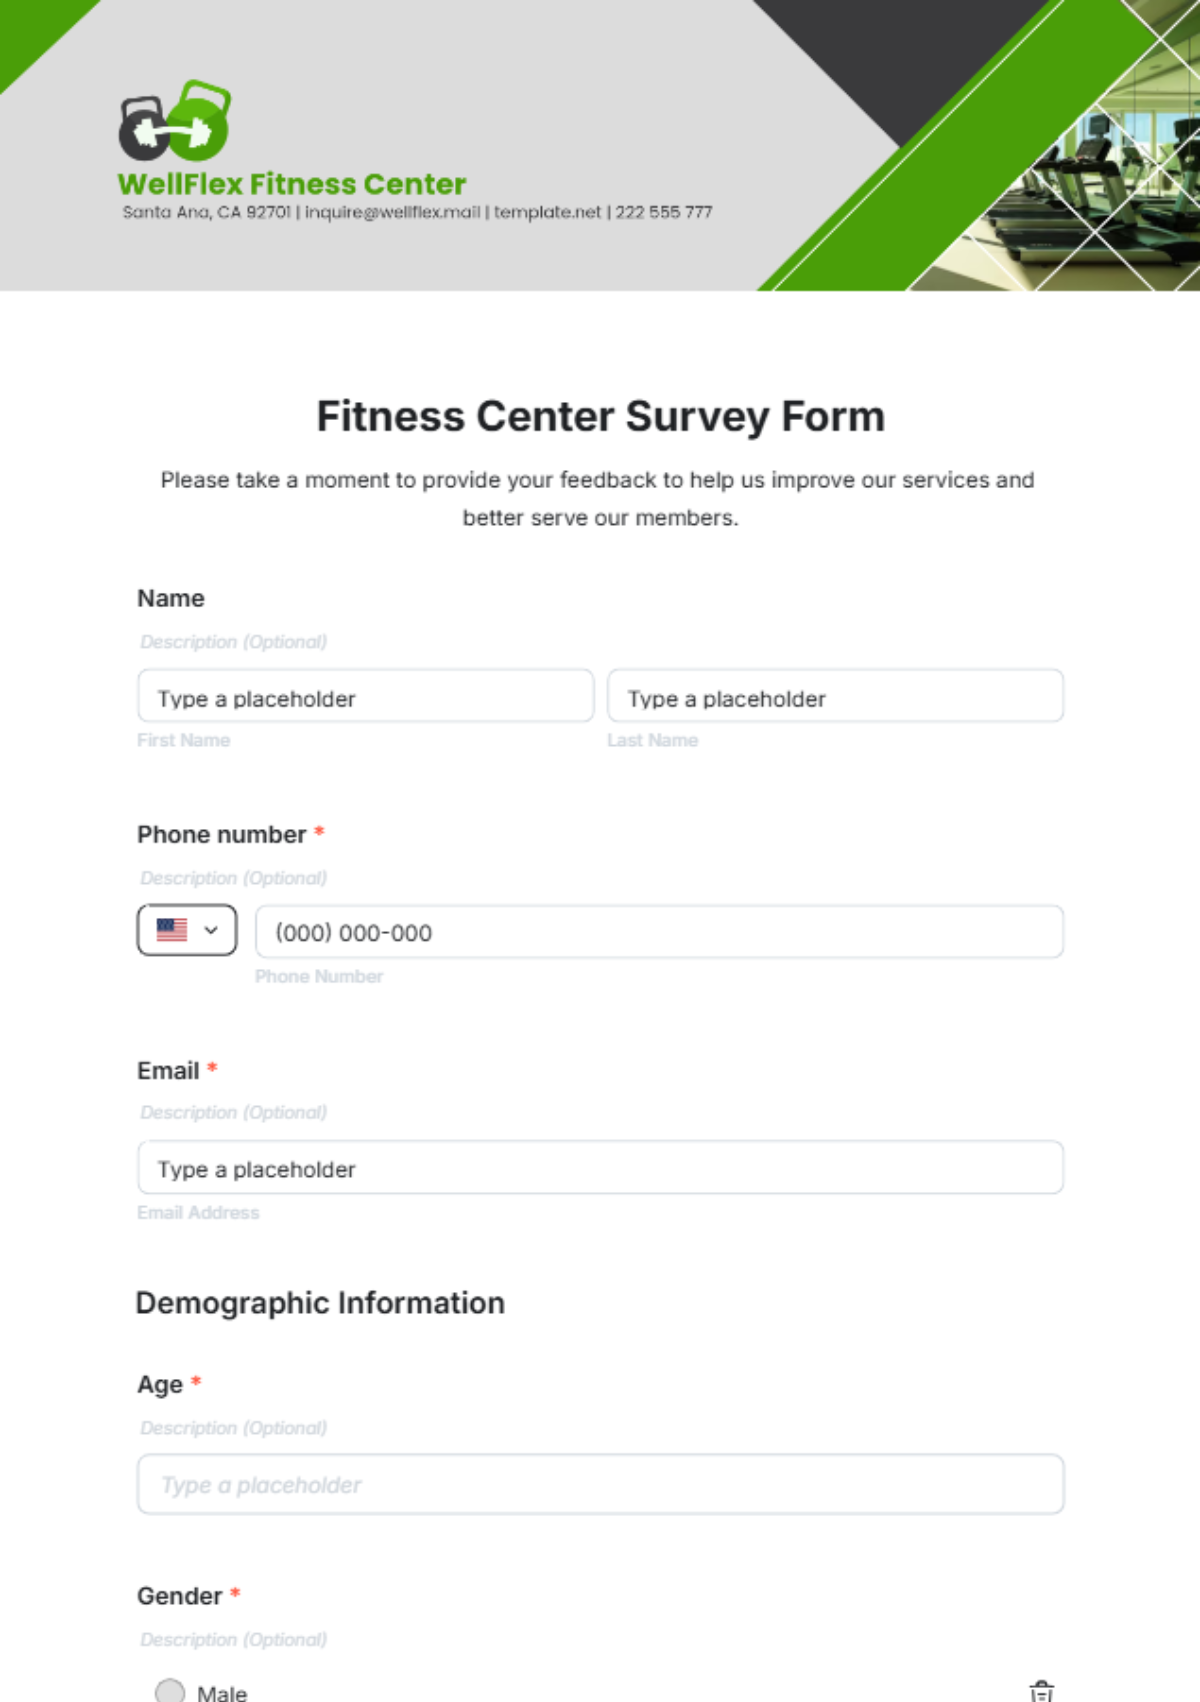
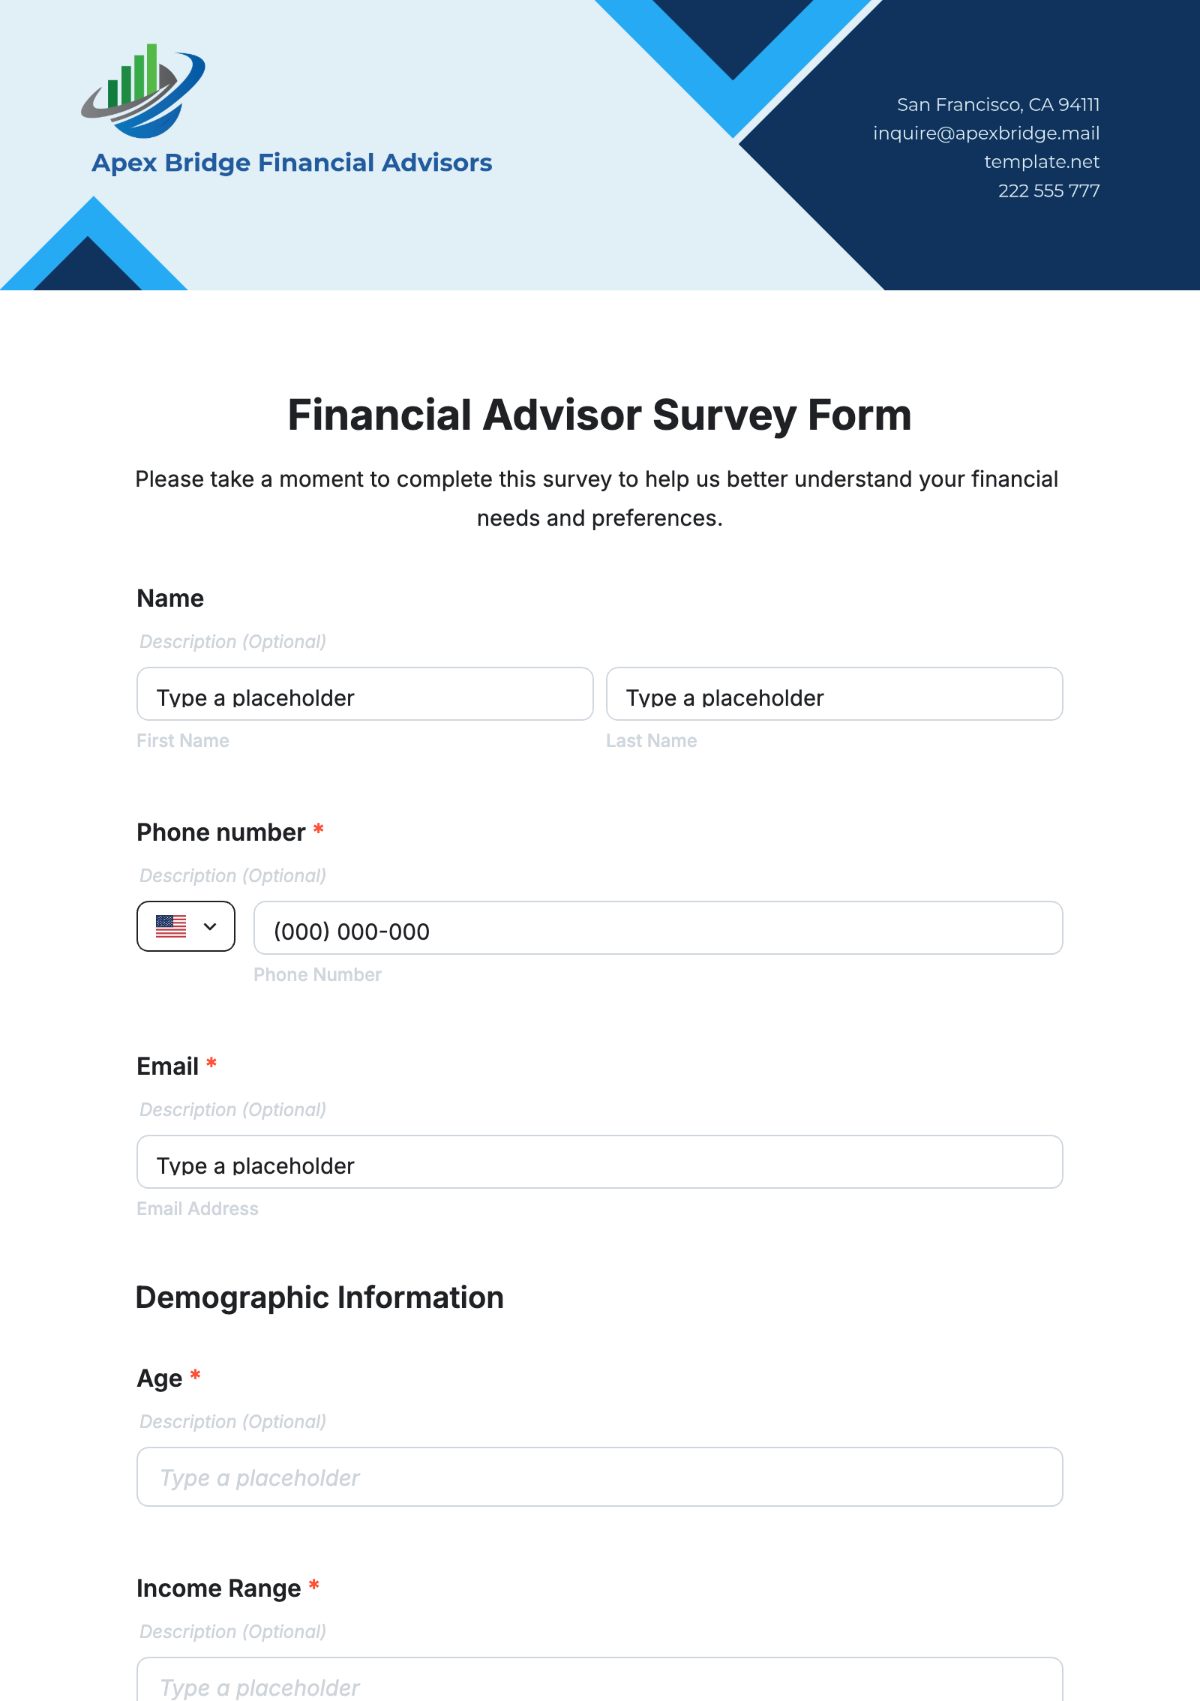
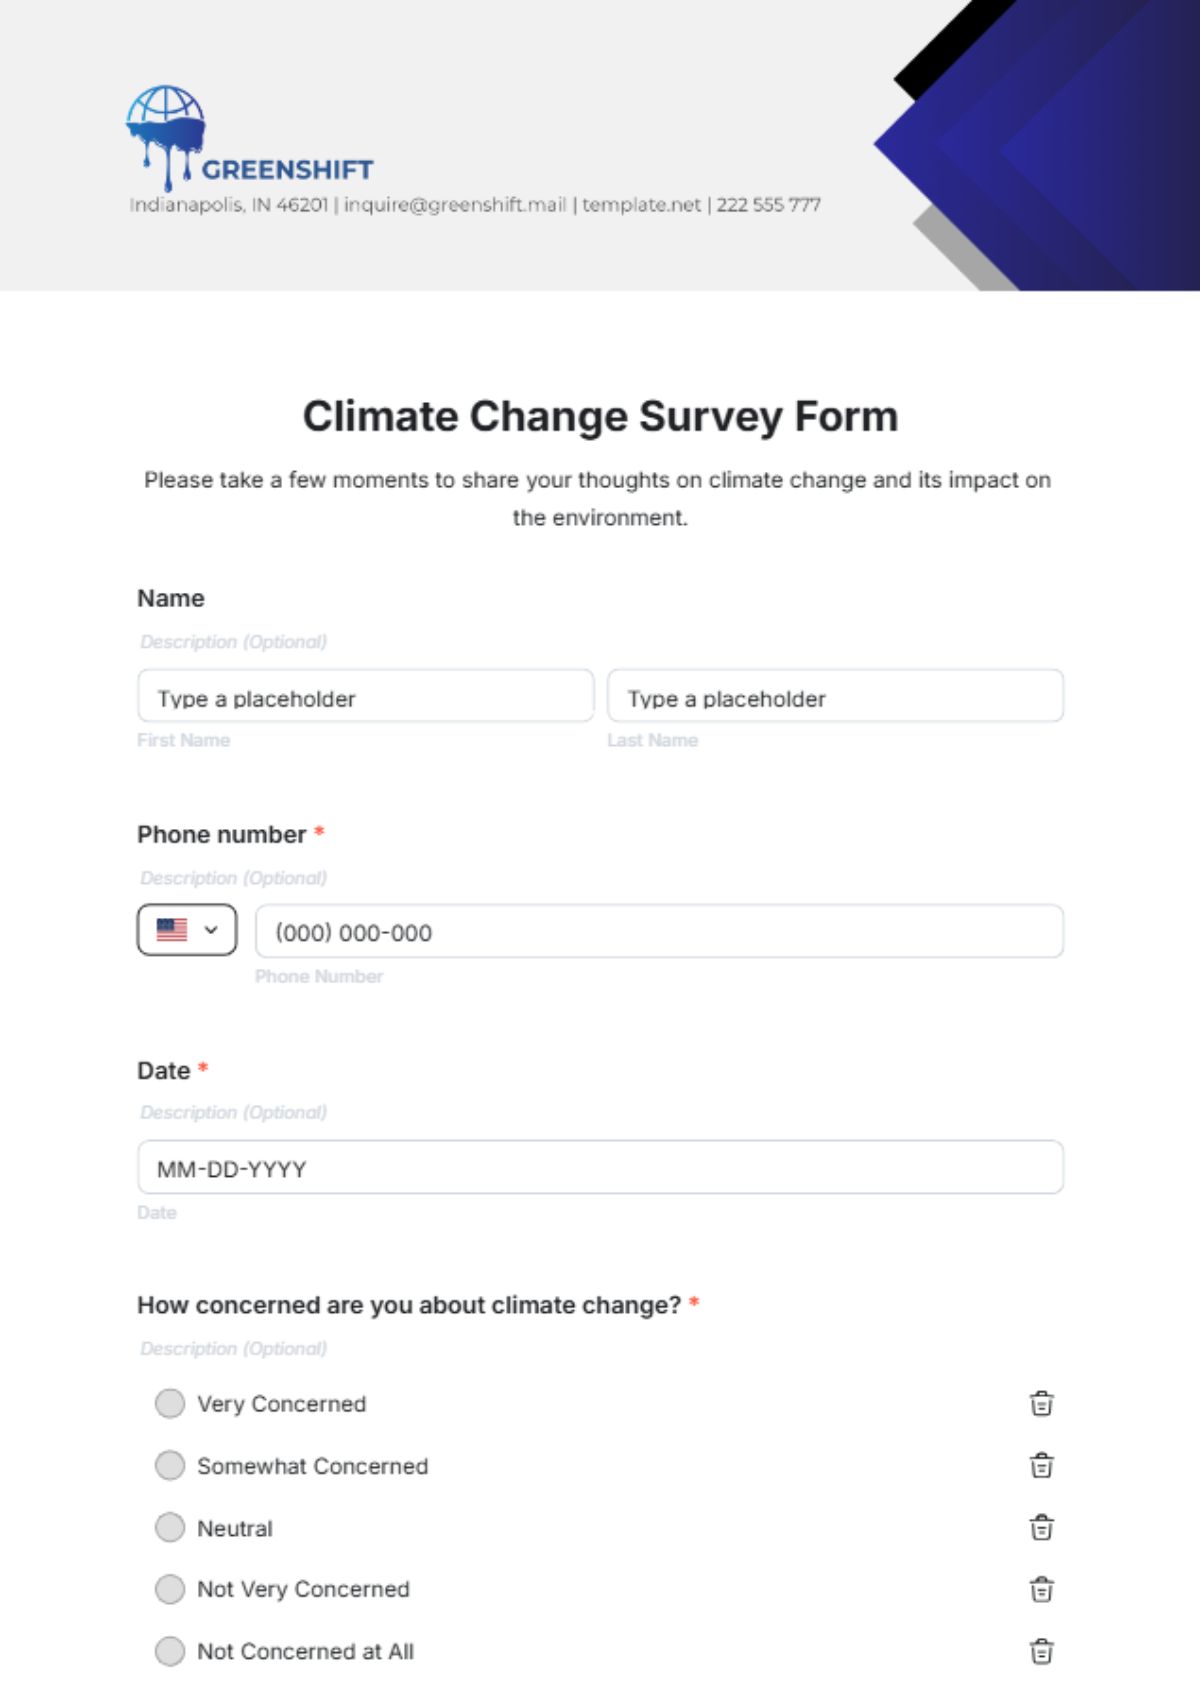
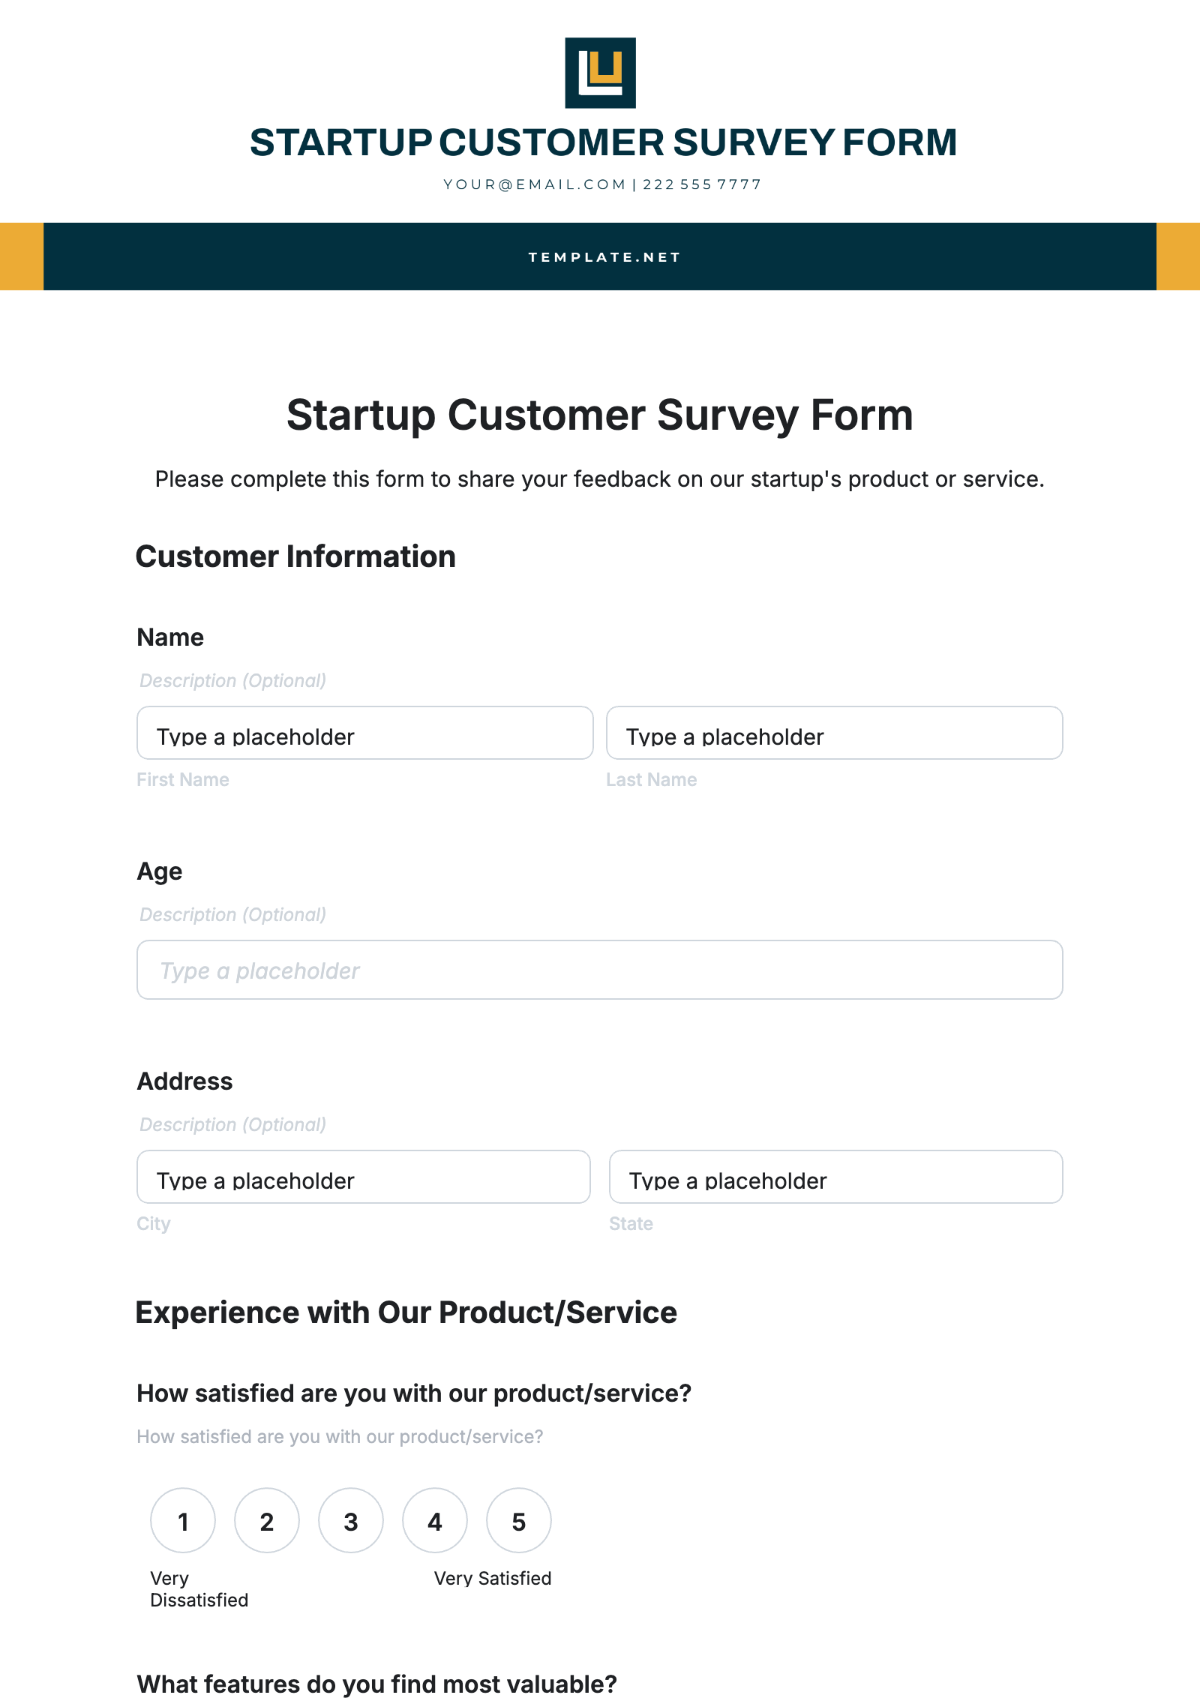
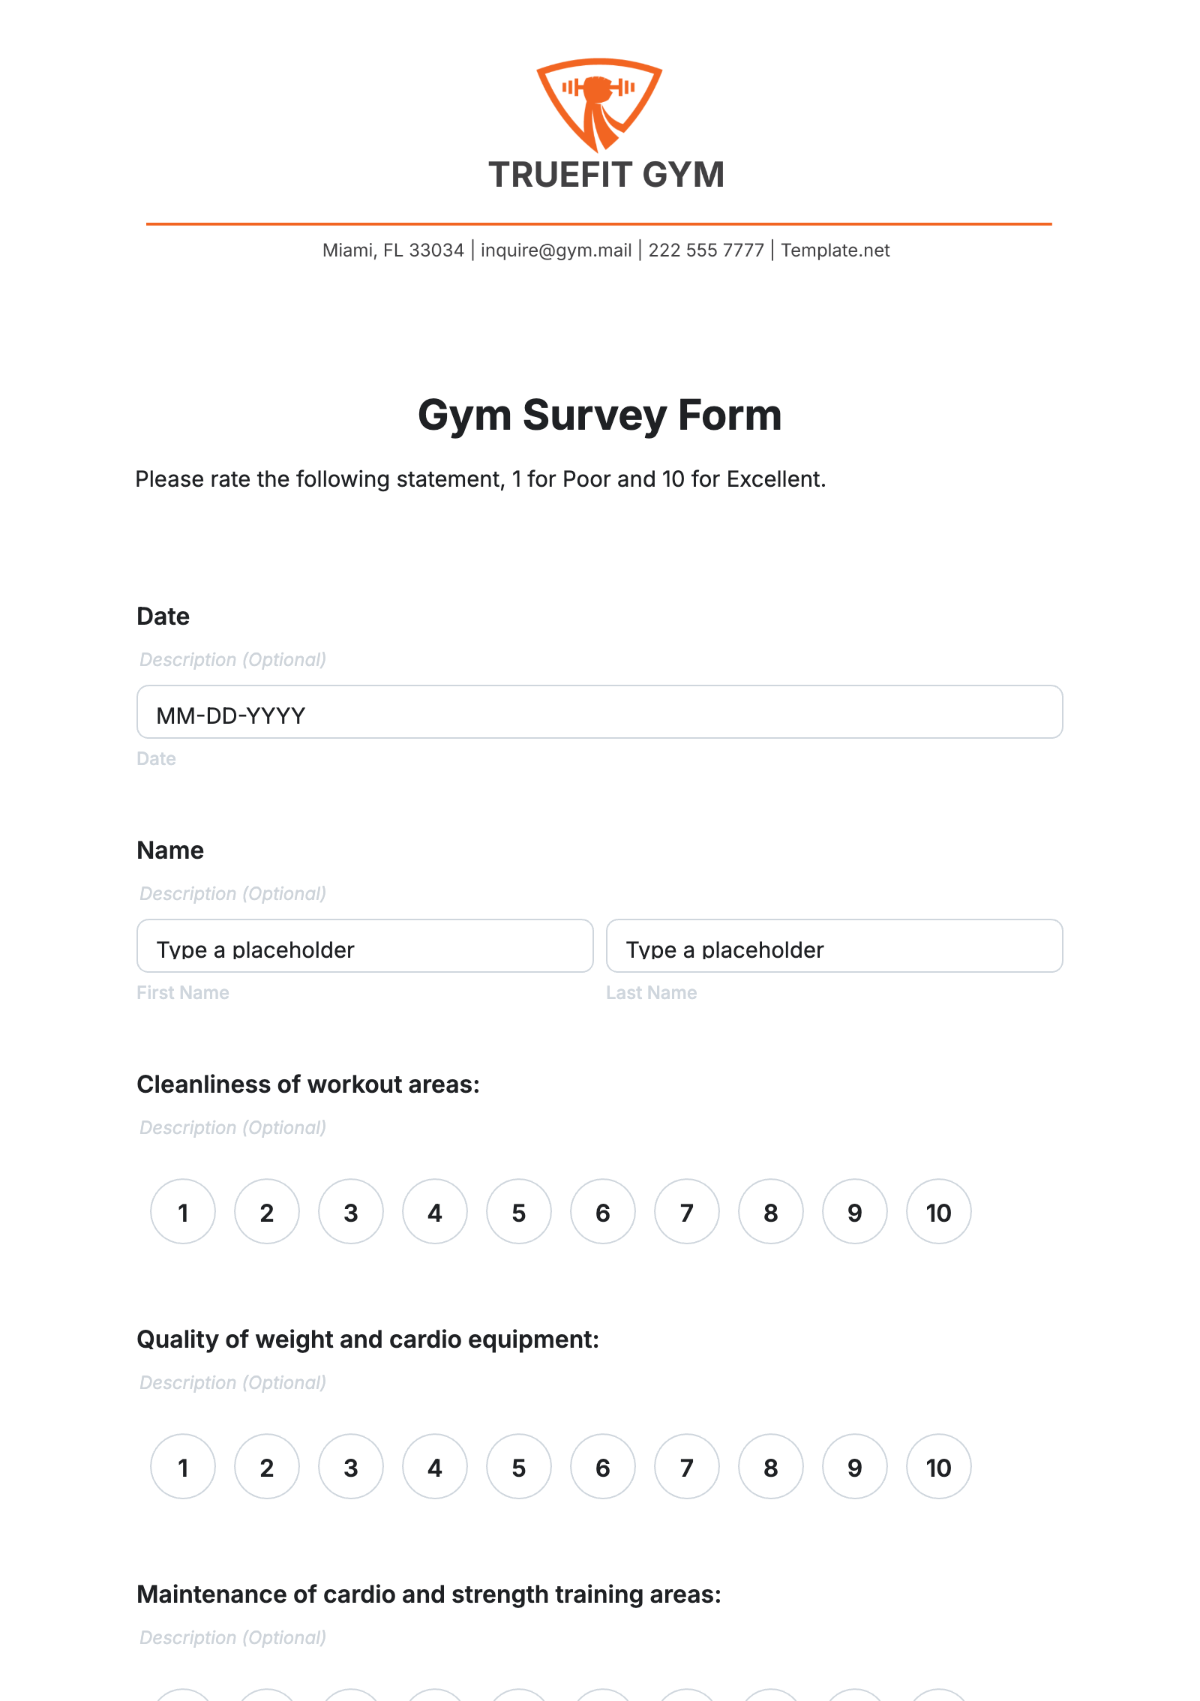
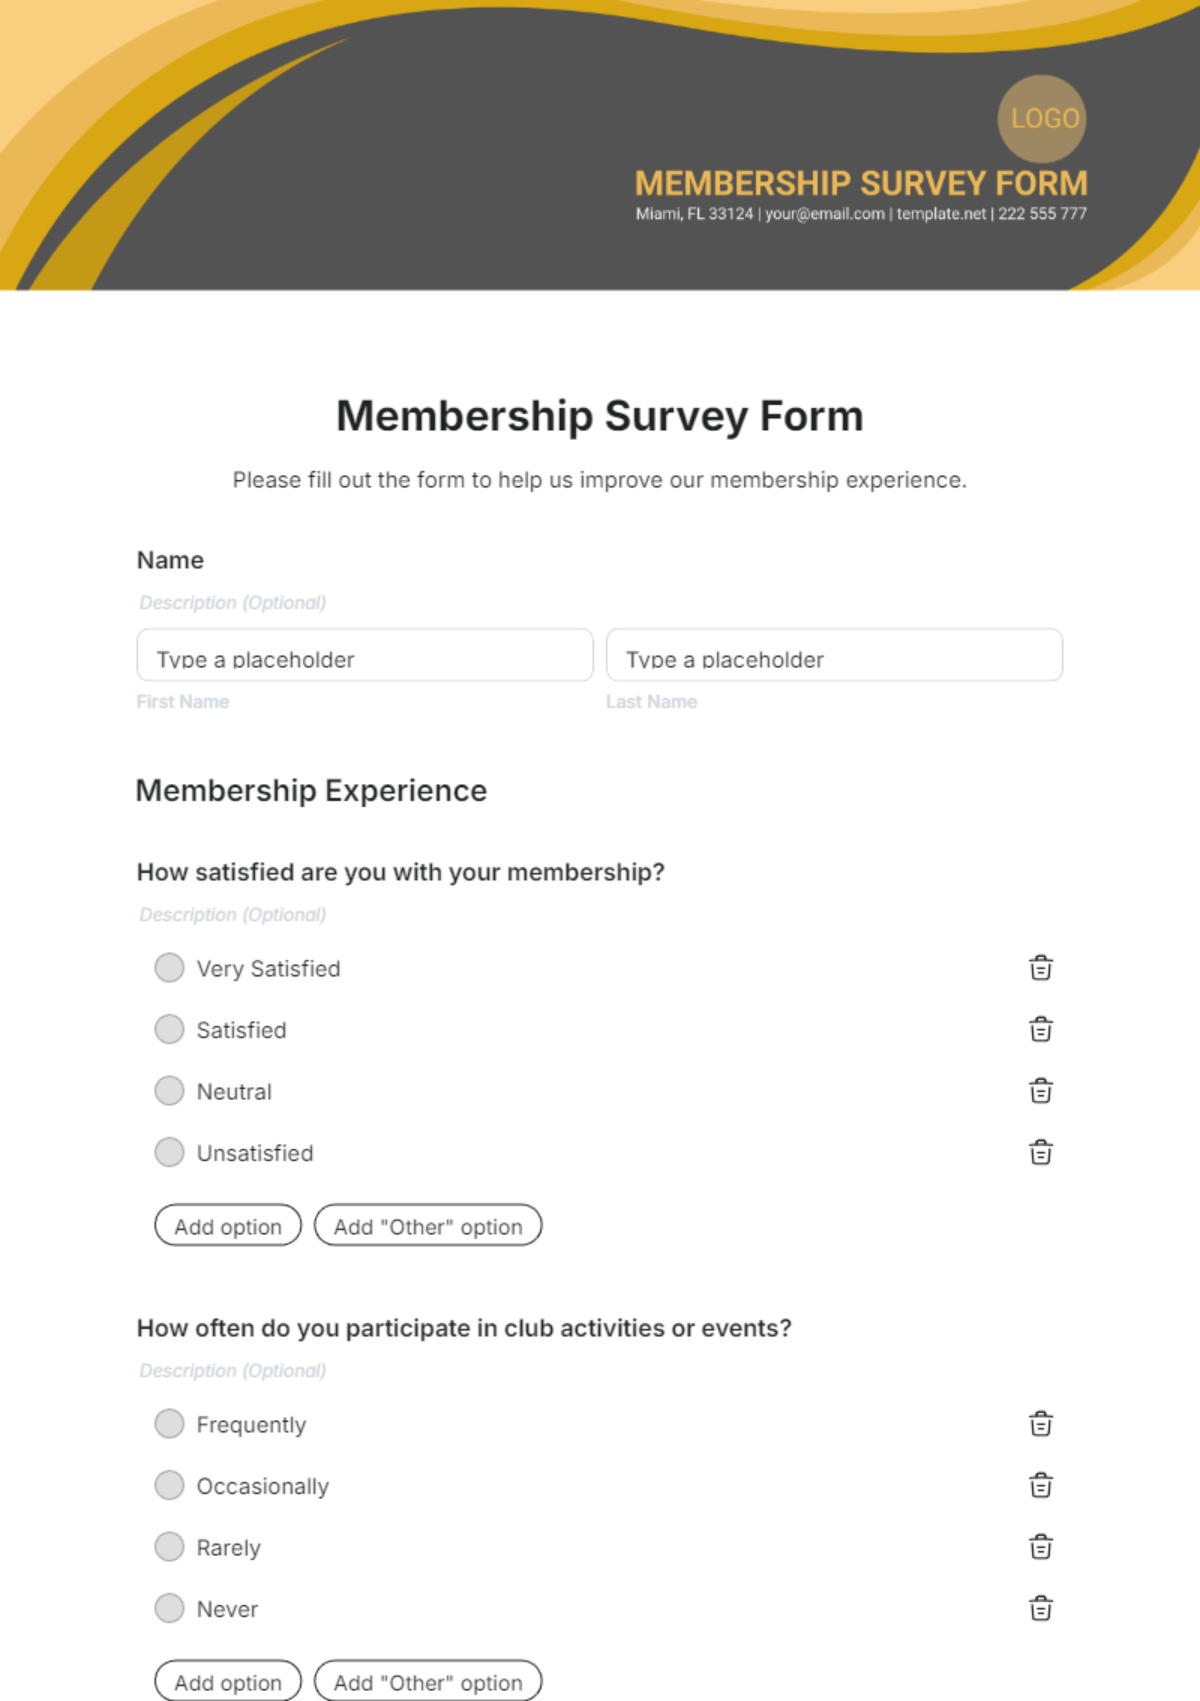
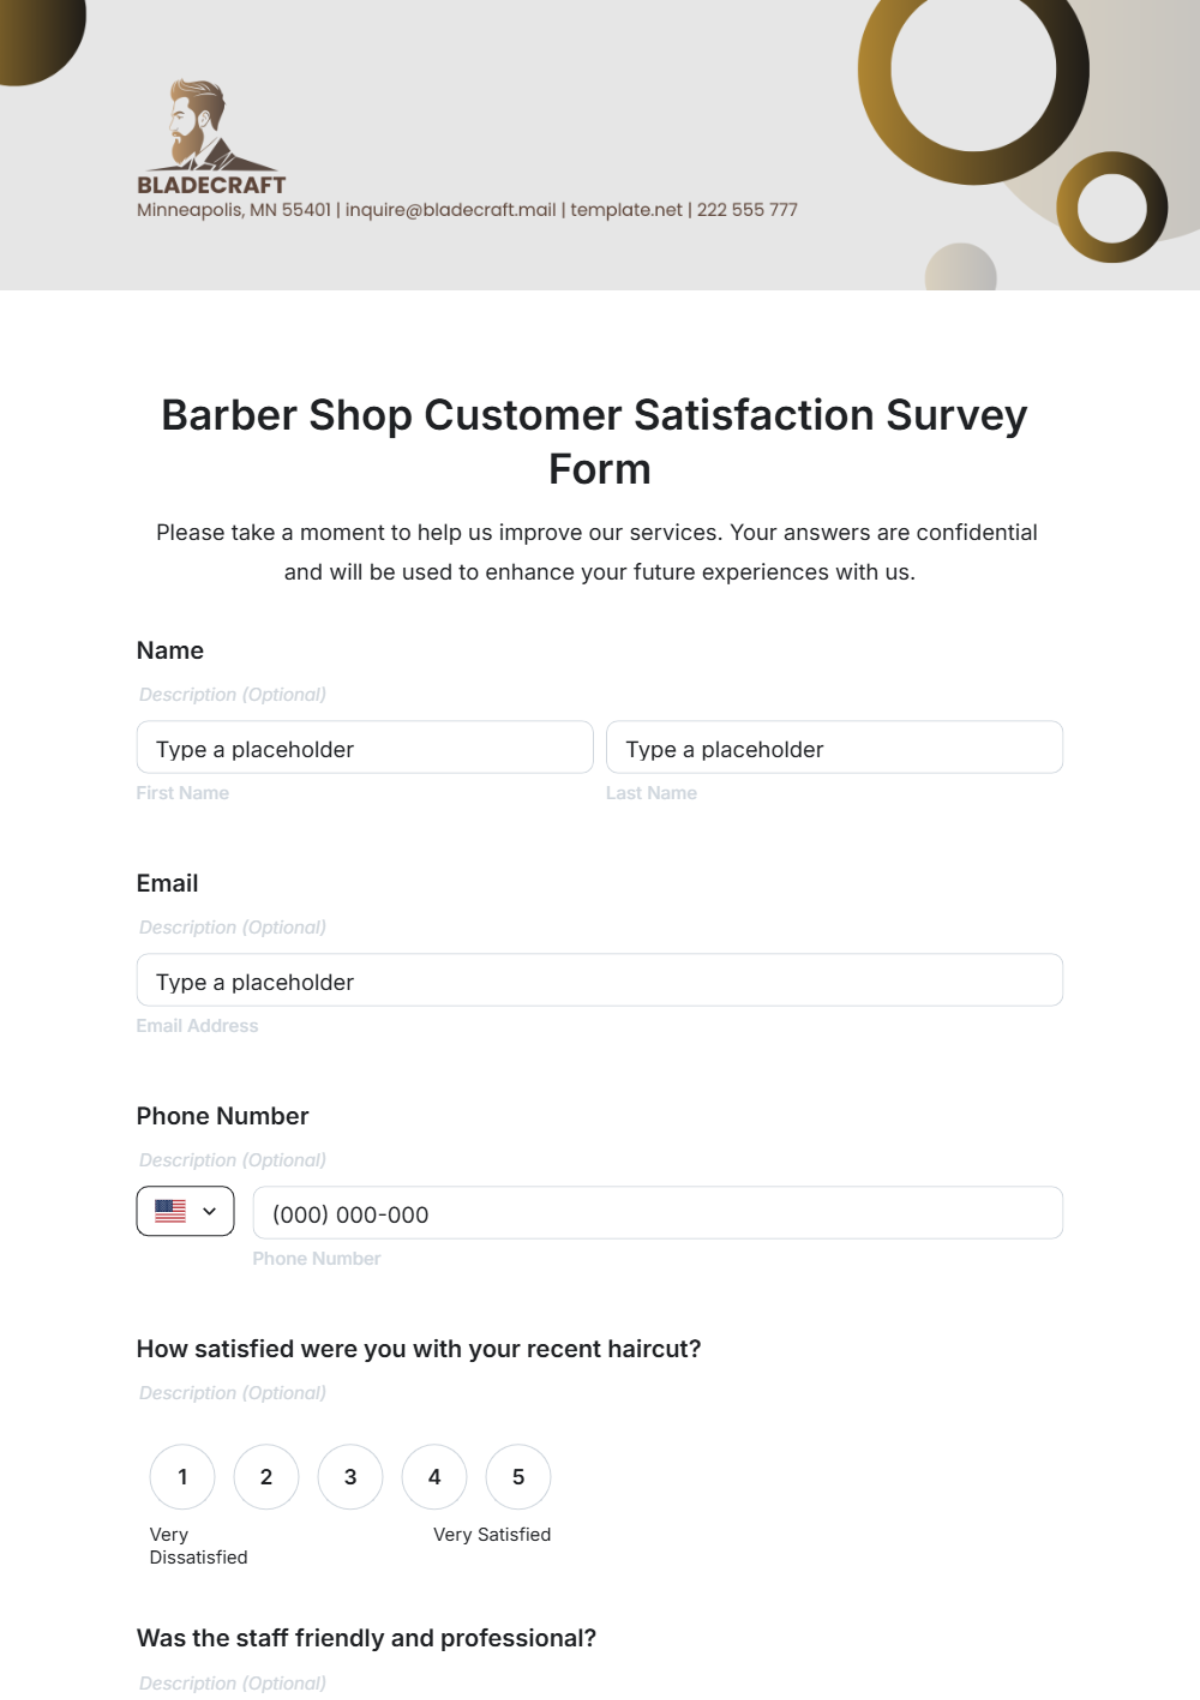
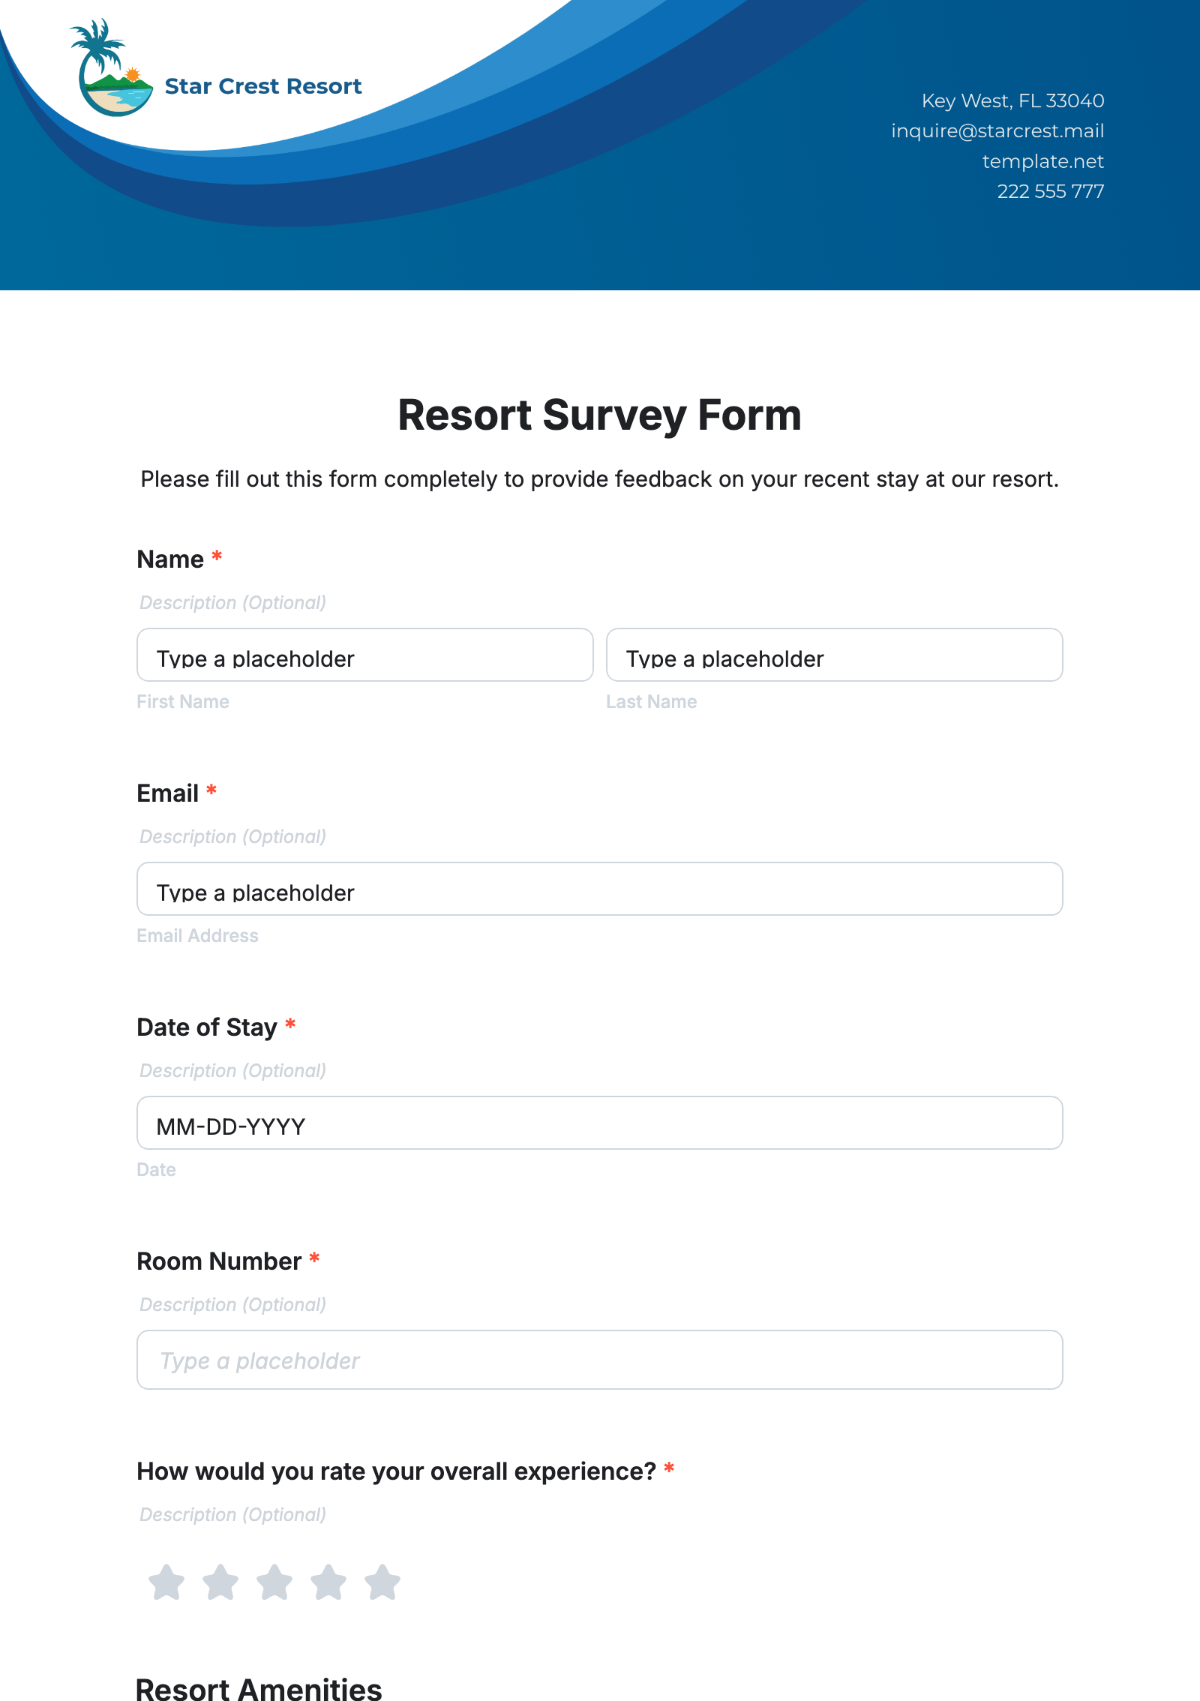
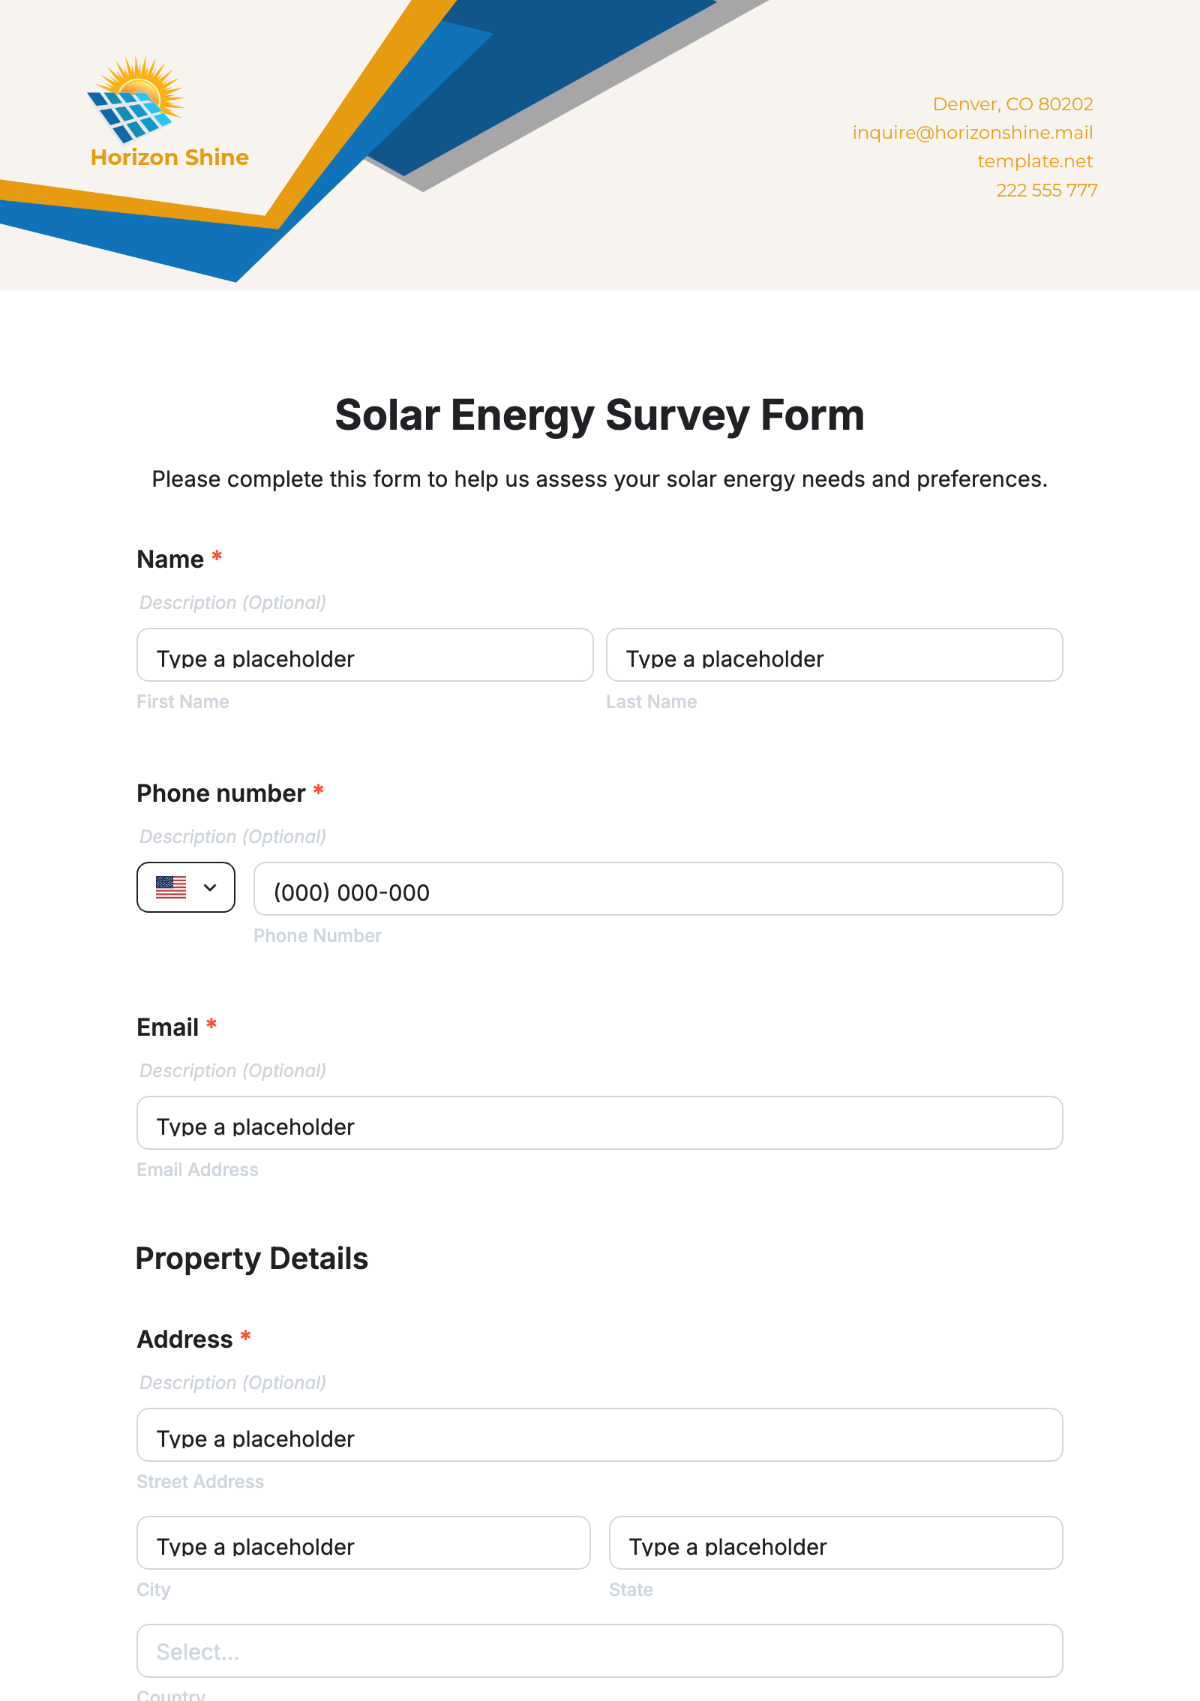
Survey Design: The survey includes a mix of Likert scale questions, multiple-choice questions, and an open-ended question to gather quantitative data on employee satisfaction and engagement.
Sampling Method: We will select a random sample of 200 employees from the company's 1,000-employee database. This sample will include a diverse range of departments and job levels to ensure representativeness.
Data Collection Process: The survey will be distributed via an email link using the SurveyMonkey platform. Participants will have two weeks to complete the survey. Reminder emails will be sent after one week to encourage participation.
III. Questionnaire/Survey Instrument
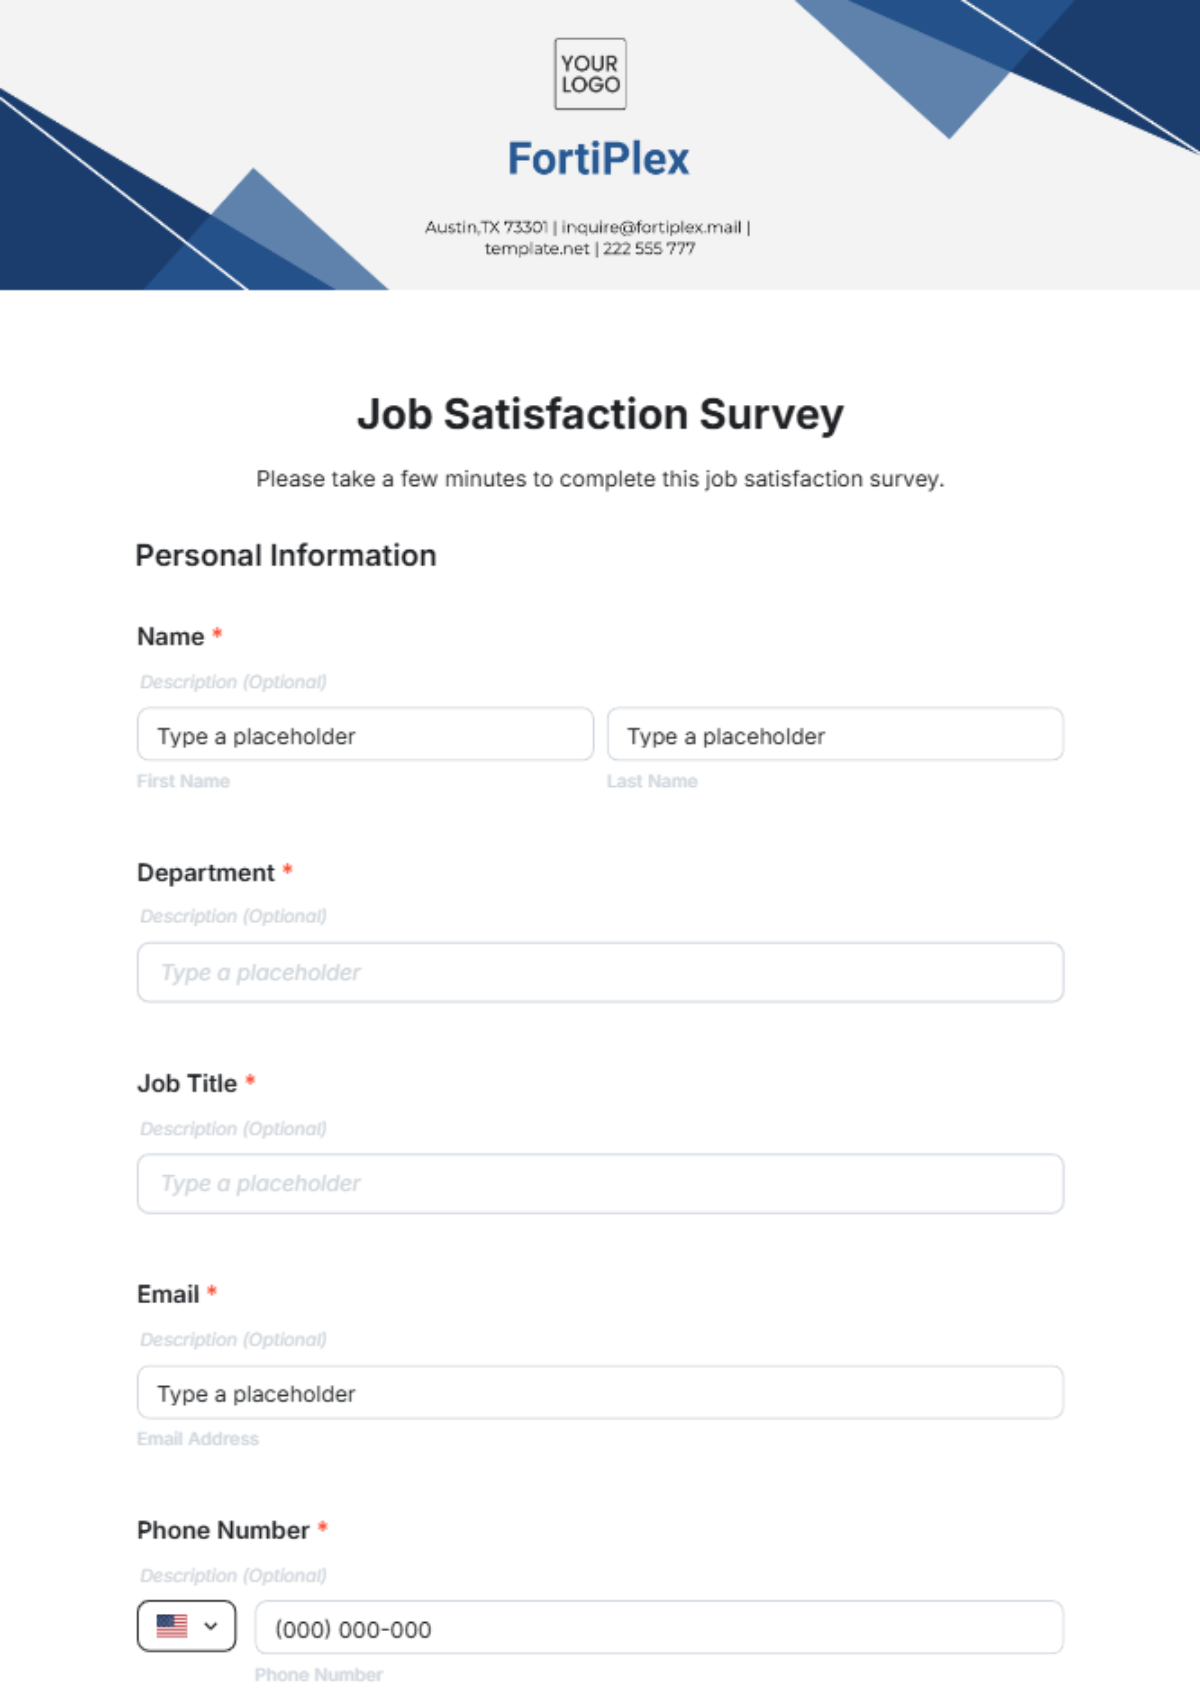
Instruction: Please select the response that best represents your opinion for each question.
Category | Question | Response Options |
|---|---|---|
Overall Satisfaction | How satisfied are you with your current job role? | [ ] Dissatisfied [ ] Neutral [ ] Satisfied |
Work Environment | How would you rate the overall work environment in terms of comfort and safety? | [ ] Poor [ ] Neutral [ ] Good |
Management Support | How supportive do you find your direct supervisor in your professional development? | [ ] Unsupportive [ ] Neutral [ ] Supportive |
Career Growth | To what extent do you feel there are opportunities for career advancement within the company? | [ ] Few Opportunities [ ] Neutral [ ] Many Opportunities |
Work-Life Balance | How well do you think the company supports work-life balance? | [ ] Poorly [ ] Neutral [ ] Well |
Communication | How effective do you find internal communication within the company? | [ ] Ineffective [ ] Neutral [ ] Effective |
IV. Data Analysis Plan
A. Data Cleaning
Response Validation: Review all survey responses for completeness. Exclude responses that are either incomplete or duplicated.
Data Entry Verification: Cross-check data entries to ensure accuracy. This involves verifying that each entry aligns with the intended survey format and coding.
B. Descriptive Statistics
Mean Scores and Standard Deviations: Calculate the mean score and standard deviation for each Likert scale question to understand central tendencies and variability.
Frequency Distributions and Percentages: Determine the frequency of each response option for multiple-choice questions and convert these frequencies into percentages to visualize distribution.
C. Comparative Analysis
T-Tests: Compare mean satisfaction scores between two groups, such as employees in different departments (e.g., HR vs. Marketing).
ANOVA (Analysis of Variance): Use ANOVA to compare satisfaction and engagement scores across multiple groups, such as different job levels (e.g., junior vs. senior staff).
Post-Hoc Tests: If ANOVA indicates significant differences, perform post-hoc tests (e.g., Tukey’s HSD) to determine which specific groups differ from each other.
D. Correlation Analysis
Pearson Correlation Coefficients: Calculate Pearson correlation coefficients to explore the relationships between overall satisfaction scores and various factors such as career growth opportunities, work environment, and management support.
E. Advanced Analysis (Optional)
Regression Analysis: Conduct multiple regression analysis to understand the impact of several independent variables (e.g., work environment, management support) on overall satisfaction. This helps identify which factors most significantly affect employee satisfaction.
Factor Analysis: Perform factor analysis to identify underlying factors or dimensions that explain the patterns of responses in the survey data, which can help in understanding the key drivers of satisfaction and engagement.
F. Reporting and Visualization
Graphs and Charts: Create visual representations such as bar charts, histograms, and scatter plots to illustrate key findings and trends.
Summary Report: Prepare a comprehensive report summarizing the results, including descriptive statistics, comparative analysis, correlation findings, and any significant patterns or insights.
V. Ethical Considerations
Informed Consent: Participants will see an introduction outlining the survey’s purpose, emphasizing voluntary participation, and providing contact information for questions.
Confidentiality: Responses will be anonymized to protect privacy, and only aggregated data will be reported.
Data Protection: Data will be encrypted and stored on SurveyMonkey, with access restricted to authorized researchers.
Data Integrity: Regular checks will ensure data accuracy and reliability, with any anomalies investigated.
Ethical Review: The survey will adhere to ethical guidelines and standards set by relevant review boards.
VI. Results and Discussion
A. Discussion of Key Findings
Overall Satisfaction: With an average score of 3.8, employees generally feel positive, but 17% are dissatisfied. Areas contributing to dissatisfaction should be explored further.
Work Environment: A mean rating of 4.1 indicates most employees find the environment comfortable and safe. However, 10% rated it poorly, suggesting potential issues with facilities or workspace.
Management Support: The mean rating of 3.6 shows management is seen as somewhat supportive, but 25% feel management is unsupportive. This highlights a need for improved management training and resources.
Career Growth: The low mean rating of 3.2 for career growth suggests limited advancement opportunities. Focus on creating clearer career paths and offering more development programs is needed.
Work-Life Balance: With a mean rating of 3.9, most employees view work-life balance positively, though some feel unsupported. Efforts should be made to better support work-life balance for all employees.
Communication: A rating of 3.7 indicates internal communication is generally effective but could benefit from increased transparency and regular updates from leadership.
B. Actionable Recommendations
Enhance Management Training: Develop comprehensive training programs to improve management support and leadership skills, focusing on providing constructive feedback and career development opportunities.
Improve Career Growth Opportunities: Create clear career development paths and offer more internal training programs to help employees advance within the company.
Address Work Environment Issues: Conduct follow-up surveys or focus groups to identify specific concerns about the work environment and implement targeted improvements.
Strengthen Work-Life Balance Initiatives: Review current work-life balance policies and consider introducing flexible work arrangements or additional support resources.
Improve Communication Channels: Enhance internal communication strategies to ensure timely and transparent updates from management, and consider establishing more regular forums for employee feedback.
VII. References
Diener, E., & Seligman, M. E. P. (2050). "Beyond Money: Toward an Economy of Well-Being." Psychological Science, 15(1), 51-56.
Harter, J. K., Schmidt, F. L., & Hayes, T. L. (2050). "Business-Unit-Level Relationship Between Employee Satisfaction, Employee Engagement, and Business Outcomes: A Meta-Analysis." Journal of Applied Psychology, 87(2), 268-279.
Kahn, W. A. (2050). "Psychological Conditions of Personal Engagement and Disengagement at Work." Academy of Management Journal, 33(4), 692-724.
Robinson, S. P., & Judge, T. A. (2050). Organizational Behavior. 18th Edition. Pearson.
