Survey Panel Descriptive Research
Prepared By: [YOUR NAME]
Date: [DATE]
I. Introduction
A. Objective
The primary aim of the study is to conduct an in-depth exploration and comprehensive analysis of the myriad changes and fluctuations in public opinions and perceptions concerning social inequality that have occurred over a decade.
B. Scope
The research delves into and closely analyzes the various trends and patterns in how different socio-economic groups perceive and understand the concept of social inequality. It scrutinizes the differences and similarities in viewpoints, feelings, and beliefs about social inequality as expressed by individuals belonging to diverse economic and social strata.
C. Significance
Gaining a comprehensive understanding of the way attitudes evolve and transform over time can be instrumental in formulating and implementing effective policies and interventions aimed at addressing and mitigating the pervasive issue of social inequality.
II. Panel Description
A. Demographics
The panel includes 1,000 participants aged 18-65, with a balanced representation of genders, ethnicities, and socio-economic statuses. The sample is designed to reflect the diversity of the general population.
B. Selection Criteria
Participants were randomly selected from a national database of adults. Inclusion criteria included being 18 or older and residing in the country. Exclusion criteria were individuals with incomplete data or who opted out of participation.
C. Panel Composition
The panel is divided into four distinct age groups, which are 18 to 24 years old, 25 to 34 years old, 35 to 44 years old, and 45 to 65 years old. Within each of these age groups, there is a proportional representation of individuals from both urban and rural areas.
III. Methodology
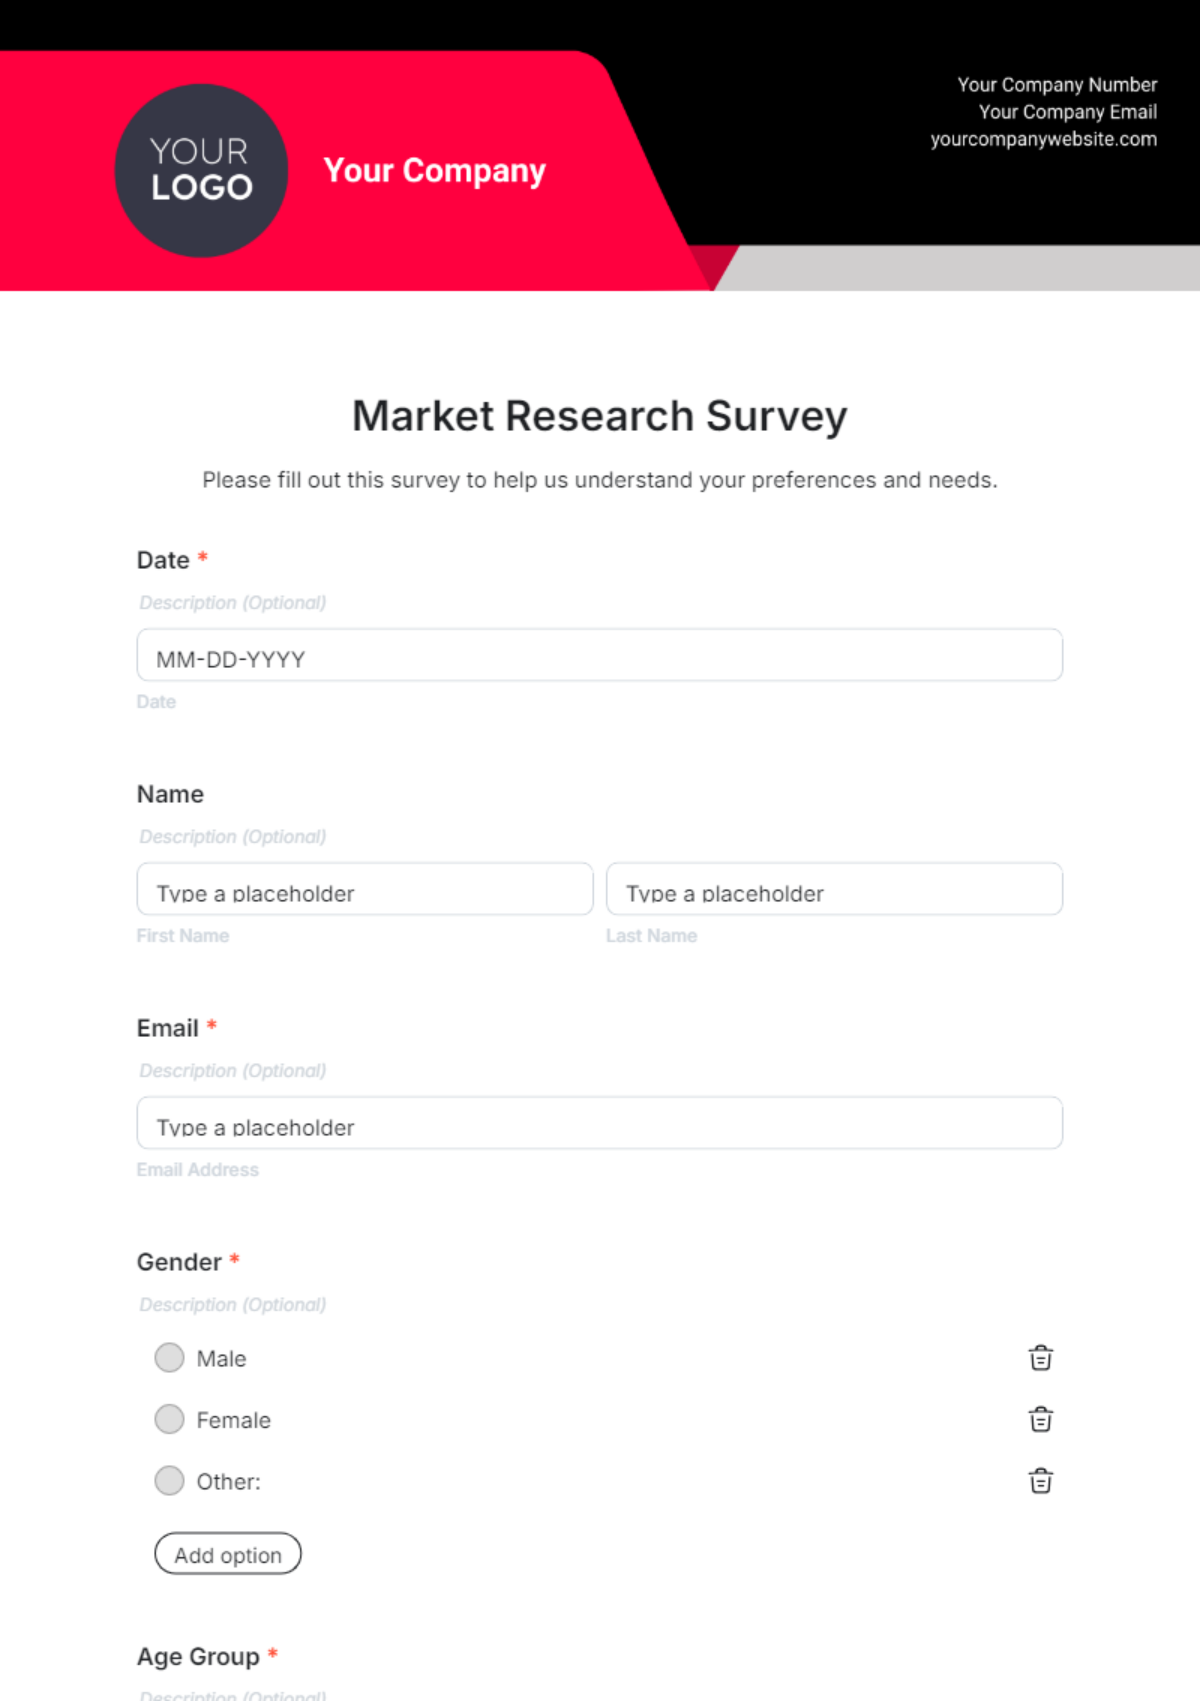
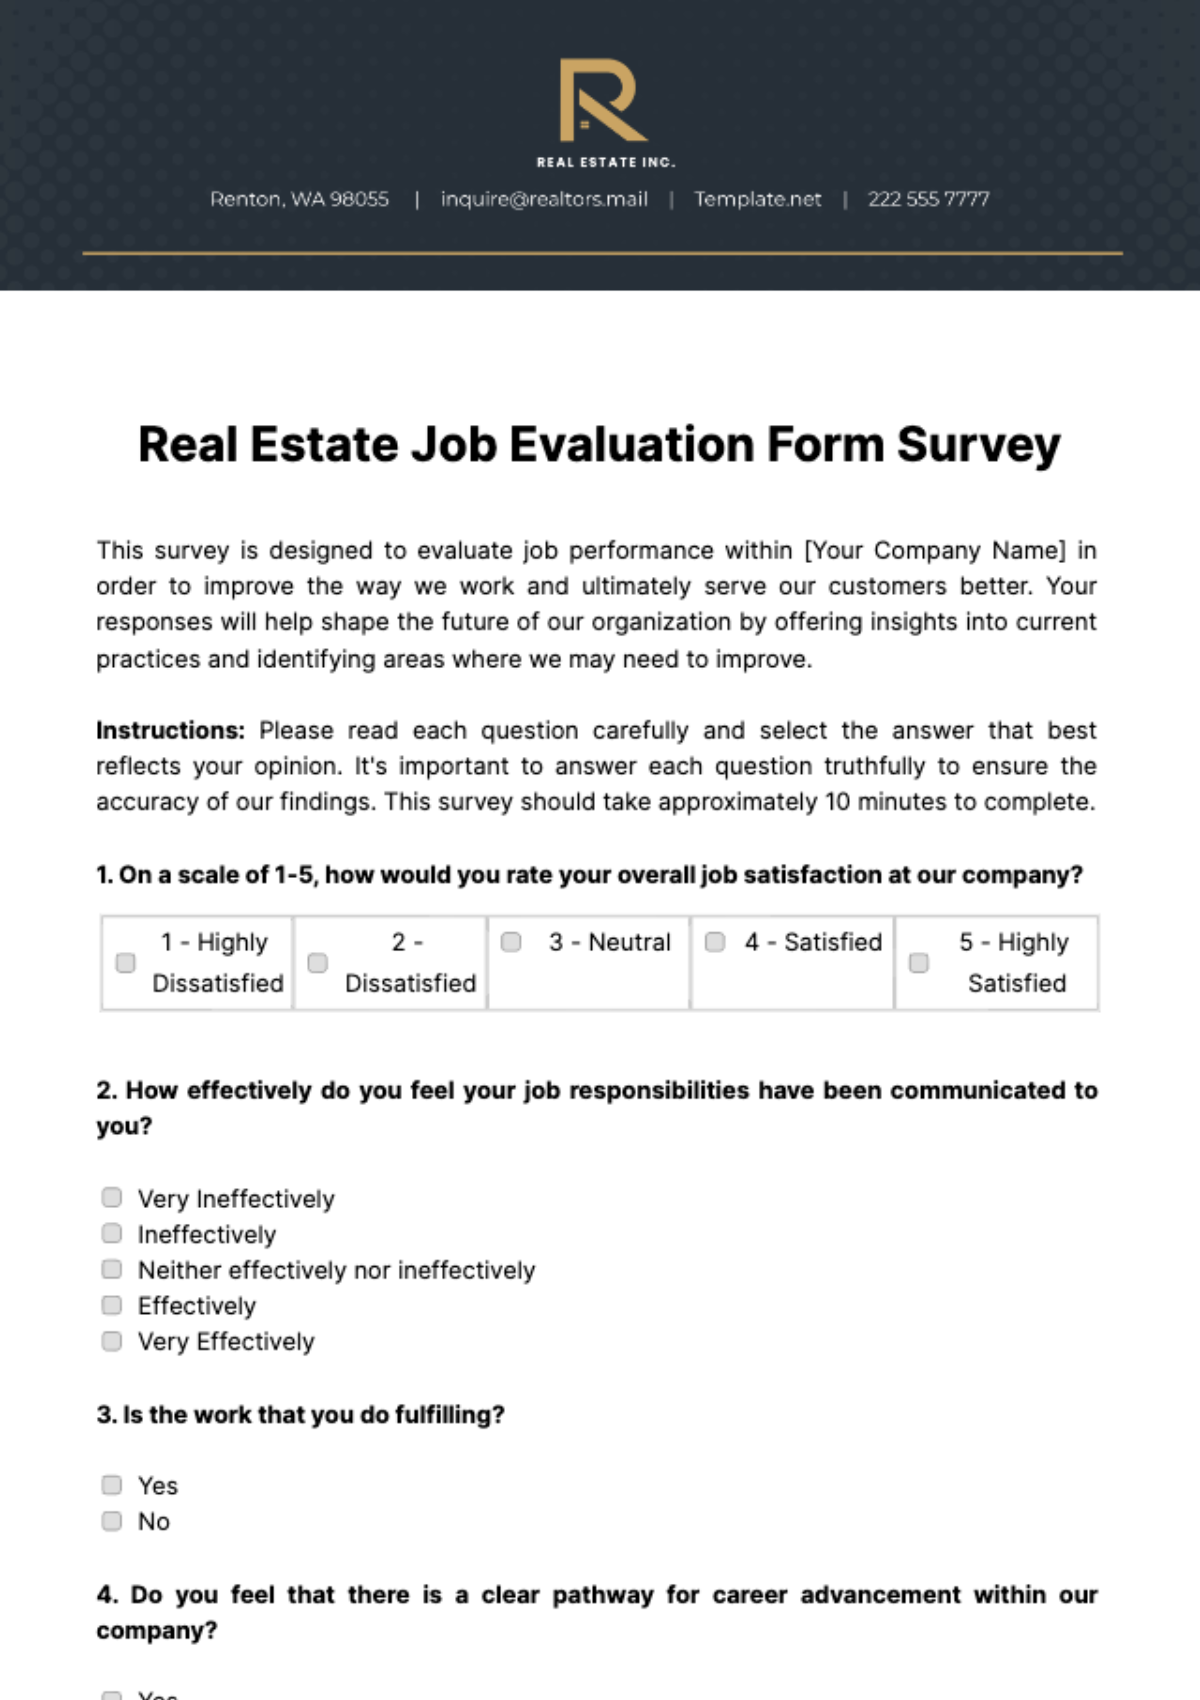
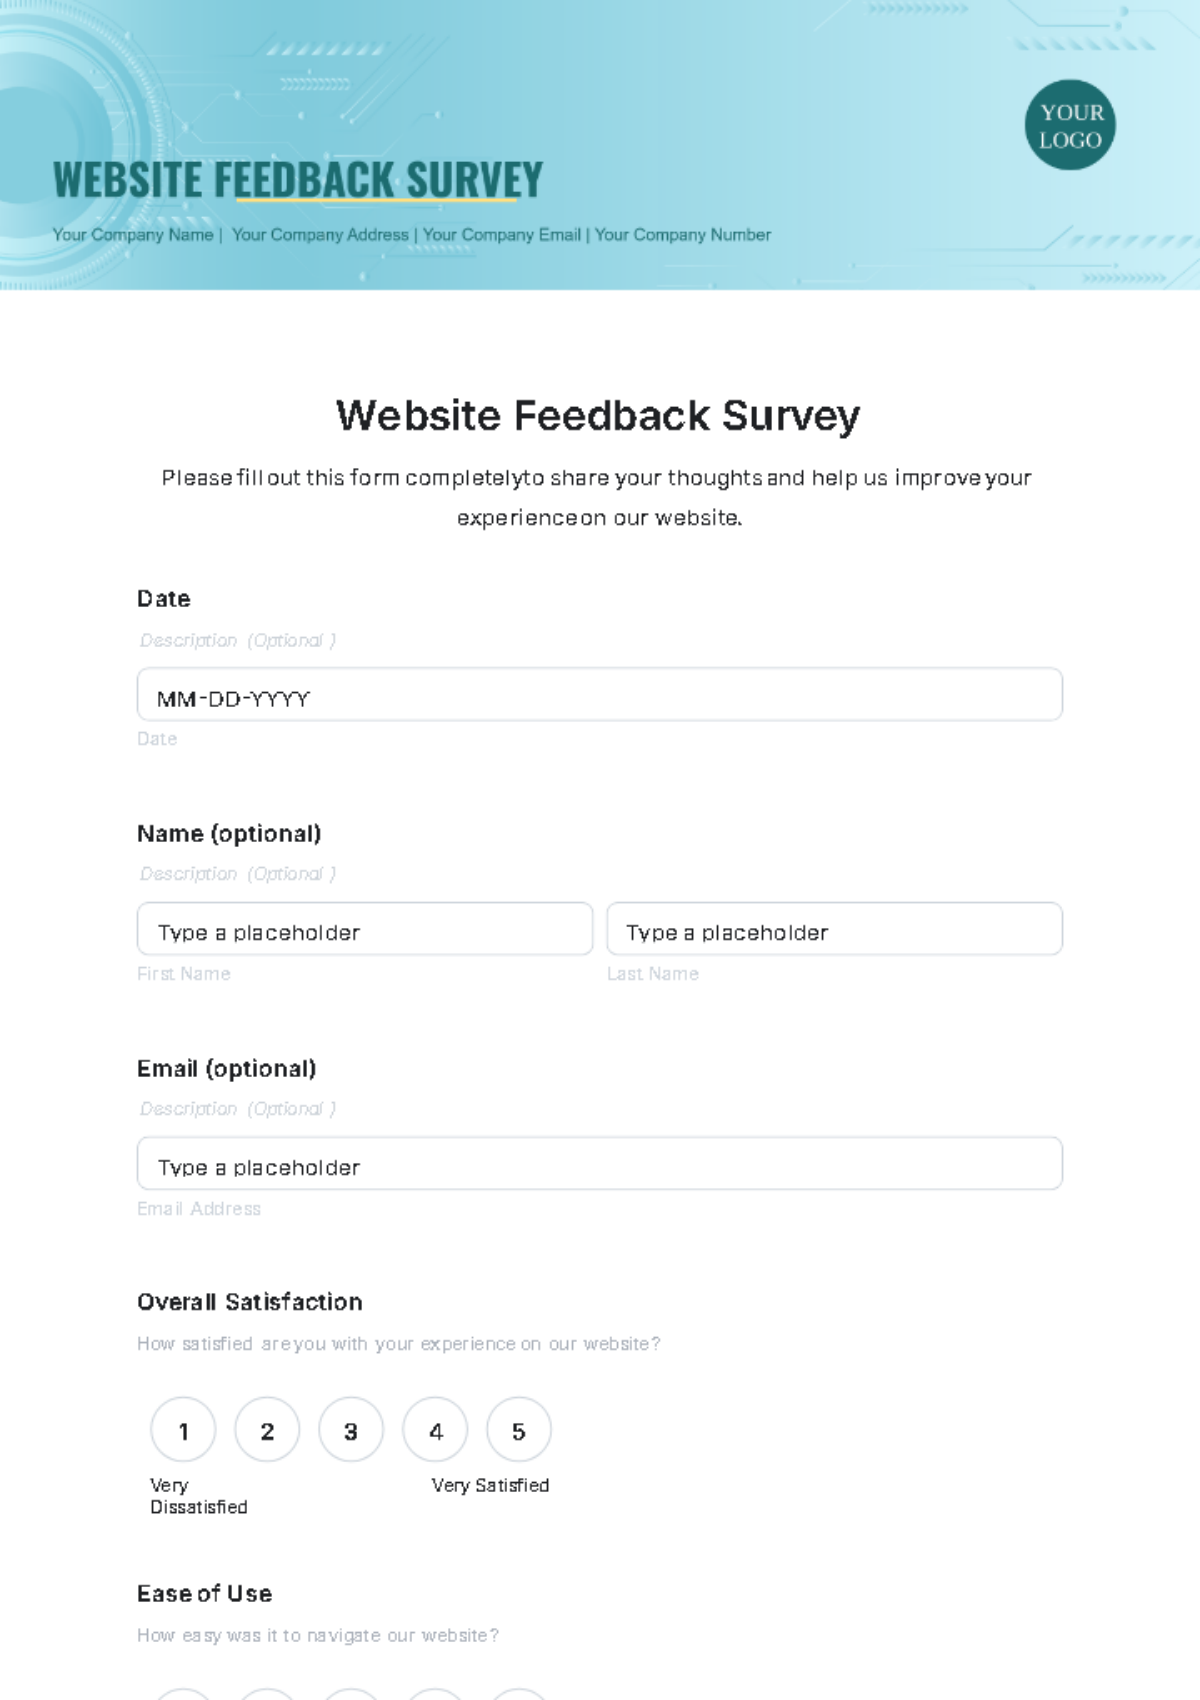
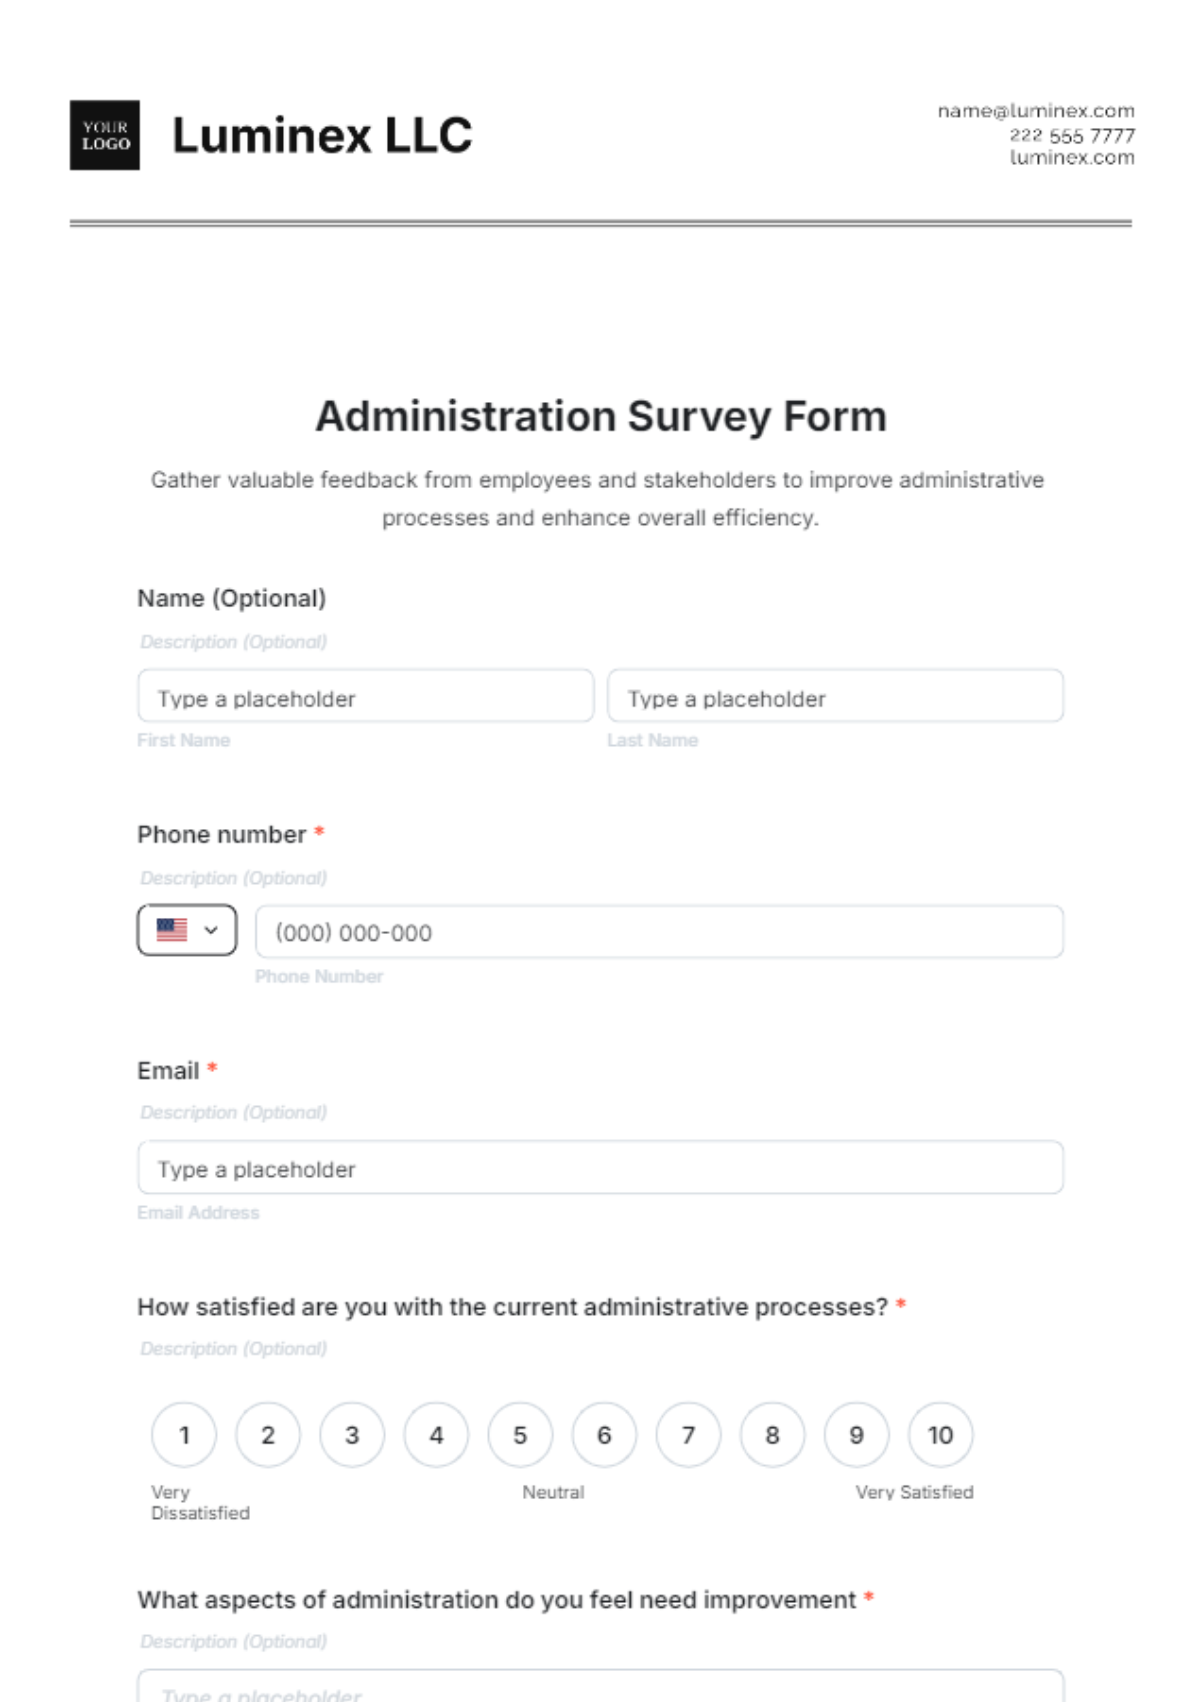
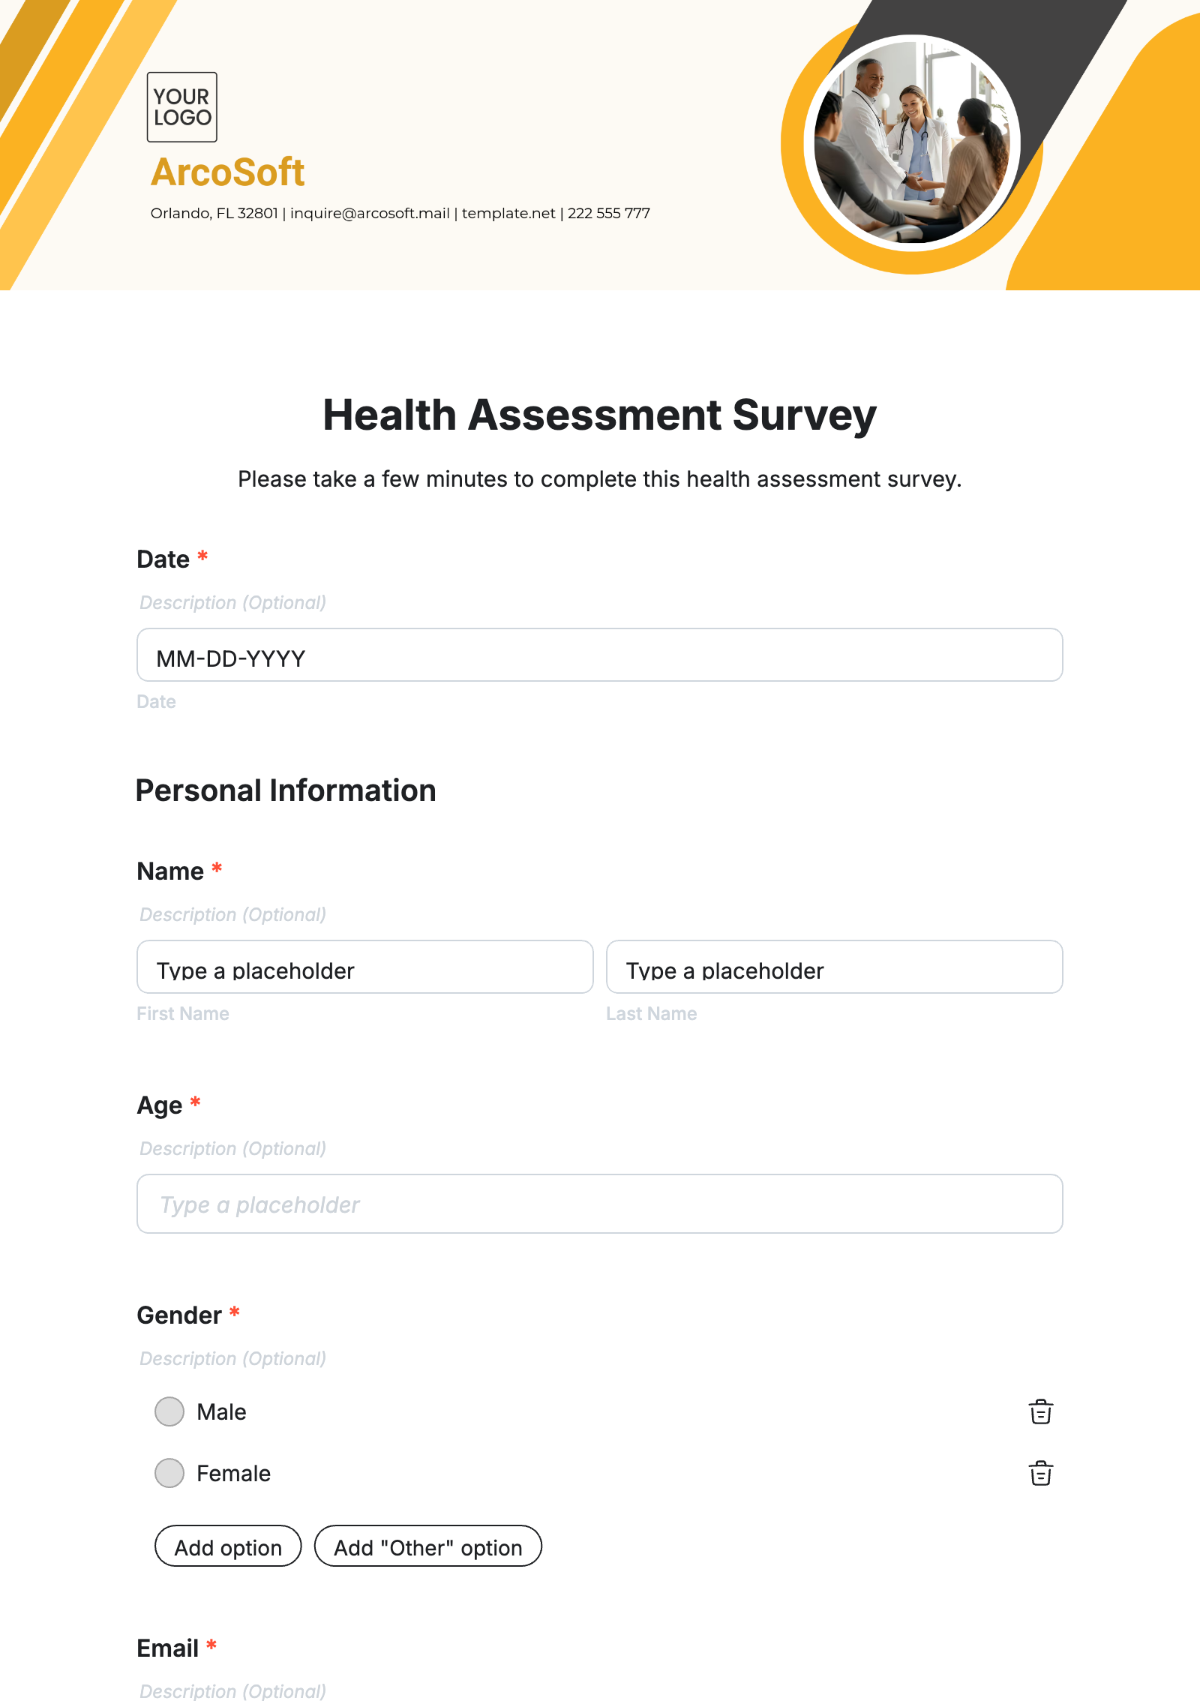
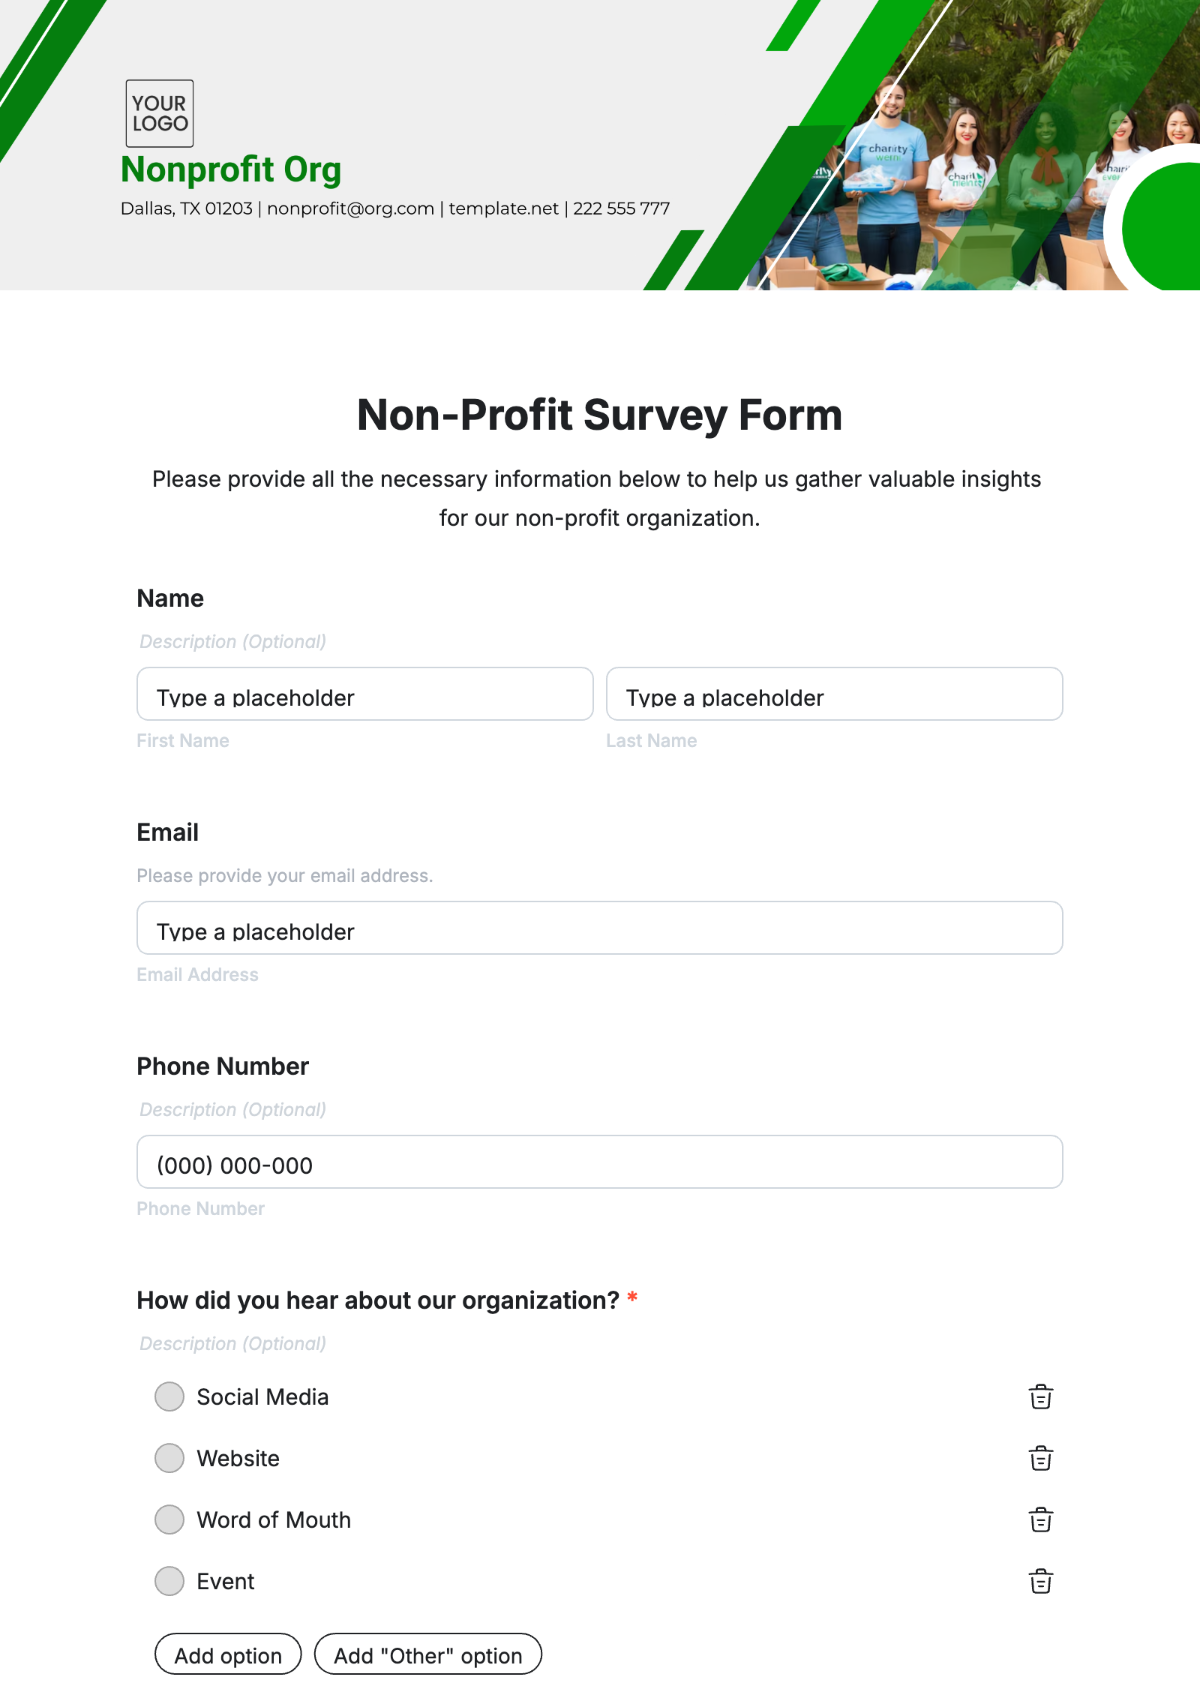
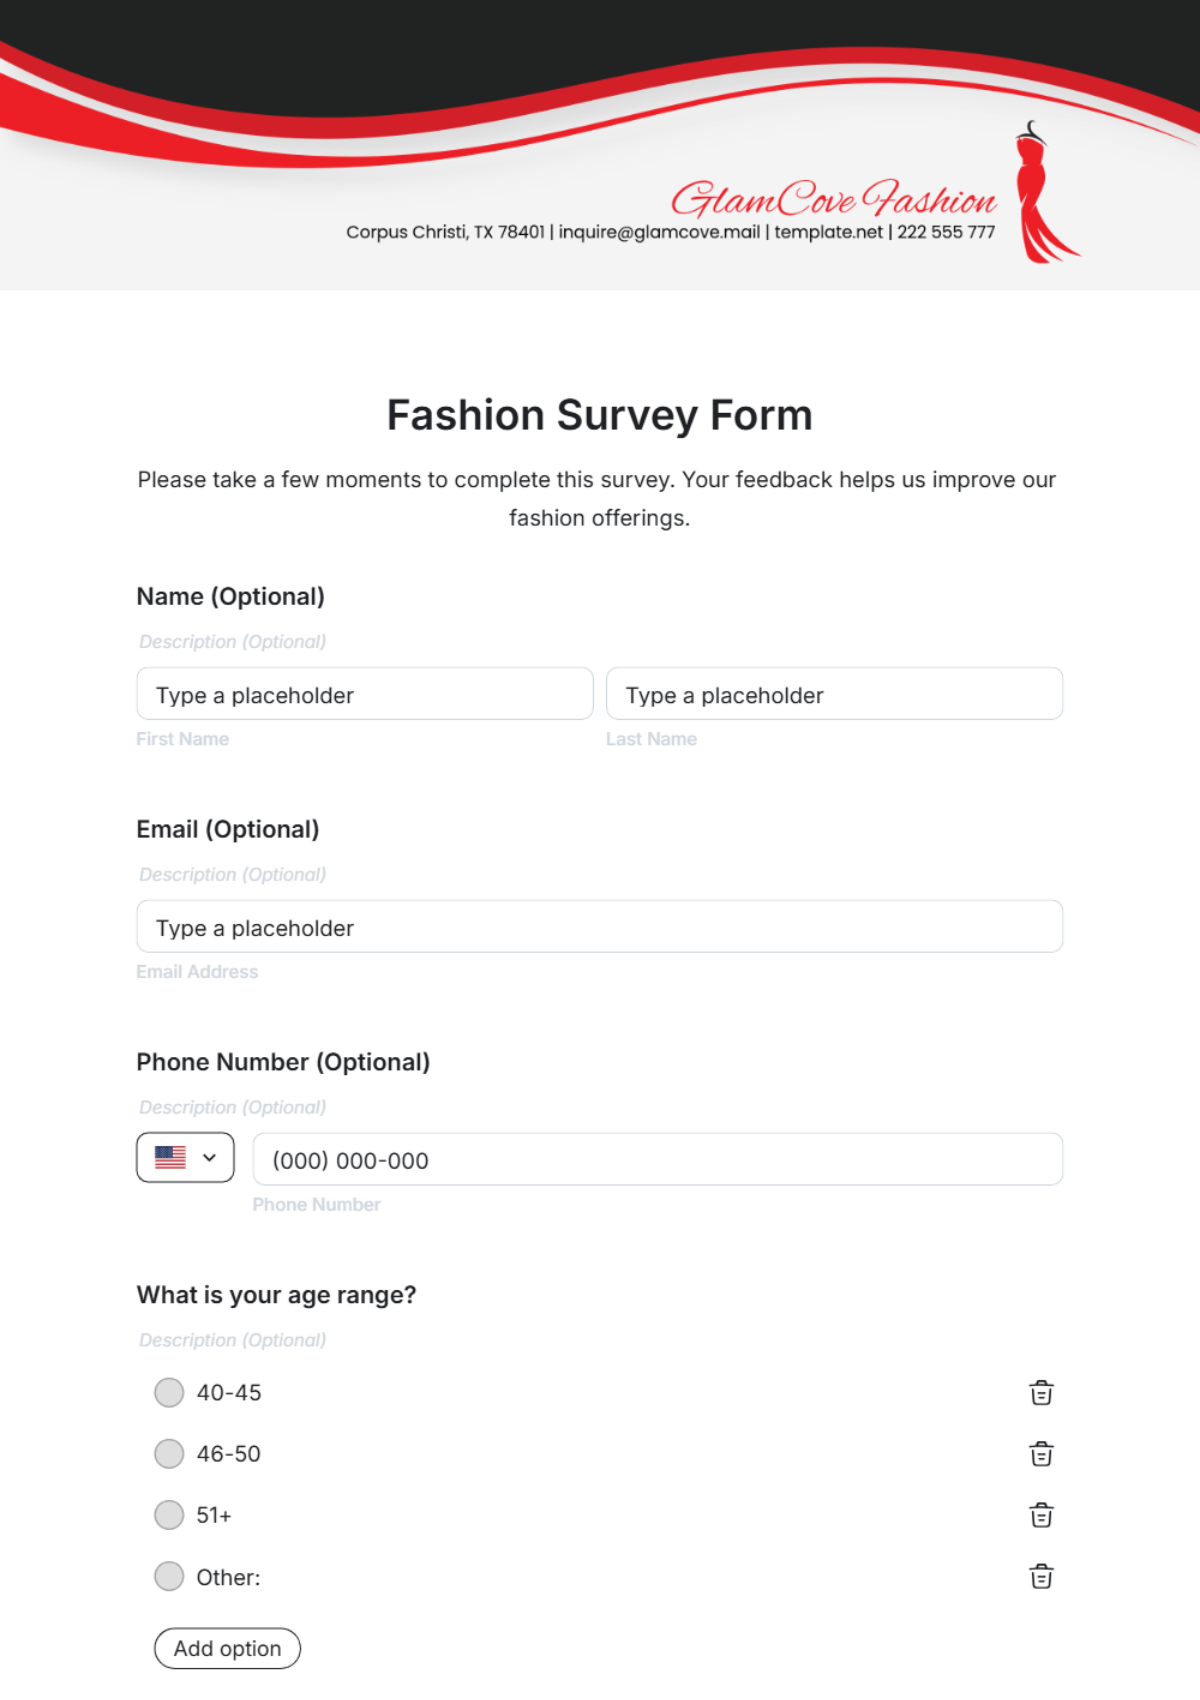
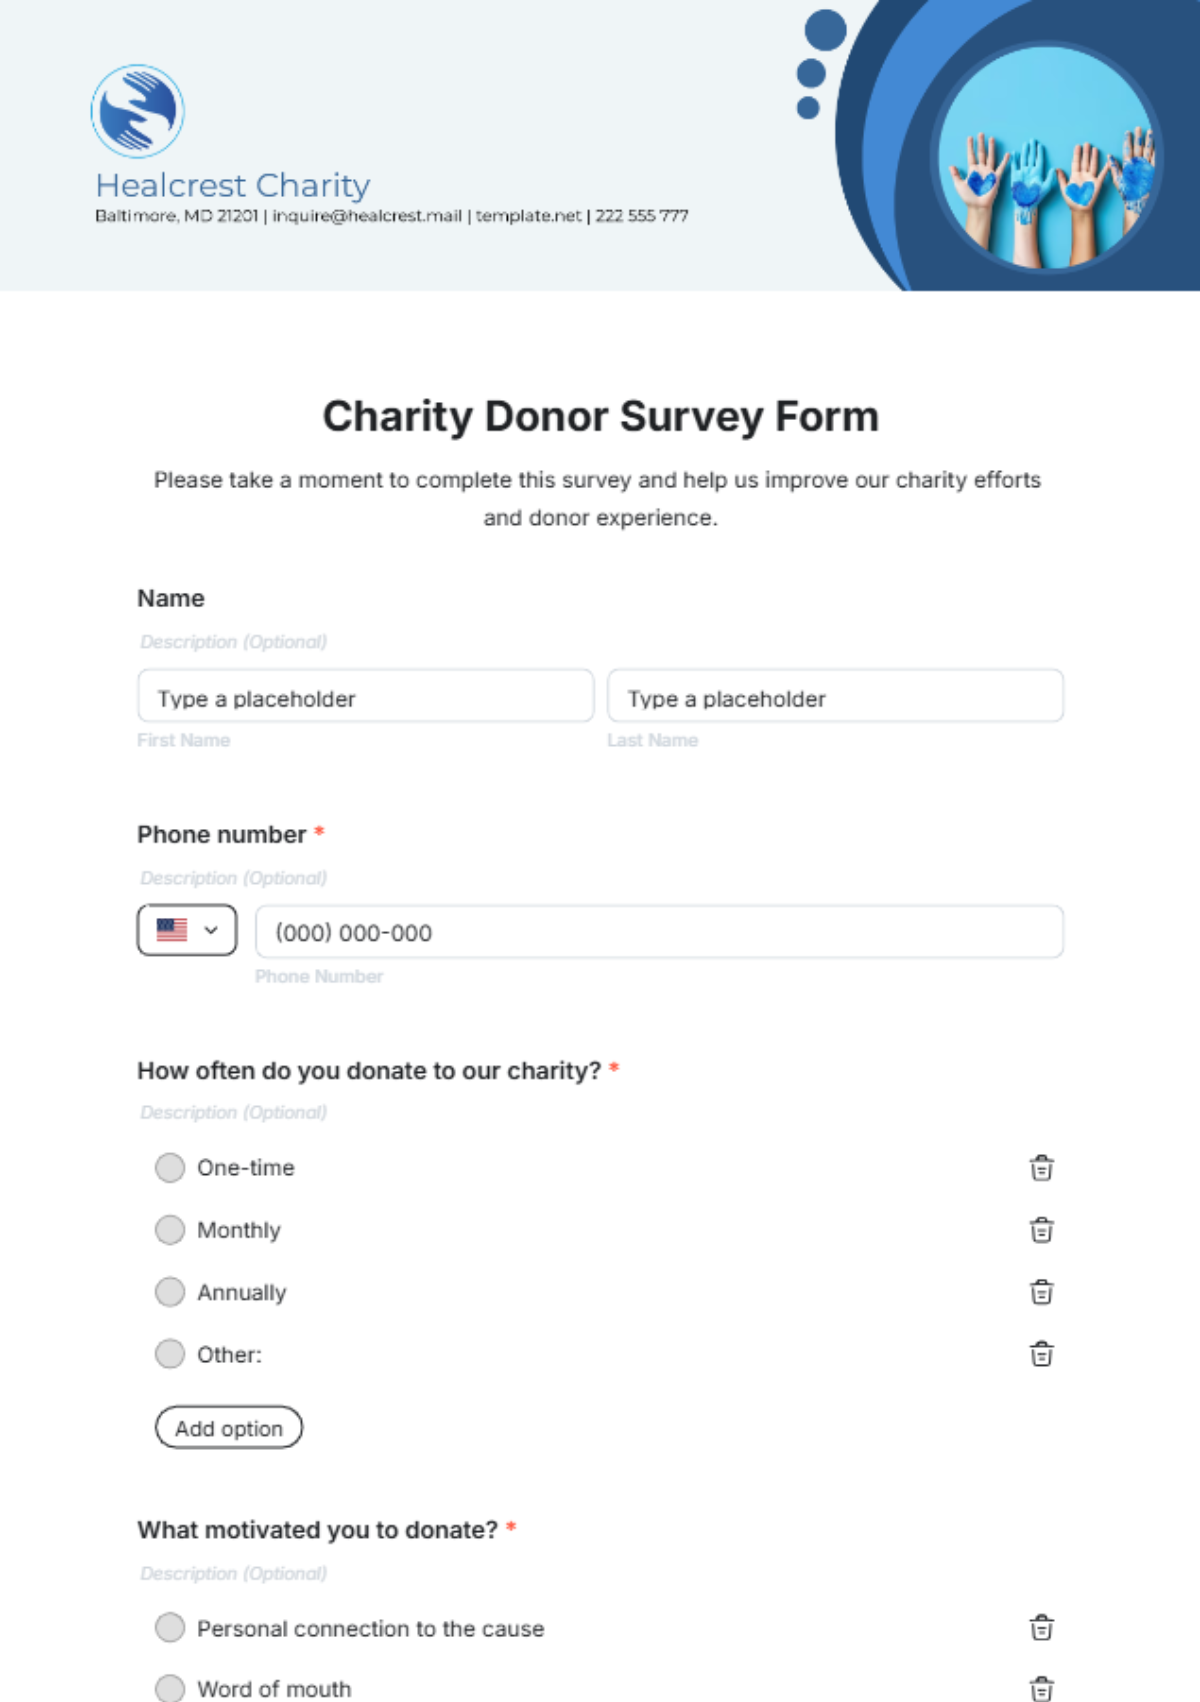
Survey Design: The survey includes 30 questions divided into sections on perceptions of inequality, personal experiences, and demographic information. Questions use Likert scales, multiple-choice, and open-ended formats.
Data Collection Methods: Surveys are conducted online through a secure platform, where participants receive an email link to the survey and complete it at their convenience.
Data Collection Timeline: Surveys are carried out on an annual basis over ten years, with each new round of surveys being initiated every August.
Analysis Techniques: Data is analyzed using statistical software (e.g., SPSS or R). Techniques include trend analysis, chi-square tests for categorical data, and regression analysis for longitudinal changes.
IV. Findings/Results
A. Descriptive Statistics
Initial findings show that 60% of respondents in 2054 perceived a significant increase in social inequality, compared to 75% in 2064. Age and income level impact these perceptions significantly.
Age Groups: Younger respondents (18-34 years) exhibit higher levels of perceived inequality compared to older groups (35+ years).
Income Levels: Lower-income respondents report a greater sense of worsening inequality compared to higher-income groups.
B. Trends Over Time
The percentage of participants who feel that social inequality has worsened has increased by 15% over ten years. Differences in perception are notable across age groups and income levels.
Age Groups |
|
Income Levels |
|
C. Key Insights
Younger participants and those with lower incomes report a higher perception of worsening inequality. Rural residents tend to have less pronounced views on the issue compared to urban residents.
Demographic Group | Perception Level (2054) | Perception Level (2064) | Change |
|---|---|---|---|
18-24 years | 65% | 80% | +15% |
25-34 years | 60% | 70% | +10% |
35-44 years | 55% | 60% | +5% |
45-65 years | 50% | 55% | +5% |
Low Income | 70% | 85% | +15% |
Middle Income | 60% | 70% | +10% |
High Income | 50% | 55% | +5% |
Urban Residents | 65% | 80% | +15% |
Rural Residents | 55% | 60% | +5% |
Perception of Social Inequality by Demographics
V. Discussion/Analysis
Implications: The increased perception of social inequality may reflect real changes in socio-economic conditions or heightened awareness of inequality issues.
Relevance: The findings contribute to understanding how public perceptions of social inequality evolve and can inform policymakers and social scientists.
Limitations: The study may be limited by self-reporting biases and the fact that perceptions of inequality can be influenced by external factors not controlled in the study.
Future Research: Future studies could explore the impact of specific socio-economic policies on perceptions of inequality or use qualitative methods to gain deeper insights into personal experiences.
VI. Conclusion
A. Summary of Findings
The findings from the research suggest that there has been an increasing perception of deteriorating social inequality throughout the last ten years. This perception differs significantly when examined across various demographic groups, indicating that people from different backgrounds and characteristics perceive the changes in social inequality in distinct ways.
B. Recommendations
Policymakers should consider specific interventions tailored to the unique needs of different demographic groups, and they must also support ongoing research to understand the underlying factors affecting these groups' perceptions, as both steps are crucial for effectively addressing the issues at hand.
VII. Appendices
Survey Instrument: The material encompasses the complete collection of survey questions, along with all available response options.
Detailed Data Tables: Tables showing responses by demographic categories, longitudinal trends, and statistical significance levels.
Methodological Details: Additional notes on sampling techniques, survey administration procedures, and data handling protocols.
VIII. References
Milanovic, B. (2056). Global Inequality: A New Approach for the Age of Globalization. Harvard University Press.
Wilkinson, R., & Pickett, K. (2050). The Spirit Level: Why More Equal Societies Almost Always Do Better. Bloomsbury Press.
Kawachi, I., & Kennedy, B. P. (2052). The Health of Nations: Why Inequality Is Harmful to Your Health. New Press.


