Free Printable Marketing Campaign Profitability Report
I. Executive Summary
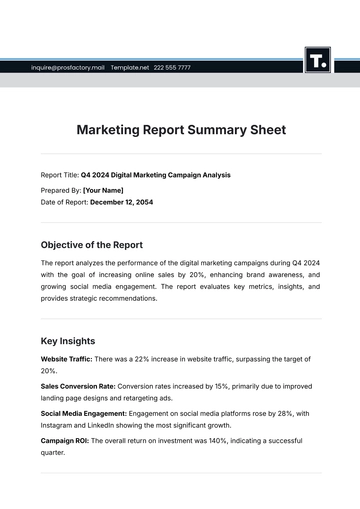
The Marketing Campaign Profitability Report for [Your Company Name] offers a comprehensive analysis of the recent marketing initiatives executed over the past quarter. This report evaluates the overall effectiveness of the campaigns, detailing key performance metrics, financial outcomes, and strategic insights. The primary goal was to enhance brand visibility, generate qualified leads, and maximize return on investment (ROI). Through a combination of targeted advertising, content marketing, and social media engagement, the campaigns aimed to drive consumer interest and increase market share.
Key findings indicate that the campaigns achieved a notable increase in engagement rates and conversion metrics compared to previous periods. However, the analysis also highlights areas for improvement, such as optimizing advertising spend and refining audience targeting strategies. This report provides actionable recommendations for future campaigns to build on current successes and address identified challenges. By leveraging these insights, [Your Company Name] aims to enhance the effectiveness of its marketing efforts, ensuring better alignment with business objectives and improved financial outcomes in subsequent campaigns.
II. Key Metrics
This section provides a detailed financial analysis of the recent printable marketing campaign, focusing on the cost and revenue aspects to evaluate its profitability. The Cost Analysis table presents a breakdown of expenses incurred, including design, production, printing, and distribution costs. By understanding these expenditures, we can assess the efficiency of resource allocation and identify potential areas for cost optimization.
The Revenue Analysis table highlights the total sales revenue generated directly from the campaign. Combining this revenue with the detailed cost analysis allows for a precise calculation of net profit. This profitability overview will help gauge the campaign's overall success and inform future marketing strategies.
A. Cost Analysis
The following table outlines the costs associated with the printable marketing campaign:
Category | Amount (USD) |
|---|---|
Design and Production | 5,000 |
Printing Costs | 3,000 |
Distribution | 2,000 |
Total Costs | 10,000 |
B. Revenue Analysis
The following table outlines the revenue generated from the printable marketing campaign:
Category | Amount (USD) |
|---|---|
Sales from Campaign | 18,000 |
C. Profit Calculation
The profitability of the campaign can be summarized as follows:
Total Revenue | Total Costs | Net Profit |
|---|---|---|
$18,000 | $10,000 | $8,000 |
III. Audience Engagement
This section delves into the audience engagement metrics of the recent printable marketing campaign, focusing on reach, impressions, and conversion rates. The Reach and Impressions data provides insight into the campaign’s visibility and exposure, detailing the number of individuals who were exposed to the campaign and the frequency of these exposures. Understanding these metrics is crucial for evaluating the campaign’s effectiveness in capturing attention and generating awareness.
The Conversion Rates data offers a measure of how well the campaign turned engagement into actionable results. By analyzing the overall conversion rate and the direct response rate, we can assess the effectiveness of the campaign in motivating the target audience to take desired actions. These insights are key to refining future marketing strategies and improving overall campaign performance.
A. Reach and Impressions
The following metrics represent the reach and impressions of the campaign:
Total Reach | 12,000 individuals |
Total Impressions | 20,000 |
B. Conversion Rates
The conversion rates for the campaign are as follows:
Overall Conversion Rate | 7% |
Direct Response Rate | 5% |
IV. Campaign Effectiveness
A. Return on Investment (ROI)
The ROI for the printable marketing campaign can be calculated using the following formula:
ROI = (Net Profit / Total Costs) * 100 In this campaign, ROI is calculated as follows: ROI: (8,000 / 10,000) * 100 = 80% |
B. Customer Feedback
We collected feedback from customers regarding the campaign:
Positive Feedback: 85%
Neutral Feedback: 10%
Negative Feedback: 5%
V. Recommendations for Future Campaigns
Based on the analysis of the current campaign, we recommend the following strategies for future campaigns:
Increase Budget Allocation for Design and Production to Enhance Visual Appeal
Optimize Distribution Channels to Maximize Reach and Minimize Costs
Implement Advanced Tracking Mechanisms for Improved Conversion Rate Analysis
Conduct Pre-Campaign Surveys to Better Understand Audience Preferences
VI. Conclusion
The analysis of the printable marketing campaign reveals a successful execution with substantial financial and engagement outcomes. The campaign effectively reached a broad audience, generating significant impressions and achieving a commendable overall conversion rate of 7%. Financially, the campaign delivered a positive net profit of $8,000, indicating a strong return on investment. These results underscore the effectiveness of the strategic planning and execution, demonstrating that the allocated budget was utilized efficiently to drive desired outcomes.
However, while the campaign met many objectives, there are opportunities for further optimization. The analysis suggests refining audience targeting and enhancing the direct response rate, which was slightly below expectations. By addressing these areas, future campaigns can be even more effective, maximizing both reach and conversion. Overall, the insights gained from this report will guide [Your Company Name] in fine-tuning marketing strategies, improving campaign effectiveness, and achieving better alignment with business goals. Continued focus on data-driven decision-making will ensure that marketing investments yield optimal results and support sustained business growth.
- 100% Customizable, free editor
- Access 1 Million+ Templates, photo’s & graphics
- Download or share as a template
- Click and replace photos, graphics, text, backgrounds
- Resize, crop, AI write & more
- Access advanced editor
Evaluate your campaign's success with the Printable Marketing Campaign Profitability Report Template from Template.net. Fully customizable and editable, this template offers a clear format for assessing the profitability of your marketing campaigns. Editable in our AI Editor Tool, it ensures your report is professional, detailed, and ready for print, helping you make informed business decisions.
You may also like
- Sales Report
- Daily Report
- Project Report
- Business Report
- Weekly Report
- Incident Report
- Annual Report
- Report Layout
- Report Design
- Progress Report
- Marketing Report
- Company Report
- Monthly Report
- Audit Report
- Status Report
- School Report
- Reports Hr
- Management Report
- Project Status Report
- Handover Report
- Health And Safety Report
- Restaurant Report
- Construction Report
- Research Report
- Evaluation Report
- Investigation Report
- Employee Report
- Advertising Report
- Weekly Status Report
- Project Management Report
- Finance Report
- Service Report
- Technical Report
- Meeting Report
- Quarterly Report
- Inspection Report
- Medical Report
- Test Report
- Summary Report
- Inventory Report
- Valuation Report
- Operations Report
- Payroll Report
- Training Report
- Job Report
- Case Report
- Performance Report
- Board Report
- Internal Audit Report
- Student Report
- Monthly Management Report
- Small Business Report
- Accident Report
- Call Center Report
- Activity Report
- IT and Software Report
- Internship Report
- Visit Report
- Product Report
- Book Report
- Property Report
- Recruitment Report
- University Report
- Event Report
- SEO Report
- Conference Report
- Narrative Report
- Nursing Home Report
- Preschool Report
- Call Report
- Customer Report
- Employee Incident Report
- Accomplishment Report
- Social Media Report
- Work From Home Report
- Security Report
- Damage Report
- Quality Report
- Internal Report
- Nurse Report
- Real Estate Report
- Hotel Report
- Equipment Report
- Credit Report
- Field Report
- Non Profit Report
- Maintenance Report
- News Report
- Survey Report
- Executive Report
- Law Firm Report
- Advertising Agency Report
- Interior Design Report
- Travel Agency Report
- Stock Report
- Salon Report
- Bug Report
- Workplace Report
- Action Report
- Investor Report
- Cleaning Services Report
- Consulting Report
- Freelancer Report
- Site Visit Report
- Trip Report
- Classroom Observation Report
- Vehicle Report
- Final Report
- Software Report
