Free Financial Expense Tracker

I. Introduction
A. Purpose
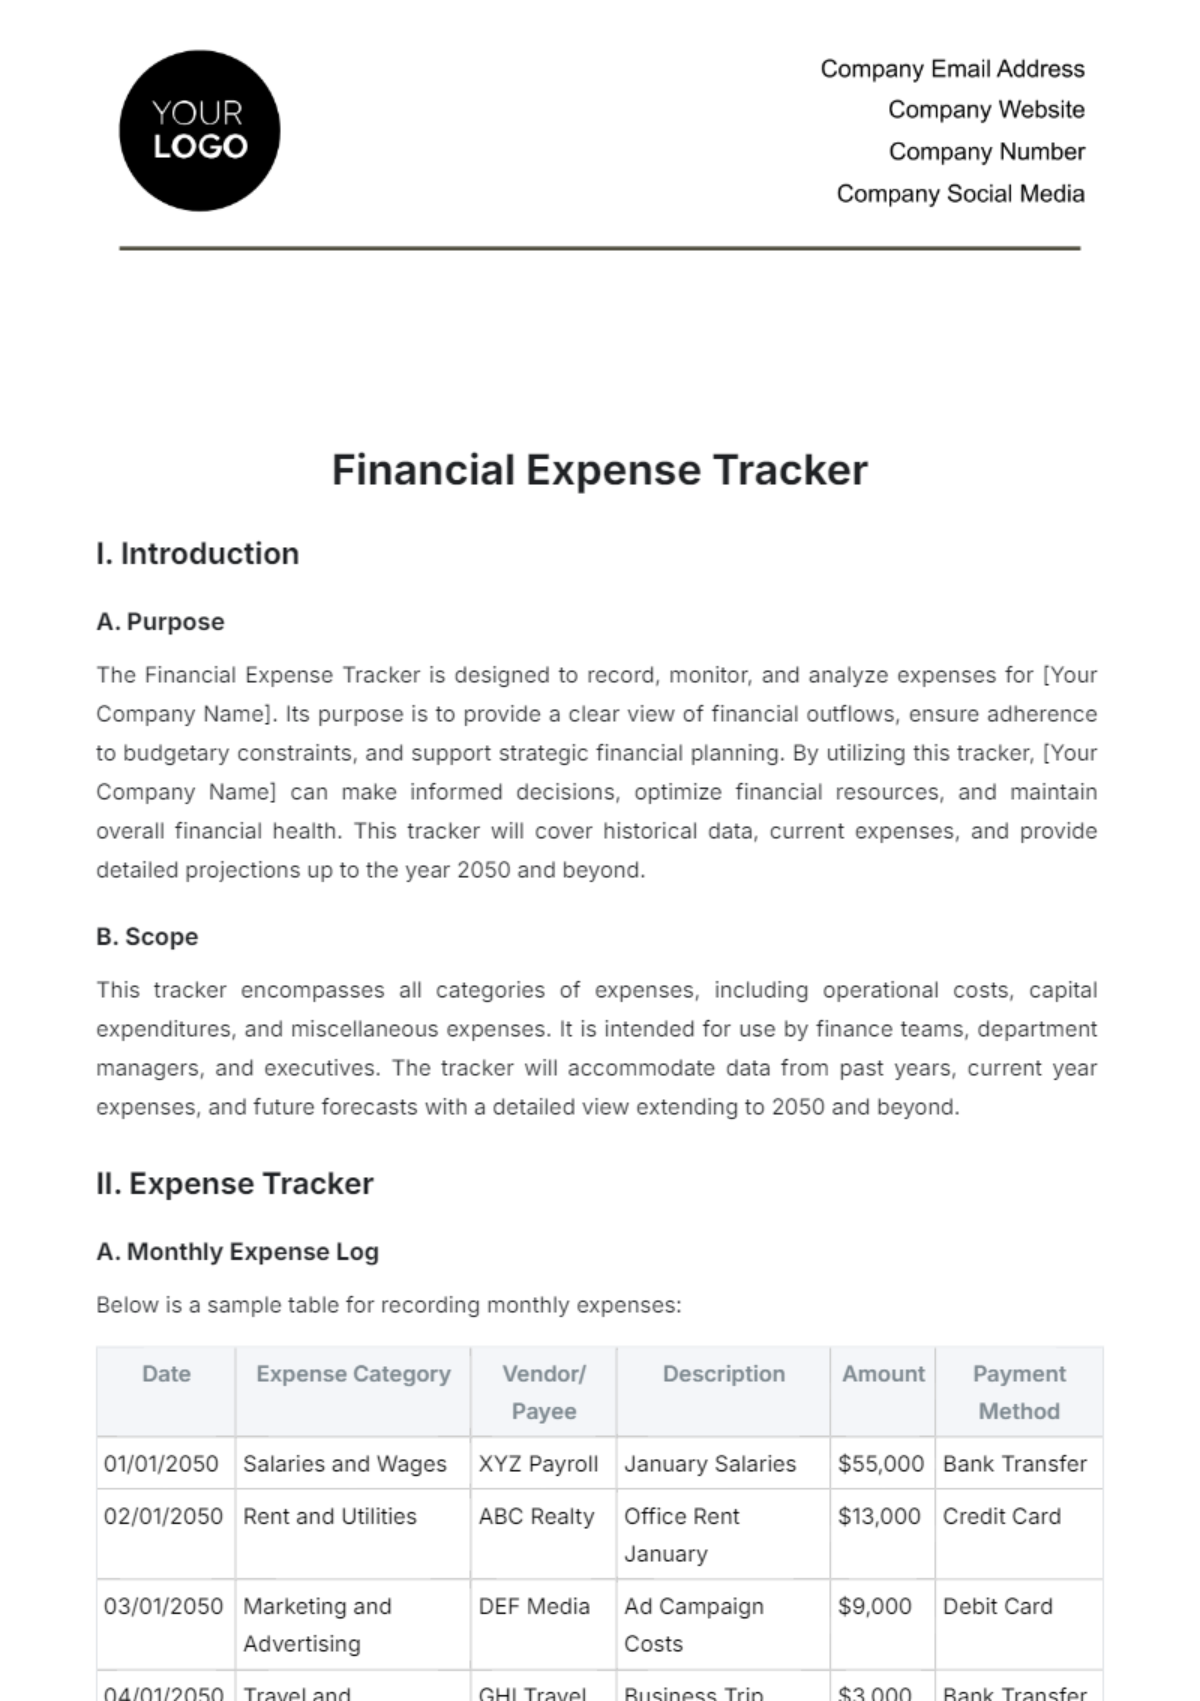
The Financial Expense Tracker is designed to record, monitor, and analyze expenses for [Your Company Name]. Its purpose is to provide a clear view of financial outflows, ensure adherence to budgetary constraints, and support strategic financial planning. By utilizing this tracker, [Your Company Name] can make informed decisions, optimize financial resources, and maintain overall financial health. This tracker will cover historical data, current expenses, and provide detailed projections up to the year 2050 and beyond.
B. Scope
This tracker encompasses all categories of expenses, including operational costs, capital expenditures, and miscellaneous expenses. It is intended for use by finance teams, department managers, and executives. The tracker will accommodate data from past years, current year expenses, and future forecasts with a detailed view extending to 2050 and beyond.
II. Expense Tracker
A. Monthly Expense Log
Below is a sample table for recording monthly expenses:
Date | Expense Category | Vendor/ Payee | Description | Amount | Payment Method |
|---|---|---|---|---|---|
01/01/2050 | Salaries and Wages | XYZ Payroll | January Salaries | $55,000 | Bank Transfer |
02/01/2050 | Rent and Utilities | ABC Realty | Office Rent January | $13,000 | Credit Card |
03/01/2050 | Marketing and Advertising | DEF Media | Ad Campaign Costs | $9,000 | Debit Card |
04/01/2050 | Travel and Transportation | GHI Travel | Business Trip Expenses | $3,000 | Bank Transfer |
B. Annual Expense Overview
To monitor annual expenses, use the following table:
Year | Expense Category | Total Amount | Percentage of Total Budget |
|---|---|---|---|
2050 | Salaries and Wages | $660,000 | 30% |
2050 | Rent and Utilities | $156,000 | 7% |
2050 | Marketing and Advertising | $108,000 | 5% |
2050 | Travel and Transportation | $36,000 | 2% |
2050 | Equipment Purchases | $120,000 | 5% |
2050 | Facility Upgrades | $90,000 | 4% |
2050 | Technology Investments | $180,000 | 8% |
2050 | Training and Development | $30,000 | 1% |
2050 | Professional Services | $45,000 | 2% |
2050 | Contingency Funds | $50,000 | 2% |
Total | $1,425,000 | 100% |
C. Trend Analysis
To assess trends, compare historical data with projected figures. For example, if salaries have increased by 3% annually from 2050 to 2070, analyze how this trend affects overall expenses and budget.
1. Trend Analysis Table
Year | Salaries and Wages Increase (%) | Projected Amount | Actual Amount |
|---|---|---|---|
2050 | - | $50,000 | $50,000 |
2055 | 5% | $55,000 | $53,000 |
2060 | 10% | $66,000 | $65,000 |
2065 | 15% | $85,000 | $80,000 |
2070 | 20% | $110,000 | $105,000 |
D. Budget vs. Actual Analysis
Regularly compare budgeted amounts with actual expenses to identify variances and take corrective actions.
1. Budget vs. Actual Table
Year | Expense Category | Budgeted Amount | Actual Amount | Variance |
|---|---|---|---|---|
2050 | Salaries and Wages | $55,000 | $55,000 | $0 |
2050 | Rent and Utilities | $13,000 | $13,000 | $0 |
2050 | Marketing and Advertising | $9,000 | $8,500 | -$500 |
2050 | Travel and Transportation | $3,000 | $3,200 | $200 |
2050 | Equipment Purchases | $120,000 | $115,000 | -$5,000 |
2050 | Facility Upgrades | $90,000 | $90,000 | $0 |
2050 | Technology Investments | $180,000 | $175,000 | -$5,000 |
2050 | Training and Development | $30,000 | $28,000 | -$2,000 |
2050 | Professional Services | $45,000 | $46,000 | $1,000 |
2050 | Contingency Funds | $50,000 | $50,000 | $0 |
Total | $1,425,000 | $1,435,700 | $10,700 |
IV. Projections for Future Years
A. Expense Growth Rate Assumptions
Assuming an average annual growth rate for different expense categories helps in planning and budgeting for future years.
Expense Category | Estimated Annual Growth Rate (%) | 2051 Projection | 2060 Projection | 2070 Projection |
|---|---|---|---|---|
Salaries and Wages | 3% | $56,650 | $76,982 | $103,227 |
Rent and Utilities | 2% | $13,260 | $16,042 | $19,563 |
Marketing and Advertising | 4% | $9,360 | $14,545 | $21,616 |
Travel and Transportation | 5% | $3,150 | $4,615 | $6,535 |
Equipment Purchases | 2% | $122,400 | $148,768 | $181,481 |
Facility Upgrades | 3% | $92,700 | $124,514 | $161,189 |
Technology Investments | 3% | $185,400 | $261,000 | $354,870 |
Training and Development | 4% | $31,200 | $46,303 | $64,100 |
Professional Services | 2% | $45,900 | $55,665 | $68,267 |
Contingency Funds | 3% | $51,500 | $69,620 | $91,490 |
B. Long-Term Financial Goals
Establish long-term financial goals and align them with projected expenses. For example, if aiming for a specific revenue growth or cost reduction, adjust the expense tracker to reflect these goals.
- 100% Customizable, free editor
- Access 1 Million+ Templates, photo’s & graphics
- Download or share as a template
- Click and replace photos, graphics, text, backgrounds
- Resize, crop, AI write & more
- Access advanced editor
Keep your spending in check with the Financial Expense Tracker Template on Template.net. This editable template helps you monitor and manage your expenses efficiently. Customize it to suit your financial goals—editable in our AI Editor Tool. Download now and start budgeting smarter!